Where Are Markets Today?
Through this morning, European and U.S. futures indicate mixed sentiment with some of the major indices poised for modest gains, yet others trading near flatlines. U.S. S&P 500 futures trade flat, indicating a mood of market stasis as investors await important inflation data due later that will potentially set the tone of the next major move of the market. Futures tied to the Nasdaq 100 followed in a similar vein, while Dow Jones Industrial Average futures gained a modest 47 points, or 0.1%. European futures equally unremarkable, as investors seek signs of economic strength or weakness. Investors wait to see if the S&P 500 will make a bid into all-time highs, having last Friday closed just points short of its February intraday record of 6,147.43.
Current mixed futures sentiment exists mostly on anticipation of future economic reports, and more specifically inflation readings. The European and American markets are stalled with investors weighing the implications of how this will influence monetary policy further ahead. The uncertainty of this is creating indecision as investors wonder if inflation pressures will persist and push the central banks into a more aggressive policy or the inflation cycle continues to stabilize. This is shown in the flat or slightly positive futures, which are indicative of investors holding out for a commitment until more conclusive signals are found. Apart from that, there is optimism with plenty of liquidity looking to enter the market. BlackRock’s Chief Investment Officer of Global Fixed Income, Rick Rieder, was highlighting there is a lot of money looking to enter the market but waiting for a lack of negative global headlines. Overall sentiment remains bullish with major indices like the S&P 500 and Nasdaq Composite having recently recorded near record highs, indicating strong underlying demand. Demand can still drive markets higher if price data starts to demonstrate signs of stabilisation, with investors betting on a global economy rebound to carry on.
In summary, the dual futures position of American and European markets is one of cautious optimism with investors pinning their hopes on inflation reports. The market is holding its breath for guidance with the potential for a breakout to the higher side if inflation is moderate or a correction if reports indicate increased pressure on prices. Both groups of futures depict the intersection of optimism and reserve as investors hold their breath in expectation of the economic report.
Major Index Performance as of June 27, 2025
- S&P 500: Closed at 5,916.93, a 0.3% increase for the day.
- Nasdaq Composite: Closed at 13,784.50, down 0.2%, putting an end to
- Dow Jones Industrial Average: Rose 0.7% to end at 38,650.00, its first gain in three days.
- Russell 2000: Closed at 2,092.10, with a modest gain, yet down 5.7
The Magnificent Seven and the S&P 500
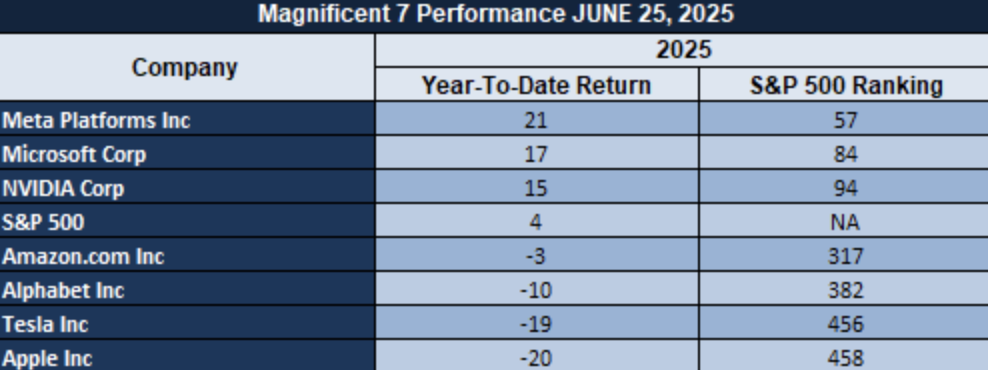
The S&P 500 has held steady, boosted by the good performance of big tech shares, which have come to be referred to as the “Magnificent Seven.” These include firms like Apple, Microsoft, and Nvidia, which have been bolstered by advances in AI and good earnings reports.
Even with these gains, wider market participation is uneven. Retail investor enthusiasm that fueled previous rallies appears to be losing steam, and analysts argue that without new investor interest, it will be challenging to maintain the uptrend.
Drivers of the Market Movement – Friday, June 27, 2025
As global markets open for trading this morning, a multitude of important drivers is influencing investor attitudes and the direction of markets both in the United States and Europe. These consist of recent economic data, geopolitical events, and political discussion influencing expectations of future monetary policy and economic stability.
- Expectation of Inflation Rates
Market players look toward the release of the idiosyncratic U.S. Core Personal Consumption Expenditures (PCE) Price Index, a preferred inflation measure of the Federal Reserve. It is expected to rise by a moderate 0.1% on a month-over-month basis, maintaining an annualized figure of 2.5%. This is an important reading because it may have a bearing on the Fed’s decision on rates. A sub-consensus reading would tilt decision makers toward rates cuts, boosting equity markets. Rising inflation, on the other hand, would quell optimism and fuel market volatility.
- Geopolitics and Trade Relations
Recent developments in U.S.-China relations have played a role in driving the positive market mood. A new agreement agreeing to accelerate Chinese exports of rare earth to the U.S. has eased trade tensions, spurring an equities rally around the world. In addition, President Trump’s proposal of a potential removal of Federal Reserve Chairman Jerome Powell has questioned the central bank’s independence, which has pushed the U.S. dollar lower and influenced investor appetite across asset classes.
- Political Statements and Market Reactions
Recent comments from President Trump have brought volatility to markets. His dissatisfaction with Fed Chairman Jerome Powell and the suggestion to replace him have added speculation over the direction of U.S. monetary policy. This has affected the value of the U.S. dollar and also impacted investment decisions, particularly in currency and bond markets. In addition, continuing trade negotiations and fiscal policy discussions remain interesting to market participants as they consider the impact on economic growth and corporate earnings.
All these combine to make up the market environment of the day, with investors balancing optimism over thawing trade tensions and hopes of dovish monetary policy against inflation worries and political risk. Throughout the day, market participants will be watching economic data releases and political developments closely for further clues on the trajectory of the global economy.
Digesting Economic Data
Trump Tweets and their Implications
Recent comments by President Donald Trump have been fueling economic and geopolitical controversy with possible ripple effects within broader financial markets. Trump’s call on canceling Israeli Prime Minister Netanyahu’s corruption trial, calling it a “witch hunt,” has increased tension between Israel and the U.S., specifically on charges of corruption against Netanyahu. Trump’s unapologetic endorsement of Netanyahu as a “warrior” and “great hero” can further polarize politics with possible effects on sentiment within markets as investors consider how U.S. political proceedings influence global relations. Such geopolitics commonly drive investors toward safe-haven assets like gold and Bitcoin, which can potentially benefit from broadening uncertainty within conventional financial systems.
Besides, Trump signing a U.S.-China agreement on exporting rare earths is poised to influence commodity markets, including precious metals and energy. By opening the door for exporting rare earths to America, this move is intended at bolstering global supply chains, particularly ones related to strategic commodities. However, even if easing trade tensions between two of the globe’s largest economies could relieve short-run tension, uncertainty about direction over the long haul still exists with respect to trade policy, with Trump’s history of reversing positions continuing to guide expectations on markets. This move has the potential to exert upward pressure on prices of energy and metals, like oil, as firms adjust to these shifts in trade relations. Trump’s continued attacks on news networks like CNN for their reports on the success of US attacks on Iranian nuclear facilities also reflect on the influence of political rhetoric on market direction. While Trump claims these attacks were incredibly successful, intelligence reports suggest otherwise, creating doubt around successful interventions into unstable areas. Such rhetoric can further introduce doubt into global markets, especially Middle Eastern energy markets concerned about stability, causing investors to hedge bets on commodities like oil and gold. Trump has also defended his new tax and budget legislation against Senate opposition, foreshadowing future fiscal pressures, which can influence investor confidence in the direction of US economic policy, indirectly influencing directions of markets in sectors like tech, industrials, and energy.
In a nutshell, Trump’s rhetoric on geopolitical issues and US economic policy continues substantially influencing investor sentiment. His words create impressions of US foreign relations and, more particularly, its involvement in trade and military intervention, directly influencing market volatility. As investors closely observe Trump’s influence on global events, particularly on trade relationships and military spending, markets’ performance will likely continue to respond with any shift in his policies or public comments. The resulting uncertainty will continue driving risk-averse asset demand and influence areas such as energy, commodities, and technology.
Mortgage Rates and Housing Market Outlook
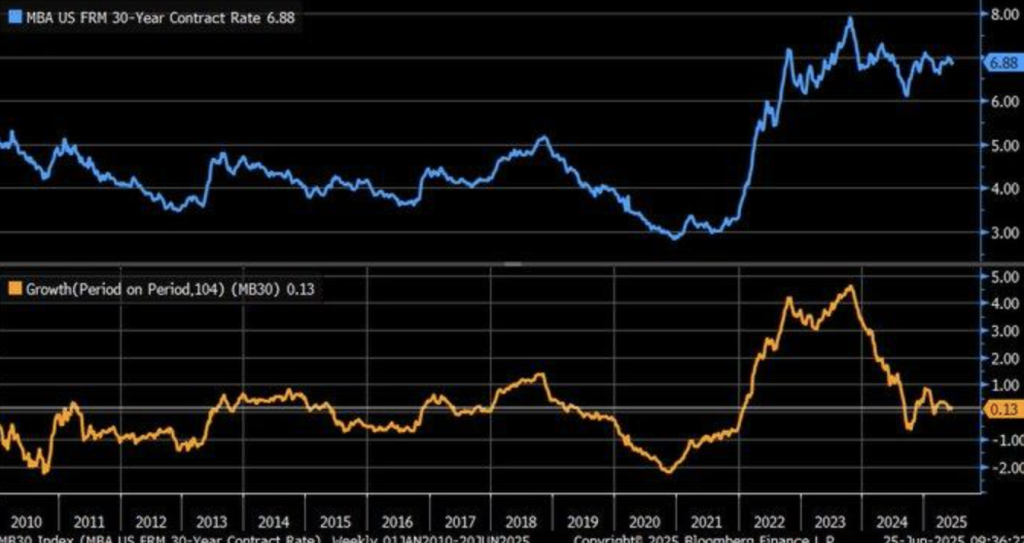
In Zaye Capital Markets, it’s worth paying close attention to the recent trend for mortgage rates, especially in light of longer-run inflation expectations. As of 26th of June 2025, the U.S. 30-year mortgage rate is at 6.88%, tracing out slightly higher over the past two years. This aligns with J.P. Morgan’s preseason forecast of only seeing rates temper back to 6.7% later on this year. Such projections will validate the current “higher-for-longer” interest rate environment promoted by ongoing inflationary stresses. It will be worth watching closely because it will have significant implications for affordability for housing, particularly with still-higher rates.
Evidence indicates that the mortgage rate volatility is coming back to its long-run median, shown in the orange line of the graph of rolling two-year change. Going back to its long-run median implies that mortgage rates are less influenced by short-run policy shifts and more influenced by long-run inflation expectations. This is also observed in findings of 2023 Federal Reserve study (FRB New York Staff Reports No. 1056), which reported that mortgage rates are less responsive to policy in the near term and more influenced by structural inflation pressures. Investors and analysts should be cautioned against expecting deep cuts, especially when inflation is persistent. Unlike general optimism—captured in HomeOwners Alliance’s expectation of falling rates—this economic information promises to be more conservative. Structural flaws, such as stasis in the housing market (J.P. Morgan, 2025), suggest mortgage rates will be elevated for longer, impacting the affordability of housing despite relative stabilization of two-year trend behavior. As analysts, insight is gained from seeing first-hand how demand for house and living accommodation will still be constrained, but how stock valuations, particularly those for the housing market, can still be suppressed based on these persistent pressures.
New Home Supply and Pressure on Housing Markets
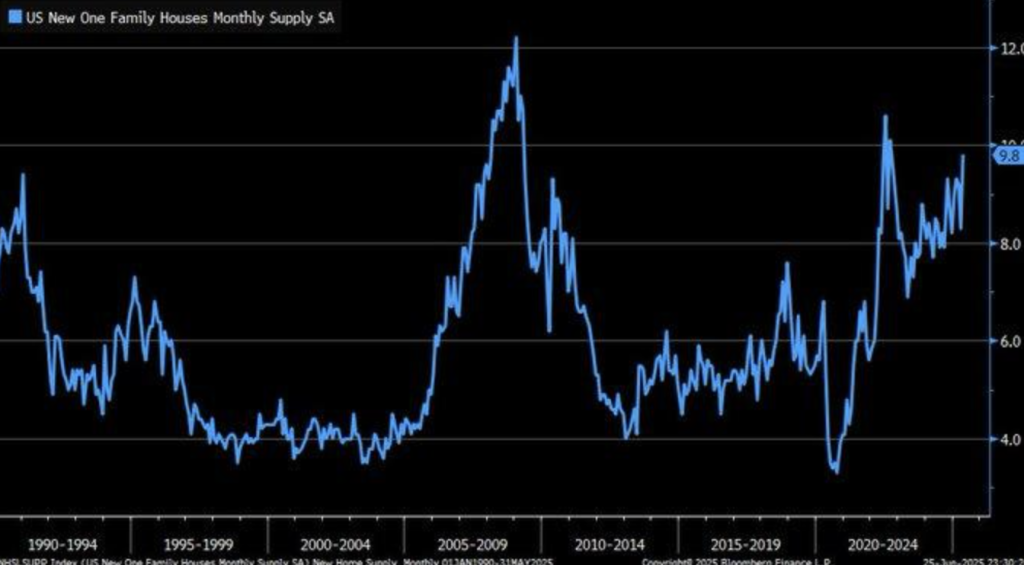
Recent statistics on new home supply in the U.S. at Zaye Capital Markets indicate an alarming trend that could have serious implications on the housing market. New home supply through June 2025 is up to 9.8 months, approaching the 12 month high of 2006 on the eve of the housing market crash. This increase in supply is an indication of an oversupply in the market and can be setting up for price corrections in the near future. Records from the Federal Reserve for the past are supportive, where a month’s supply over 6 was previously always a buyer’s market, where demand was no longer outpacing supply.
Despite rising inventories, house prices have not ceased their ascent, with a surprise 8.7% price appreciation in 2024. The reason for this contradiction is to be sought in a mix of falling mortgage rates and a persistent shortage of houses, writes ABN AMRO’s analysis of the 2025 housing market. The demand-supply gap, however, is fraught with serious risks for the market. With the mortgage rate stabilizing, the issue is whether demand for new homes will be in sync with the increasing supply or whether price correction is around the corner. Researchers must monitor carefully shifts in buyers’ attitudes and mortgage affordability, for these will be the drivers of house prices. Also, National Bureau of Economic Research study indicates that supply bursts for houses are more likely to be together during recessions, particularly when demand fails to keep pace. It questions how prolonged the housing market boom will be and how affordability, particularly for price-pinched purchasers, will be, creating uncertainty for buyers. While we are digesting all this economic news, observers need to be on the lookout for any sign of broader market rebalancing, which will determine how equities of house-related stocks perform and potentially create opportunities for undervaluation across the sector.
Tariffs, Inflation, and Economic Slowdown
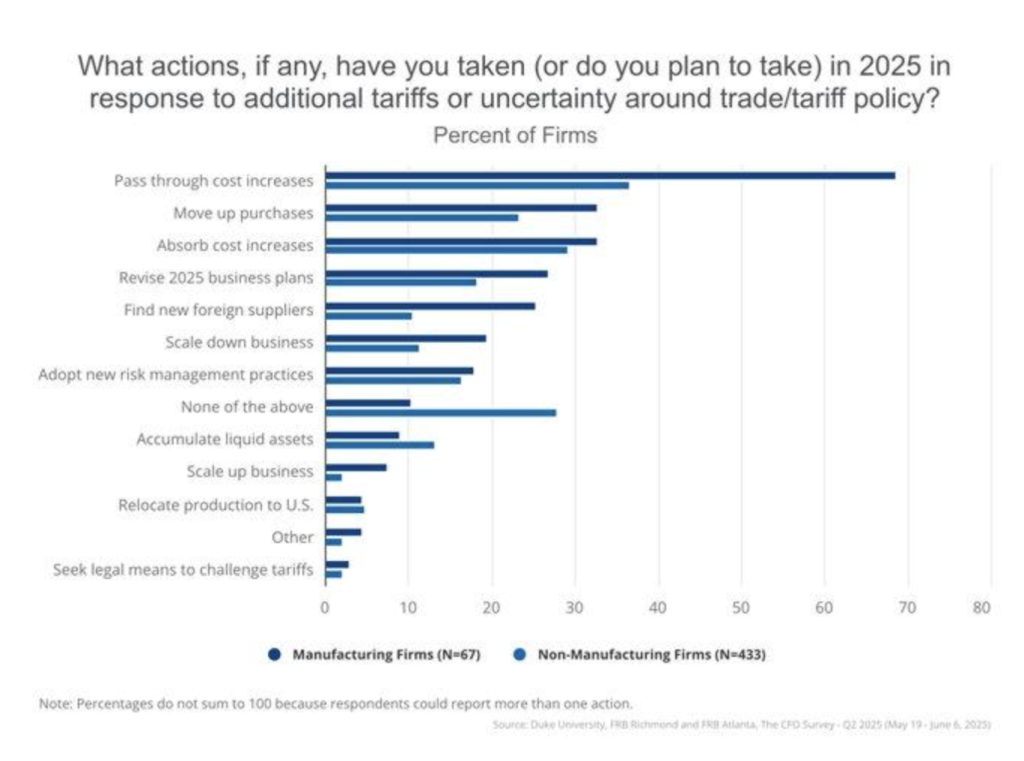
At Zaye Capital Markets, the newest survey results from the Federal Reserve and Duke University reveal an interesting trend on how firms are transferring tariff-induced cost increases. According to the survey, 60% of CFOs are transferring costs to consumers, an exercise corroborated by a 2019 study by Alberto Cavallo et al., as it showed that Chinese import tariffs brought about by imposition were largely transferred to prices of U.S. imports. This trend will continue, with pressure on inflation having an influence on consumer consumption and aggregate prices. From an analyst standpoint, we can expect pressure on inflation to continue unless there is a drastic shift in trade policy or consumer spending.
Interestingly, even as costs from tariffs are being transferred to customers, a mere 33% of CFOs are actively engaged on initiatives such as creating alternative suppliers or altering business models to neutralize effects of tariffs. This bias of cost escalation over structural adaptation is contrary to corporate agility in a backdrop of uncertainty of trade. That a large proportion of firms is opting to pass on costs as an increase in prices, rather than altering their organizations, is a sign of short-termism which may prove difficult to sustain over a period of time. Observers should monitor if this phenomenon leads to consumer backlash or changes in elasticity of demand, which would influence aggregate market movements. The broader economic implications of these trends are becoming clearer. Recent GDP adjustments to a Q1 2025 -0.5% decline combined with a rise in the Core PCE Price Index to 3.8% are a sign of amplification of economic slowdown by cost-push inflation spurred by tariffs. Supply-side shock such as caused by tariffs has, according to economic theory, the effect of reducing aggregate demand as costs rise and consumer purchasing power is eroded. This makes it important to monitor inflation data and corporate earnings reports closely because these may signal undervaluation opportunity in groups exposed to cost-push inflation.
Divergence of Home Sales and Market Implications
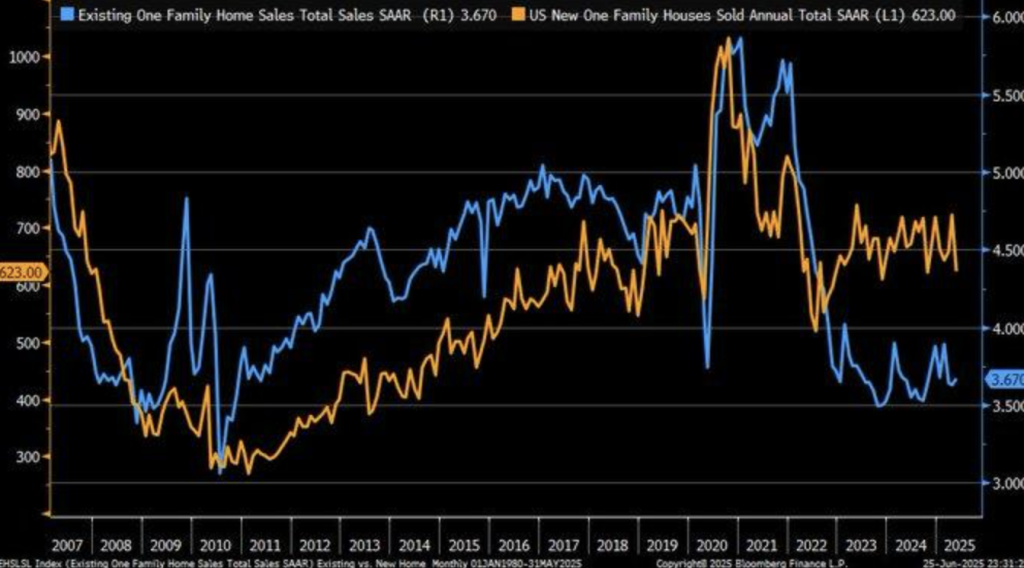
For Zaye Capital Markets, the latest figures indicate stark divergence within the U.S. housing sector that indicates long-term troubles. New single-family home sales have decreased to a multi-year low of about 600,000 per annum since 2022, while existing-home sales stabilized at about 4 million. The divergence indicates a slow recovery in the housing sector, majorly caused by high-interest rates. According to National Association of Realtors (NAR) data, existing-home median prices hit $422,800 as of May 2025, with just 4.6 months of supply, further affirming the housing sector tight supply snapshot. An indicator of shifting demand patterns or additional stagnation should concern analysts with high-interest rates persisting in the next few months.
Federal intent to maintain rates above 5% in 2025 as an anti-inflationary measure will rein in new home building. Higher levels of borrowing on the constructors’ part, as confirmed by an NAHB study in 2023, already took housing starts down by 15%. This kind of trend and rising rates will ensure that new home building stays subdued, which will further spur inventories’ shortage. With lesser supplies of new homes in the market, analysts need to pay attention to how such pressures get manifested in the overall housing affordability as well as the demand for used homes. Contrary to other more optimistic real estate appraisals, inventory shortfall now exacerbated by low-rate owners holding on to property is indeed a real constraint on markets. Economic models created by the Urban Institute indicate this “lock-in effect” of homeowners refusing to sell on their advantageous mortgage rates will delay market normalization after 2026 unless a steep decline in rates occurs. This persistent supply drag coupled with increased interest rates requires forecasters to exercise caution calling for a rapid recovery of home markets.
US Bank Trends and Industry Shifts
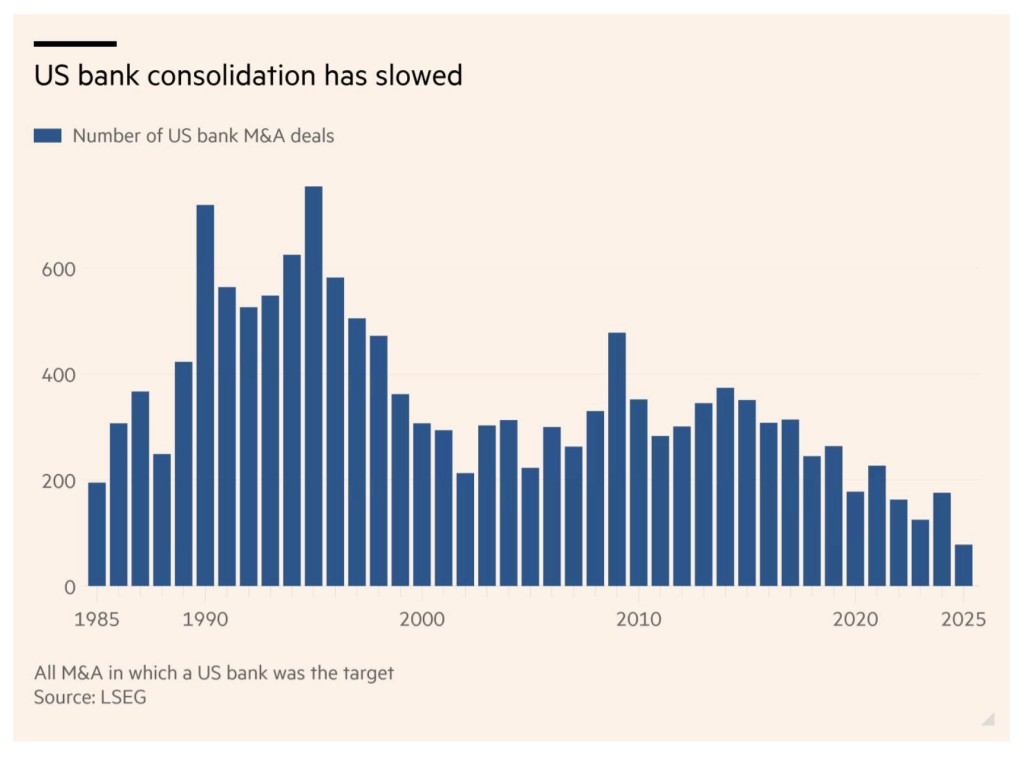
At Zaye Capital Markets, we’re observing a steep decline in America’s banks’ merger and acquisition (M&A) activity. The chart reflects the sudden decline from over 500 deals annually during the late 1990s to 78 deals in 2025, reflecting shifts to a changing financial industry profile. The trend indicates long-term impacts of increased supervisory strictness following the 2008 financial shock. Researchers need to monitor any subsequent supervisory fine-tuning or market tendencies that will influence subsequent M&A deals in banking.
This decline in bank M&A activity is part of a broader trend following the global financial crisis, wherein non-crisis M&A activity has declined by 50%. Increased regulatory pressures and increasing costs of technology integration have created a tougher environment for consolidation. This shift implies that bank merger possibilities may increasingly depend on regulatory overhaul or fintech advancement rather than traditional bank growth strategies. Market watchers need to pay attention to trends and movement on regulatory policy as well as technology because these will serve as drivers able to foretell the next round of consolidation or diversification in the sector. While this latest slump in M&A is different from previous trends toward bank consolidation as a model of industry growth, it also signals uncertainty about the direction of the industry as a whole. The lowered merger rates may simply reflect saturation within markets or a strategic move toward financial technology innovations. Such a shift in paradigm can reverse the notion of inevitable banking monopolies and suggest that bank success can manifest through different, technology-driven models rather than traditional models of consolidation. To this extent, one can continue to watch as fintech continues to redefine the financial services sector.
CFO Optimism and Tariff Effects
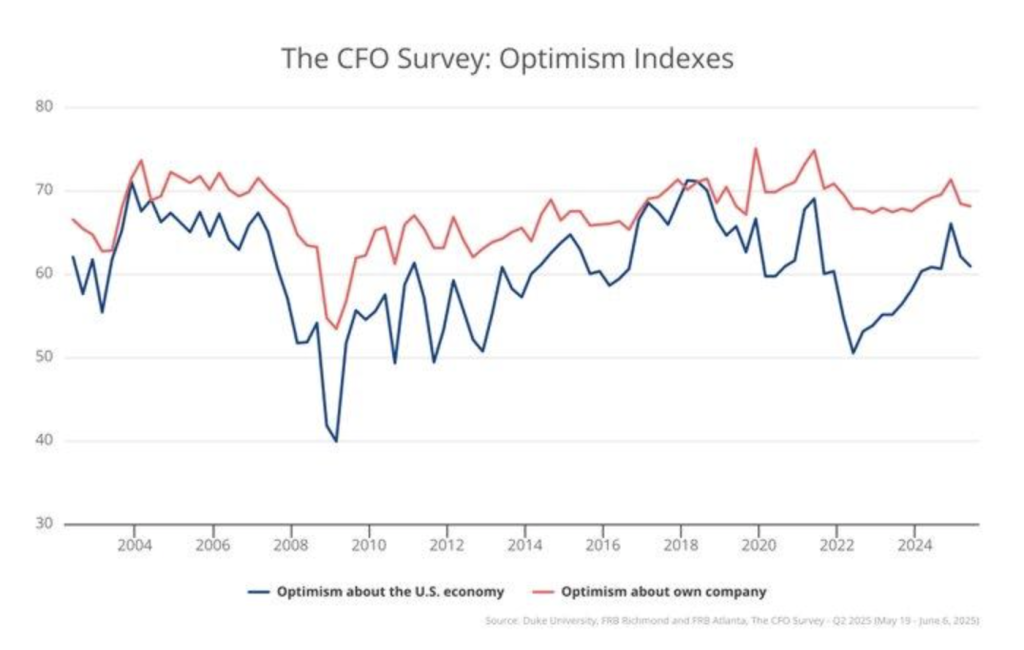
At Zaye Capital Markets, the CFO optimism index’s decline to 62.1 from 66.0 during Q1 2025 reflects increasing concerns regarding tariffs and trade uncertainty. This shift in sentiment reflects similar economic apprehension about increased U.S.-China trade tension. According to a recent Richmond Fed report, GDP growth projections have declined from 2.2% to 1.9%, an indicator that business leaders are having to adjust their projections as tariffs rise and potential ripples spread through global supply chains. As analysts, we anticipate a potential slowdown of corporate earnings as corporations adjust to these changing trade realities.
The recently signed trade pact between China and America makes matters even tougher, with possible extensions of July 9 deadlines on the horizon. This renders the broader economic forecasts more complicated and signals firms, particularly those with global exposures, will face even tougher hurdles to overcome. Higher tariffs will exert upward pressure on manufacturers’ cost of doing business within America, with a chance of these getting transferred on to consumers as well, adding extra pressure on prices. One will need to monitor closely any shift in corporate behaviour, particularly how firms plan on bearing or passing on these tariff-related costs, as this will have an influence on earnings as well as mood within markets.
In the past, a 2023 Journal of Financial Economics study concluded that CFO pessimism has been able to forecast economic slowdowns 6-12 months ahead of time. Such a trend would mean that this current dip in optimism portends a broad economic slowdown, impacting consumer and corporate investment. With impacts of tariffs and trade observed, there is a need to assess how these would hit key sectors, particularly those relying on international trade – tech and manufacturing. Possible delays of trade deadlines alongside tariffs could cumulate into a period of prolonged economic uncertainty, which will require thorough research and planning from investors and businesses.
Housing Market Price Trends and Supply Dynamics
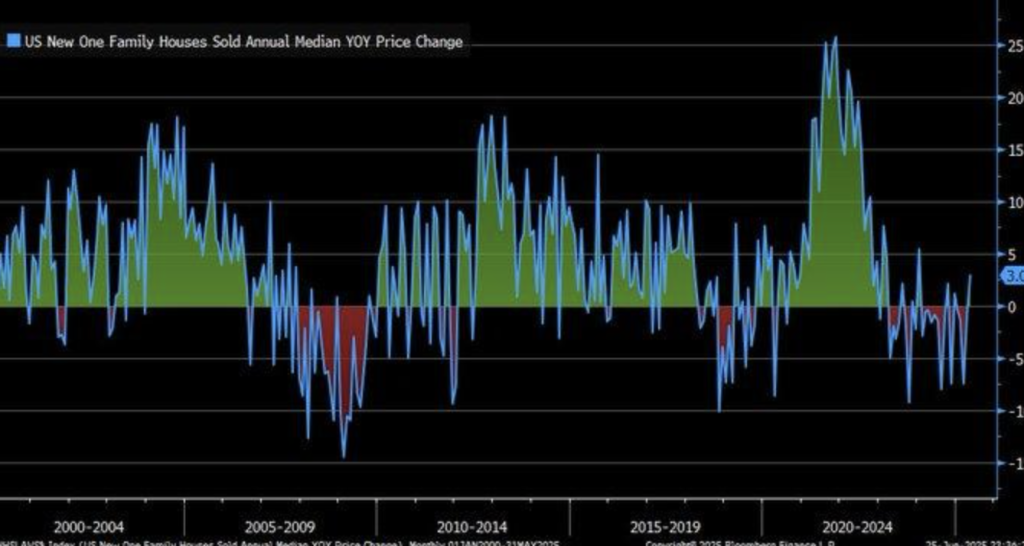
At Zaye Capital Markets, the latest statistics present a mixed picture of housing markets. New single-family home prices appreciated year-on-year on median by 3% in May 2025, their best performance since January 2024. This bounce back from the financial crisis in 2008, when prices fell by over 10% annually, is a reflection of the resilience of the market in the midst of present economic woes. Short-term volatility still exists, though, with the Redfin Home Price Index posting a 0.1% decline for May 2025. Such declines may be seasonal or brought about by evolving buyer demand, and therefore it is still important for analysts to monitor supply, demand, and overall economic pressures in the coming few months.
While the broader housing market may show signs of volatility, long-term projections are fairly optimistic. One prediction by Zoopla expects 5% growth in sales volume in 2025 with modest inflation continuing to sustain the market. Redfin regional data, however, paint a more mixed picture, with a 0.7% year-on-year growth in prices in some areas alongside a 4.9% decrease in sales volume. This disparity is indicative of a fragmented housing environment where prices of new homes are going up due to supply shortages, rather than a broad rise in demand. Analysts have to examine these regional trends as well as how local supply-demand imbalances will influence broad market performance. Present trends defy the suggestion of a uniformly slow housing market and reflect that supply constraints remain a fundamental impetus of price growth on new homes. Despite broad volatility and sales volume variations by region, however, there is a general trend of an enduring tight supply situation underlying price increases on particular segments. There will therefore need to be a keen examination of regional patterns of sales volume and price changes by analysts because they will contain informative signals of underlying health and housing market patterns going ahead.
Housing Market Slowing and Interest Rate Pressure
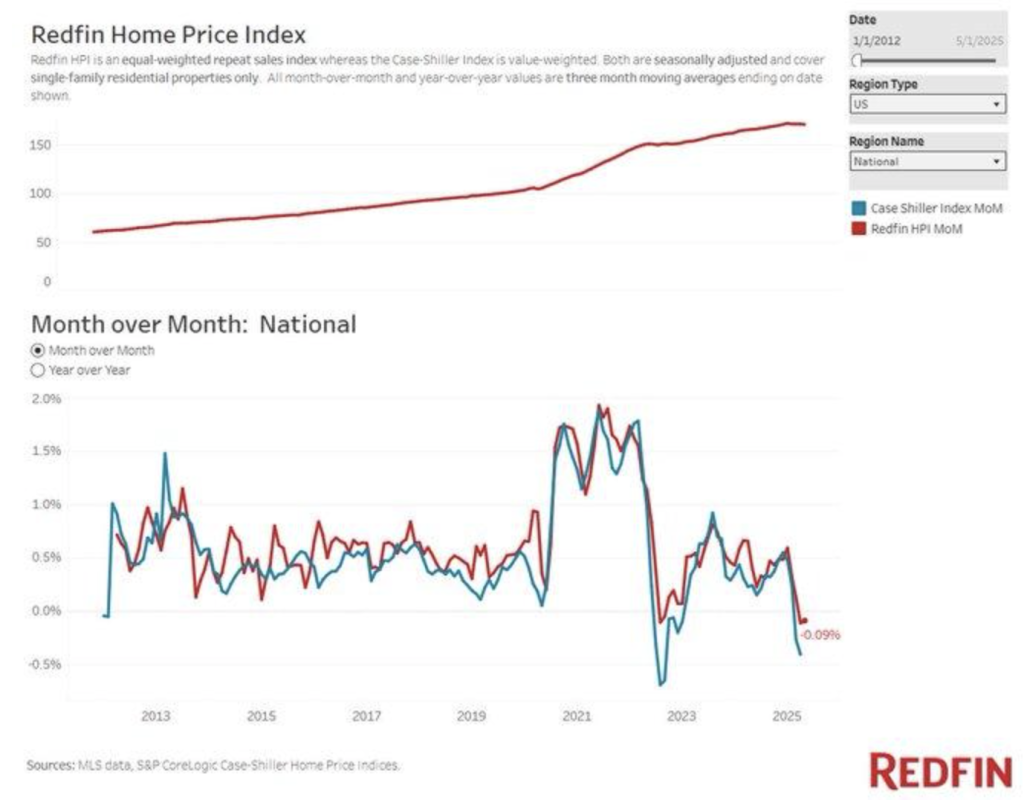
At Zaye Capital Markets, the 0.1% drop in Redfin’s Home Price Index (HPI) in May 2025 is noteworthy, having occurred only three times since 2012. The drop can be an indication of a slowing housing sector, possibly caused by rising interest rates, a phenomenon supported by a 2023 Federal Reserve report attributing rate rises to housing price corrections. Analysts are advised to be wary, since further rate hikes can spread downward pressures on housing prices, especially if mortgage rates continue to rise.
The long-term trend of home prices has been strongly upwards, yet this latest dip conforms with the 6.88% 30-year mortgage rate. According to a 2024 study conducted by the National Bureau of Economic Research (NBER), home prices would typically dip 2-3% with each 1% increase in mortgage rates. Since rates continue to remain high, analysts will look for the continuing influence on affordability, which can constrain buying demand and depress the market further. In fact, even with the comparatively high median home price of $440,913, the housing market is still firm, which indicates the influence of rate hikes may perhaps not be universal. Historical precedent during the 2008 financial crisis, when a similar fall of the HPI predicted a 30% decline in housing prices, sets alarms ringing for potential economic distress. But recent numbers from Redfin indicate regional home price fluctuations rather than a comprehensive market collapse. This would mean even as some regions can witness price correction, others can remain robust depending on regional supply-demand patterns. Therefore, analysts need to monitor regional price patterns and observe how elevated interest rates are impacting individual housing markets.
Manufacturing Index Suggests Potential Growth
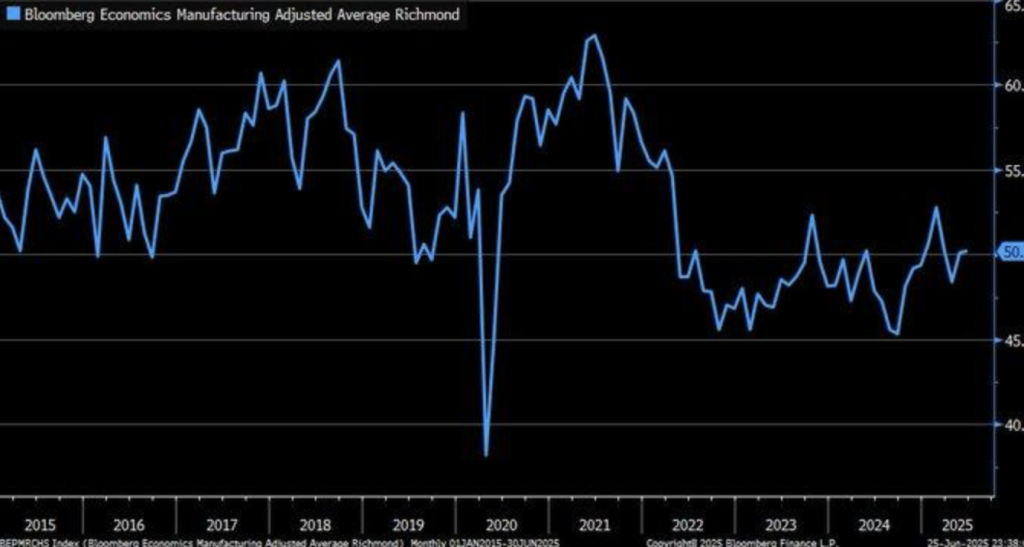
The Richmond Fed Manufacturing Index jump to 50.2 during June 2025, ISM methodology-adjusted, signifies a shift from a long cycle of industrial decline into one of moderate growth. The rise is a reversal of a sharp decline posted in about 2020 and may signal an industrial production rebound in America. We as researchers must look at this as an early indicator of economic growth, especially given that manufacturing indexes of 50 and above had previously been observed to correlate with increasing industrial output, a 2023 National Bureau of Economic Research paper has noted.
Despite ongoing global supply chain interruptions, as reported by the World Bank in 2024, this move above the manufacturing index is a sign of strength within the U.S. economy. It could be a sign of strength on the part of American manufacturers in adapting to external pressure and perhaps even benefiting from a pickup in domestic demand. This move above 50 is a sign that even as global patterns of trade remain unpredictable, American manufacturing will experience moderate expansion in the near-term future. Analysts need to keep an eye out for how this expansion translates into economic expansion in future timeframes. The revision of ISM methodology makes regional economic performance clearer and on par with national manufacturing reports. The turnaround contradicts regional pessimism of recent years and has implications of a healthier U.S. manufacturing industry than initially anticipated. As everything is volatile with global trade, scholars will need to investigate how this strength can last, particularly in those industries associated with global supply networks and flows of trade. The next few months will become important in determining if this moderate growth is the beginning of a more prolonged resurgence of the U.S. manufacturing industry.
CFOs’ apprehensions about Trade and Tariff Effects
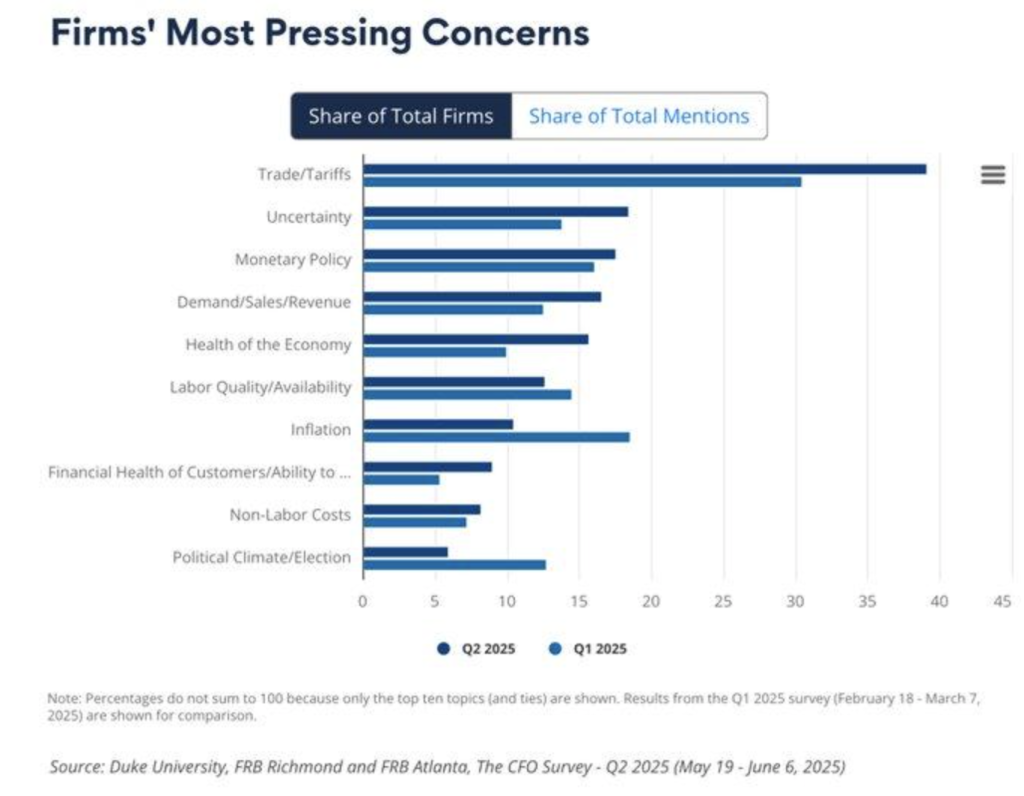
In Zaye Capital Markets’ Q2 2025 CFO Survey, trade and tariffs become the most pervasive CFO concern at 45% of all references, surpassing monetary policy as the highest referenced issue. There is a strong likelihood this is because of increasing fears over global trade tension following recent hikes in U.S. tariffs on Canada, Mexico, and China during early 2025. While disruption of trade is at the forefront of their minds, CFOs are clearly considering the larger economic implications of these policy shifts and suggesting their strategies down the line will need to account for these increased risks.
The magnitude of these tariffs’ impact on consumer prices is significant, shown by a 2023 National Bureau of Economic Research (NBER) study that projected a 10% tariff rate would increase consumer prices by 0.4%. Inflation would increase by 1-2%, with additional cost pressures, based on 25% tariffs on Canadian and Mexican products. The CFOs’ worry about these trade-related shocks aligns with the potential for higher inflation, which can impact corporate margins and consumer spending power. Analysts must monitor inflation data closely and cost structure shifts by companies with exposure to tariff-hit industries. Despite optimistic projections of growth of world trade, such as UK June 2025 projection of doubled trade, the survey focus on tariffs contradicts this trend. It draws rather a picture of risk of fragmentation of global supply chains, with data on U.S. imports over the past two months showing a reduction of 36.2% of consumer goods. Analysts must beware of the possible spillover of such trade tension, as these could go on to bring about long-term disruption and shifts of world trade patterns, ultimately to influence market mood and investment choices.
US Trade Deficit and Its Economic Implications
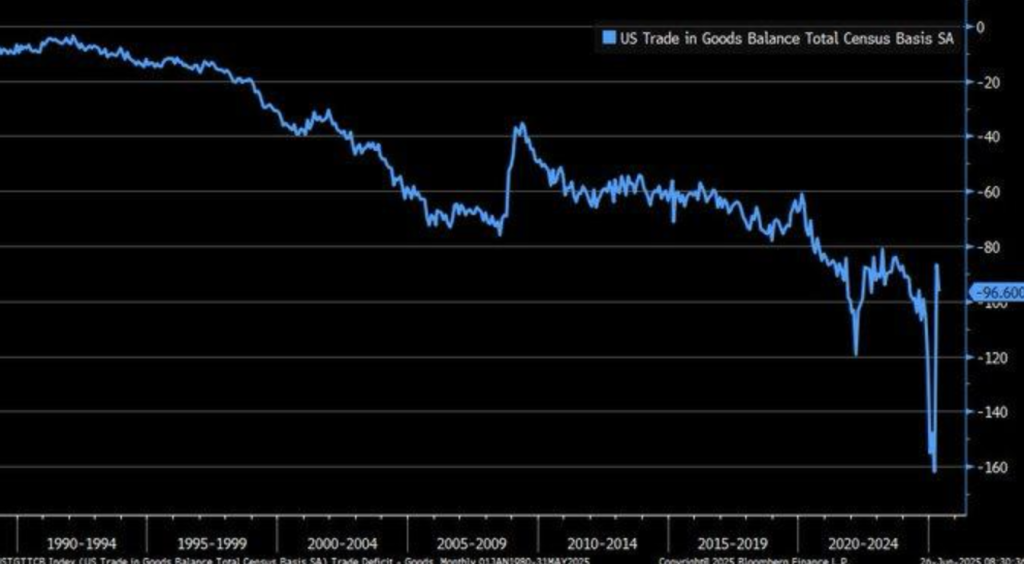
In Zaye Capital Markets, the sharp rise in the U.S. trade deficit in goods to $96.6 billion in May 2025—well above the forecast $86.1 billion—indicates a disturbing pattern of falling exports and flat imports. The 5.2% drop in exports indicates the broader impact of recent U.S. tariff measures, which likely have rattled global export markets more than initially anticipated. With increasing trade barriers, there are chances that U.S. goods are facing diminishing foreign demand, further expanding the trade deficit. Researchers should watch if the trend continues in the future months and how tariff adjustments would influence export growth.
This widening deficit is corroborated by economic research, such as a 2021 National Bureau of Economic Research paper, which determined tariffs can reduce volumes of trade by 20-30%, mainly as a consequence of retaliatory measures by trade partners. This is with respect to potential indirect consequences of protectionism which may deter foreign trade as well as distort long-term global supply networks. America relies on global markets for exportation, so it is vital researches measure how ongoing tariff warfare is impacting trade flows, particularly in key areas of technology and manufacturing. This differs from the typical interpretation of trade deficit as a sign of consumer strength and instead suggests structural weakness in U.S. export markets as the deficit widens. As the deficit grows, there is a need by analysts to account for the likelihood of the effect on the U.S. currency and general sentiment, with a widening deficit having the potential to put pressure on the currency over the long term, most especially where export growth remains lacklustre.
US Unemployment Claims and Trends in the Workforce
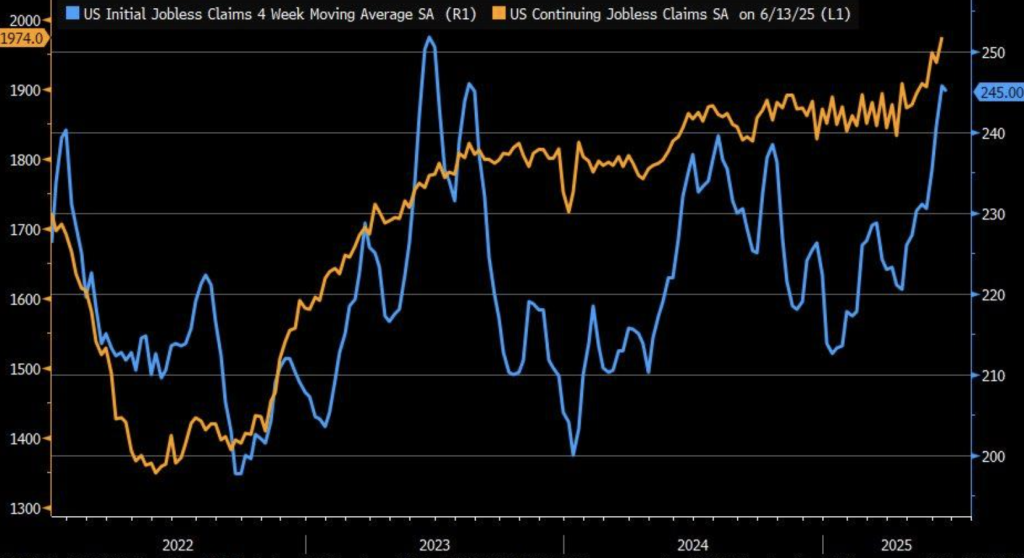
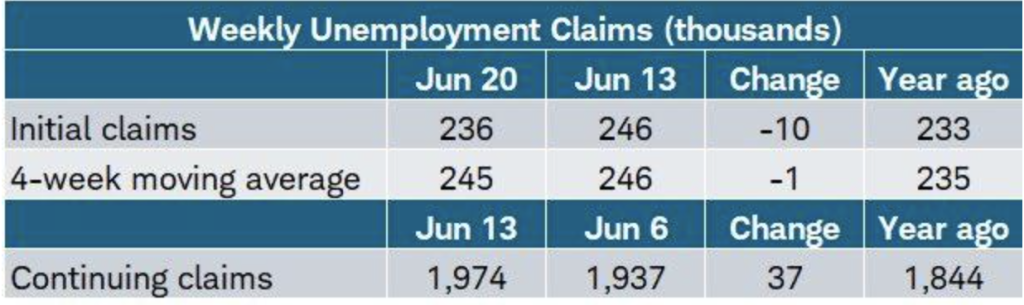
At Zaye Capital Markets, the latest data on America’s jobless claims present conflicting indications on the employment front. Although initial jobless claims fell to 236,000 as of June 21, 2025—lower than anticipated—continuing claims rose to 1.974 million, a level last observed in November 2021. The disparity supports a weakening job market, perhaps on account of the recent tariff measures, which can erode firm confidence as well as hiring plans. As analysts, we must keep an eye on these rising continuing claims because they can signal incipient deflationary pressures even at a moderate rate of layoffs.
Labor Department statistics, as supported by an analysis done by Oxford Economics, show that while layoffs remain subdued, muted hiring and a steep increase in ongoing claims have occurred. The four-week average, which has flattened at 245,000, shows a slowing labor market potentially concealing the truth about the strength of the job market. The indicators are that while the labor market remains very stable, cracks may be starting to emerge in the context of broader economic uncertainties. Analysts must watch for further proof of cooling job trends that may be indicative of a further economic slowdown. In history, a steady rise in continuing claims has been shown by research done by the National Bureau of Economic Research (2023) as a precursor which has preceded rises in unemployment by 2-3 months. This corroborates existing trends of labour markets that suggest the Federal Reserve may resist forecasted cuts, even as markets anticipate them. On this premise, and based on Fed Chair Jerome Powell’s recently reserved tone, analysts must prepare themselves for a cycle of higher rates spanning a prolonged period of time, as this is what will impede growth of prices, even as leading signs of a slowing down of the labour market start showing.
CFNAI Reports Slowing Economic Progress
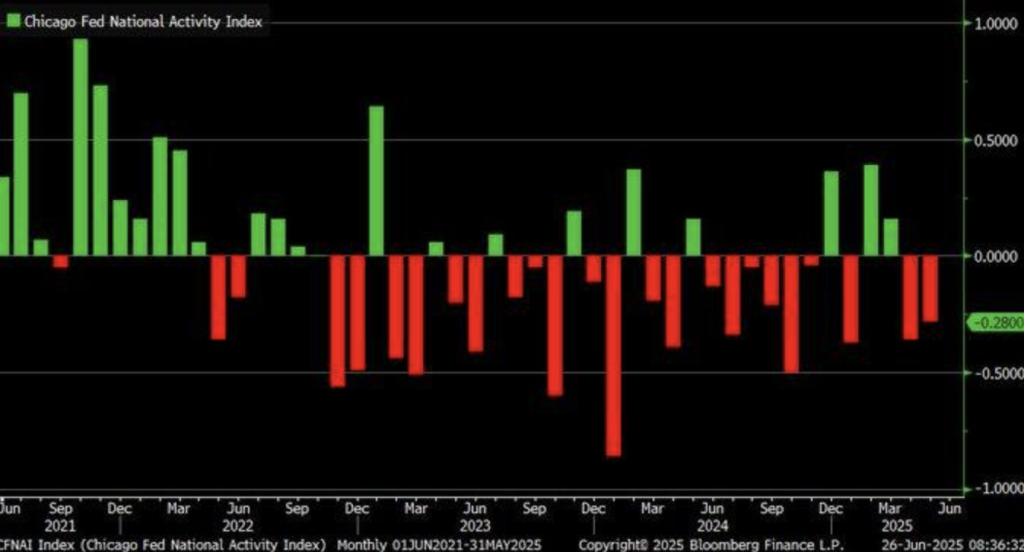
At Zaye Capital Markets, May 2025’s Chicago Fed National Activity Index (CFNAI) fell to -0.28, down from a revised -0.36 and versus an expected -0.13. This signals weaker-than-forecast economic activity, and readings below -0.70 historically have led into recessions, according to data from the Federal Reserve Bank of Chicago. Analysts will need to monitor this indicator for this type of ongoing weakness closely because prolonged weakness would signal broader economic slowdowns, which would have repercussions on both consumer sentiment and corporate profitability in the near term.
This slowing is one of broader concerns for 2025, including uncertainty about U.S. trade policy and decreased hiring levels. The National Retail Federation report signals a transition in growth, as deep-seated shifts within the U.S. economy begin to take hold. These trends all suggest economic growth entering a tougher phase, with traditional drivers of growth such as robust consumer spending and strong hiring perhaps no longer able to drive economic momentum in a favorable direction. Pay attention to how quickly these developments occur, as well as how they impact industries such as retail and manufacturing.
The latest dip of CFNAI combined with uncertainty of policy on trade and downbeat hiring trends is cause for concern about structural shortcomings with America’s economy. Amidst good narratives spun by financial press, these numbers translate into caution being warranted. Pay attention to key metrics that will delineate America’s resiliency against withstanding downturns and how businesses will adapt their strategies under these changing pressures. These changes will be indicative of wise investment choices as economic situations continue to change.
Core capital goods orders and international trade dynamics
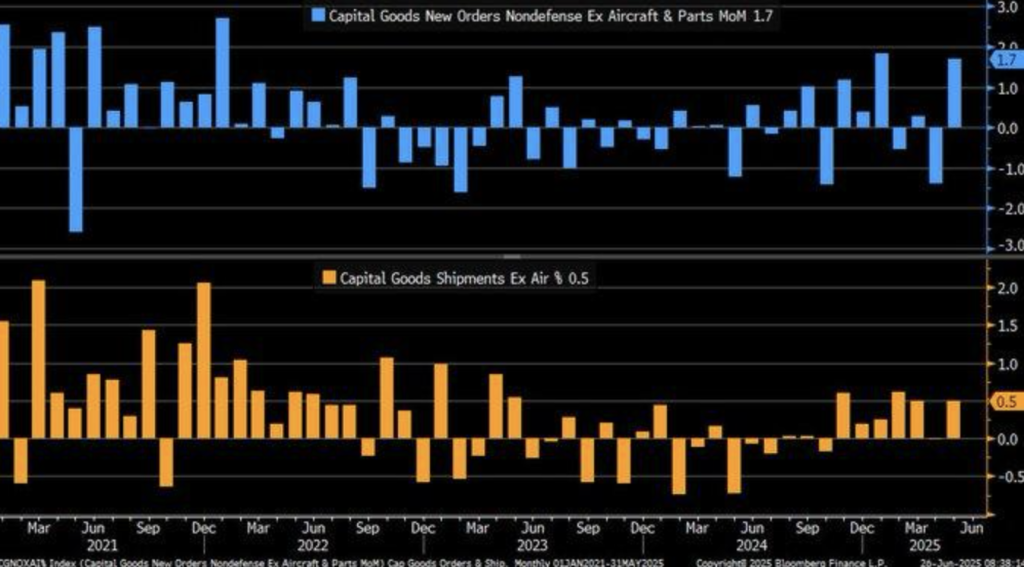
At Zaye Capital Markets, the surprise 1.7% month-to-month increase in core capital goods orders at 2025 far exceeds the prediction of 0.1%, a sign that GDP growth to come may be about to accelerate. The increase reverses last month’s -1.4% fall, a sign that manufacturing business investment may be getting back on track. Based on data from the U.S. Census Bureau’s M3 survey, increases in core capital goods orders such as these are usually read as leading indicators of economic health due to their early role in production cycles. One should see if the pattern repeats, since it might have strong predictive power regarding the overall economy’s trend.
In addition, deliveries of core capital goods rose by 0.5%, exceeding a predicted -0.1% and suggesting improved immediate manufacturing activity. This rise also supports the fact that production levels are levelling out after a series of slownesses. Such measures allow one to estimate the well-being of an industrial sector as they can predict a future expansion or contraction in the economy. During an atmosphere of global trade tension, this rise suggests corporations’ possible preparedness to adapt to changing markets. This positive shift in manufacturing activity, however, is against a backdrop of heightened global trade tensions, specifically following the 10% tariff hike on April 2, 2025. Such trade actions can encourage firms to front-load orders in hopes of a potentially costly and disrupted supply chain. This phenomenon of front-loading can temporarily spur orders and shipments, and this could contribute to part of the improvement of late. Analysts will need to look through the longer-term impacts of such trade actions on worldwide supply chains and how this will influence manufacturing trends, especially if tariffs continue disrupting global trade flows.
Slowing growth and inflationary pressures
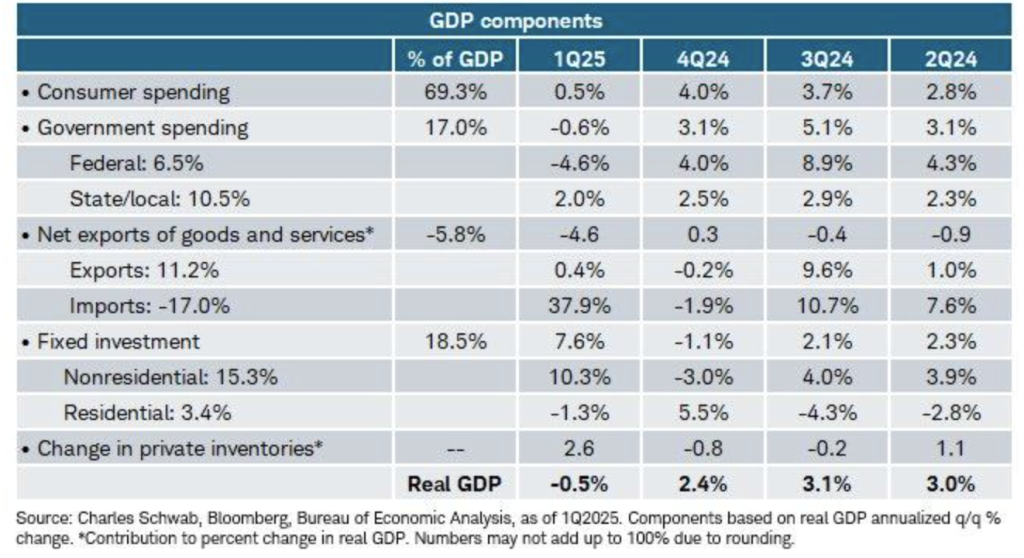
At Zaye Capital Markets, the Q1 2025 GDP decline of 0.5%, revised lower from the original -0.2% estimate, is a potential worsening economic slowdown. A leading cause of the revision is the weakening in personal consumption spending, from +1.2% to weak +0.5%, reflective of weaker consumer demand in the backdrop of overall economic uncertainty. The revision also corresponds with data from the Bureau of Economic Analysis that shows weaker consumer spending as the potential driver of the overall economic slowdown. Analysts would do well to observe how existing economic conditions, including inflation and global trade disruption, have the potential to continue to weigh on consumer confidence and demand in the coming quarters.
The increase in the Core PCE Price Index from 3.7% to 3.8% indicates a continuation of inflation pressures, a concern of utmost relevance to the Federal Reserve. A Federal Reserve study in 2023 highlighted how food and energy exclusions provide a better representation of underlying price stability, and the larger core PCE numbers are a reflection of the possibility that inflation might be more entrenched than initially anticipated. As prices remain stubbornly above levels, the possibility of stagflation—a scenario in which growth stalls, but inflation rises, creating a challenging environment both for policymakers and corporate companies—is increasingly becoming a concern.
This data deviates from brighter market projections and signals potential stagflation risk, a trend observed during the 1970s economy of America. During this period, both economic growth and rising prices were driven by such noneconomic determinants as oil shock prices and supply shortages. The same GDP and inflationary patterns observed in 2025 data raise concerns of stagflation as a looming threat, with growth concerns and pressure on prices bringing about imbalances into the economic environment as a whole. Observers need to pay attention and monitor how these patterns may continue to develop, particularly against the backdrop of policy decisions of the Federal Reserve and markets’ expectations.
Adjusted Gdp Shrinkage And Tariff Effect
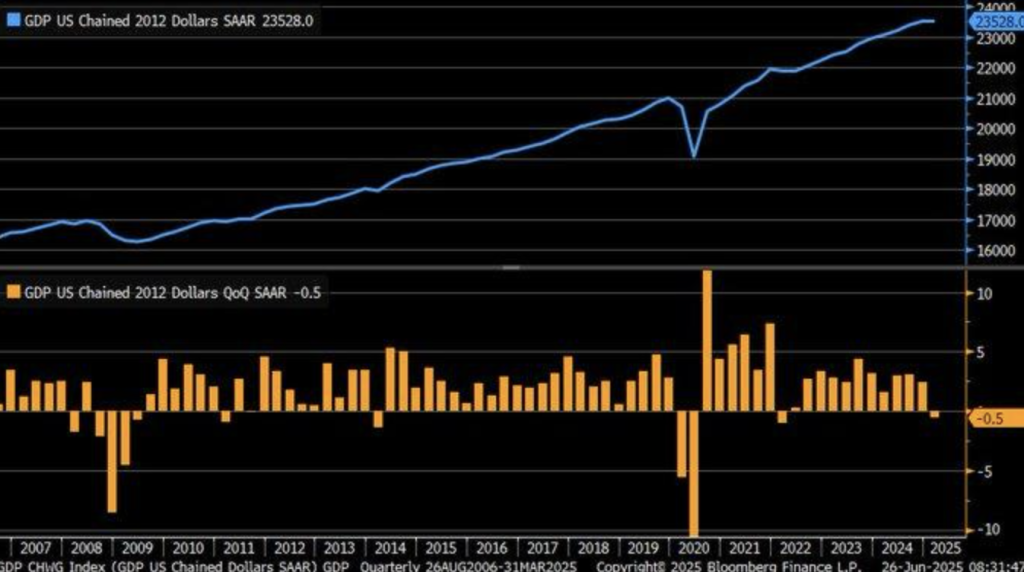
At Zaye Capital Markets, the lower revised U.S. GDP decline of -0.5% during Q1 2025, from an original estimate of -0.2%, suggests deeper economic problems. The sharp decline in personal consumption, from +1.2% to +0.5%, shows weaker consumer demand, consistent with reports blaming this on recent tariff measures. These tariffs, particularly on imports, have interrupted trade flows and triggered preemptive import surges, further complicating the economy. This decline challenges the sustainability of consumer expenditure, a mainstay of U.S. economic growth in the past.
The rise of the Core PCE Price Index to 3.8% from 3.7% is a sign of still-prevailing inflationary pressures even as growth slowed down. It is a trend tending toward stagflation risks, with prices still going up even as growth stagnates. As was shown by one 2023 analysis, tariffs can intensify inflation if growth was slow because supply chain distortions with respect to trade policy contribute to costs. It adds credence to the concern that if inflationary pressures persist without a corresponding rise in economic activity, then the economy will go through a prolonged stagnation period.
In addition, a September 2021 National Bureau of Economic Research paper on trade policy effects estimates tariffs reduce GDP by 0.2-0.5% per year because they induce supply chain disruptions. These findings lend credence to the view that the newest tariffs may have been a contributing cause of last year’s shock downturn, and therefore the broader economic rebound may be delayed even further. Analysts must watch closely how these trade policies may permanently hurt the economy, particularly with inflation remaining high and growth sentiment still waning.
Increase in Durable Goods Orders and Tariff Impact
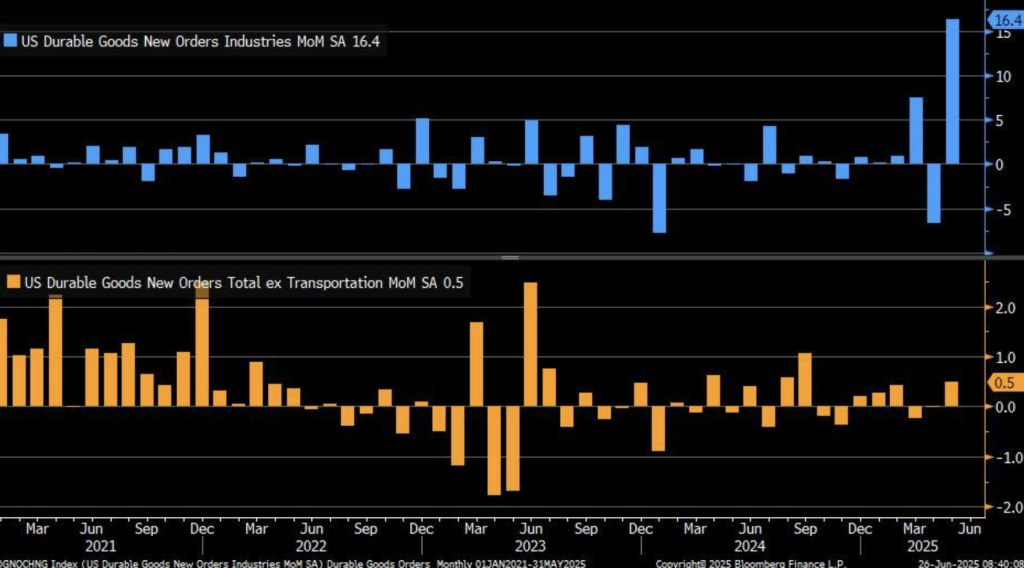
At Zaye Capital Markets, the 16.4% May 2025 rise in U.S. durable goods orders, driven by a 48.3% rise in transportation equipment—mostly aircraft—is stronger than anticipated and a sharp reversal from April’s revised 6.6% decline. It shows a volatile but potentially increasing manufacturing climate, with a significant shift in transportation equipment. Excluding transportation, however, the 0.5% rise in orders is softer business investment underlying, reflecting conservative spending in the current economic uncertainties. This is consistent with a 2024 Federal Reserve study, where it was discovered that orders of capital goods are highly correlated with business confidence, reflecting again a more conservative economic climate.
The recent spate of airplane orders, including Boeing’s 303 orders, including 150 last week alone by Qatar Airways during President Trump’s visit, hides the reality of across-the-board economic health. Unstable, high-priced deals like these are a tell that while numbers are good in the short term, they do not necessarily reflect sustainable growth. Relying so heavily on such huge contracts is a signal that the manufacturing industry may still remain vulnerable to trade policy and geopolitical volatilities, not to mention the uncertainty of U.S. tariff policies currently. Tariffs continue to have an impact on patterns of business investment, as reflected in the modest growth of non-transportation industries. Ongoing uncertainty regarding tariffs compels businesses to continue inhibiting expenditures, perhaps delaying or reducing investment. Inhibition of investment on firms also supports the contention that short-run gains would be obtained through targeted industries, yet economic growth would itself be weaker as well as highly susceptible to external economic impulses like trade policy and geopolitics. The trend is one of which analysts must remain sensitive as they monitor the long-run implications of tariffs on the broader economy.
Regional Manufacturing Resilience and Labor Market Strain
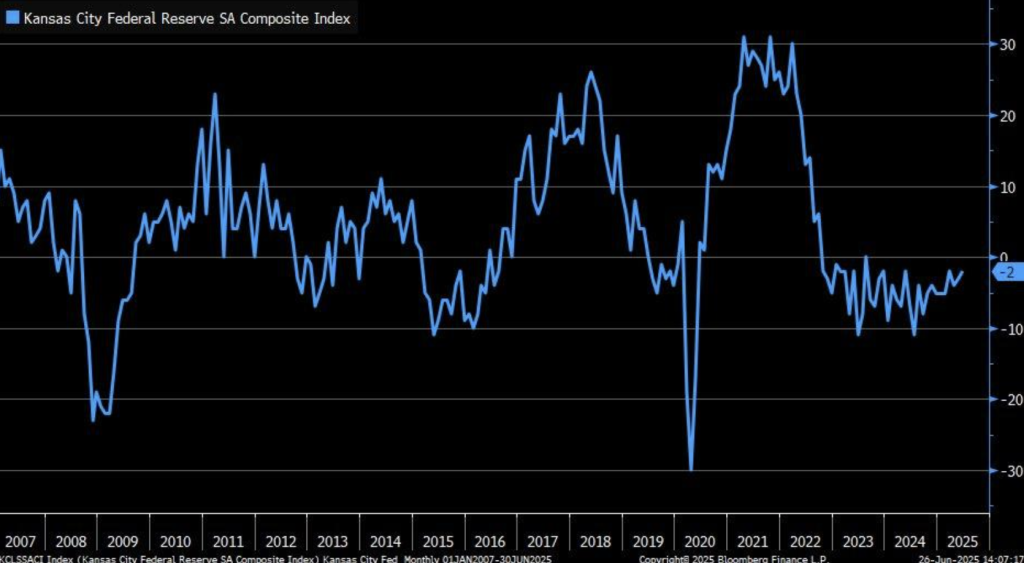
At Zaye Capital Markets, June 2025 Kansas City Fed Manufacturing Index improves slightly, increasing from -3 to -2, reflecting a certain regional manufacturing resilience against broader national weakness. This follows a decline of the general U.S. manufacturing sector last month, which declined to -10 as of May 2025, according to Trading Economics. This regional gain is a signal that certain areas of the nation are adapting well to existing economic realities, and it brings hope that certain sectors will prove stronger against national downturns.
The sharp increase in prices received (to +51 from +34) and production (to +5 from -10) reflects persistent inflationary pressures as well as signs of reviving output. This is buttressed by a 2024 Deloitte report, which had 78% of manufacturers with supply chain software investment plans with a goal of increased efficiency. This response plan reflects efforts of the sector to contain disruptions due to supply chain failures and increased costs. Manufacturers are turning their attention toward utilizing technology to increase efficiency and protect competitive edges even as they struggle with inflation and logistical shortfalls. But falling employment from +3 to -8 indicates heightened tension within the job market, a contrast with other global markets’ stable employment patterns. UK manufacturing output, for example, posted 0 year-over-year growth (+0.0%) over April 2025, indicative of increased stability. Regional differences reflect differences brought about by economic policy and regional markets across the globe. Scholars would do well to account for interregional differences when creating the broad picture of manufacturing trends because regional economic conditions and policy actions can dictate future trends within global manufacturing.
Upcoming Economic Events
Upcoming Events: Spanish Flash CPI y/y, Core PCE Price Index m/m, and Revised UoM Consumer Sentiment
As we approach a pivotal week of data releases, investors will eye a series of economic data with the potential to move markets and influence central bank policy. Coming on the heels of core inflation data and consumer sentiment reports, markets will be poised to move on any shock. Below is a rundown of what is expected and how markets will probably react to each release.
Spanish Flash CPI y/y
The Spanish Flash CPI y/y will be followed closely since it gives an indication of inflationary trends within the Eurozone’s fourth-largest economy.
- A stronger-than-expected actual reading could indicate rising inflationary pressures, which would prompt the European Central Bank (ECB) to take a more hawkish stance in the short term. This would lead to a rise in the euro as investors speculate about tighter monetary policy.
- A weaker-than-expected reading would indicate softer inflation dynamics, which would prompt the ECB to maintain its accommodative policy, and thus a weaker euro as markets speculate about a less hawkish policy stance.
Core PCE Price Index m/m
The Core PCE Price Index m/m is one of America’s main gauges of inflation and is also closely monitored by the Fed.
- A higher-than-forecast Core PCE print would confirm tighter inflation pressures, which would encourage the Fed to be even more hawkish in policy, with ongoing focus on further raising interest rates to combat inflation. On this view, bond yields would rise, equities would come under pressure, and the U.S. dollar would strengthen as markets anticipate tighter policy.
- Alternatively, if a lower-than-forecast print on the Core PCE convinces investors that inflation is topping, this would enable the Fed to tilt policy dovishly. That would see bond yields fall, risk assets like equities rise, and a weakening of the U.S. dollar as investors switch into growth-sensitive assets.
Revised Consumer Sentiment Survey
The University of Michigan Consumer Sentiment (Revised) reading will offer valuable information about consumer confidence across the U.S.
- A higher-than-anticipated reading would be an indication of a robust consumer base supporting expectations of continuance of strong spending and economic growth. That would be supportive of risk assets and cyclical stocks, driving them up.
- A weaker-than-anticipated reading, on the other hand, would be an indication of creeping concern over the economy, manifesting as a pullback in consumer expenditure, and even flight into bonds and defensive equity sectors. A fall in consumer sentiment would also evoke fear of slowing economic activity, and make the market risk-averse.
Whenever these major economic releases are due out, markets will be holding their breath in anticipation of surprise. Whether the figures are high or low, investors will be studying the impact on inflation, central bank reaction, and health of the economy. Each outcome has the power to shift sentiment and influence global trades.
Stock Market Performance
Markets Recover from Lows, yet High Level Weakness Continues
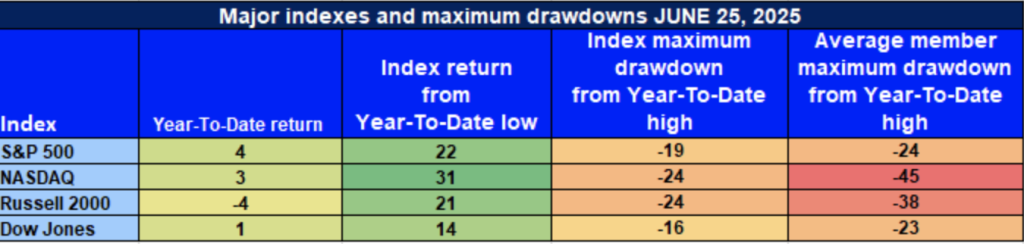
The U.S. equities have rebounded strongly from April lows, but the underlying market frailties still exhibit vulnerability. At first glance, the rally might look positive, but a closer look at the specifics indicates widespread underperformance in the major indexes. Despite strong rebounds, narrow leadership and absence of even participation in the market indicate investors should proceed with caution through the minefield landscape. Here’s where the major indexes currently sit:
S&P 500: Dispersion Drives Wide Gains
S&P 500: +4% YTD | +22% from 4/8/25 low | -19% below YTD high | Average member: -24%
The S&P 500 is at +4% year-to-date on the strength of a +22% rebound from its April 8 low. But the fact that it had a substantial -19% decline from its YTD high and a -24% average decline of its constituents shows that the rally has been spearheaded by a few stocks and lacks breadth of participation across the board. This one-sided action is indicative of the narrow leadership of the index and raises the red flag that the rally could not be sustained in the long term unless strength is broadened.
NASDAQ: Bouncing Back, But Membership Losses Continue
NASDAQ: +3% YTD | +31% from 4/8/25 low | -24% from YTD high | Avg. member: -45%
The NASDAQ is +3% YTD, led by a +31% rally off its low in April. However, despite index-level gains, a -24% decline from its YTD high and an agonizing -45% average member drawdown indicate that there is still pain in many of the growth and technology stocks. While the index is rebounding, it’s clear that much of the tech-heavy index is still lagging, and that could be a weakness in the overall technology sector.
The Russell 2000: Small-Cap Blues Persist Despite Rally
Russell 2000: -4% YTD | +21% off 4/8/25 low | -24% from YTD high | Avg. member: -38%
The Russell 2000, a small-cap proxy, is under pressure, down -4% YTD. Despite a +21% rebound from April bottoms, the smaller-cap universe is doing poorly. The -24% decline from YTD highs and a concerning -38% avg. member drawdown reveal that small-cap stocks have yet to reclaim losses and continue under pressure from markets.
Dow Jones: Defensive Shift Mitigates Losses
Dow Jones: +1% YTD | +14% from 4/8/25 low | -16% from YTD high | Avg. member: -23 The Dow Jones has posted a modest +1% YTD return, boosted by a +14% rebound from its April low. Following a -16% retracement of its YTD high, the Dow has seen the mildest correction of its peer group. That said, a -23% average member decline signals that even the cyclic and defensive members of the index have not escaped the broader market weaknesses.
The Strongest Sector in All of These Indices
Industrials Lead with Strong, Steady Momentum
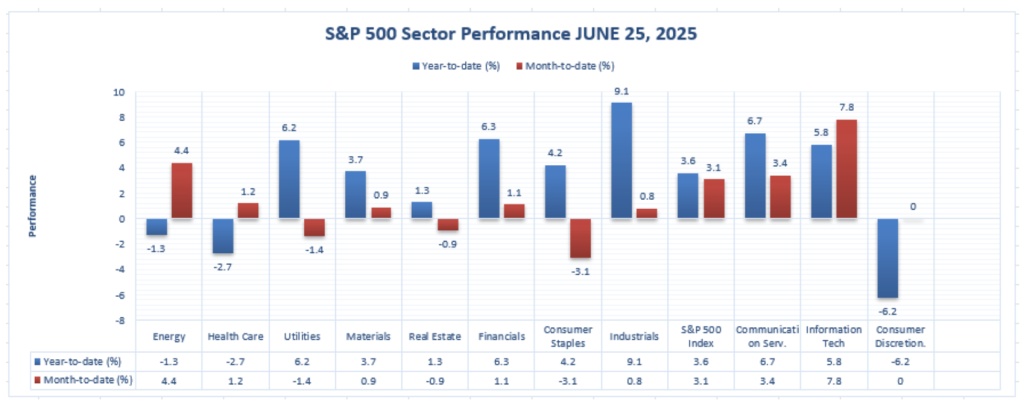
Of all 11 of the S&P 500 economic sectors, Industrials have been the obvious winner so far this year of 2025, with strength and resiliency on all time frames. Industrials have led the pack as of June 24, 2025, with strong year-to-date as well as month-to-date performance.
Industrials:
+9.2% YTD – highest year-to-date performance of any sector
+0.9% Month-to-date – following their June trend higher
What is distinctive about Industrials is not just their strong YTD performance but also their ability to maintain strong returns in the most recent month, showing that demand is continuing in economically sensitive companies. Industrials are distinct from other sectors in having had more risky performance, such as Energy with its spectacular +6.5% month-to-month increase or Information Technology with its +4.9% month-to-date performance, in that Industrials have shown steady, persistent strength on short and long-term timeframes.
This combined strength of strong long-run performance and stable short-run performance makes Industrials the strongest sector in the S&P 500 through mid-2025. Its steady upward trend is a reflection of solid demand in its key areas of manufacturing, transportation, and infrastructure and makes Industrials the best sector in which investors can look for stable and firm performance in the midst of ongoing uncertainty in markets.
Earnings
Earning recap: June 26, 2025
- Lindsay Corporation
Lindsay Corporation reported strong earnings, surpassing forecast at an EPS of $1.78, as compared to expected $1.36. Net revenue was $169.5 million, a 22% growth from last year. The strong performance was driven by a 60% rise in irrigation sales internationally as well as a 21% rise in infrastructure revenue. Lindsay raised its dividend by 2.8%, showing optimism about its growth prospects. The company performance shows tremendous demand for irrigation as well as infrastructure, pointing toward long-term strength within its core operations.
- Enerpac Tool Group Corp.
Earnings per share of $0.51 was posted by Enerpac Tool Group, topping projected $0.47 per share based on revenue of $159 million, a 5.5% increase year-over-year. Enerpac also reported an operating margin of 20% and an adjusted operating margin of 24.1%. Shareholders also received a return of about $14 million as their shares were bought back by Enerpac. Its performance was driven by strong industrial tools as well as demand for hydraulic solutions, though investors will have to watch out for the risk posed by ongoing tariff uncertainty as well as global trade patterns.
- Concentrix Corporation
Adjusted earnings were $2.70 a share, higher than the $2.58 forecast. Its $2.42 billion revenue rose 1.5% year over year, with operating income of $675 million. Concentrix lifted its revenue forecast for the year, anticipating 1% to 2% growth constant currency. The figures suggest stable demand for its customer experience business, despite a challenging worldwide environment, and show the resilience of the company in posting consistent results.
- National Beverage Corp.
National Beverage met forecasts with a $0.47 EPS and sales of $304.8 million. The year-over-year gain was slim, though, indicating a dip in demand for its products. The company’s steady performance indicates that it is maintaining itself within the industry, albeit with possibly a few kinks along the way.
June 27th 2025 Earnings Preview
- Apogee Enterprises, Inc.
- Apogee Enterprises is expected to report earnings per share of $0.50 and revenue of $326.08 million. Investors should monitor how well the company’s architectural products and services division is doing, especially high-performing coated products. Now that the company is focusing on commercial construction markets, any information on infrastructure demand and project schedules will be important parameters in judging growth opportunity in the coming period.
- Radius Recycling, Inc.
Radius will incur a loss per share of $0.87, on revenue of $725.3 million. Shareholders will need to watch how well Radius is able to maintain its gross margins, especially with the company aggressively pursuing recycling and green services. Its earnings stream will be determined by how successful its recycling initiatives will turn out and what shifts will occur in demand for sustainable material.
- Methode Electronics, Inc.
Methode Electronics must provide an update on its electric and hybrid vehicle applications performance, and any contribution from current changes in its operations. While the actual numbers in revenue and EPS at this point are not certain, investors need to pay attention to comments regarding demand for its automotive products and smart infrastructure solutions.
Any shift in demand by its customers or in product development in these segments will be the principal drivers for future growth of the company.
Stock Market Summary – Friday, June 27, 2025
Markets continue to grapple with a complex environment driven by recent economic statistics, geopolitical developments, and company profits. Investors balance the impact of easing inflation, potential Federal Reserve policy shifts, and the effect of ongoing trade tensions.
Stock Prices
Geopolitical Incidents and Economic Indicators
Recent economic reports indicate a moderation of prices as a decrease was registered by the Producer Price Index (PPI), so prices at a wholesale level can stabilize. This has raised speculation of a change of position of the Federal Reserve at its monetary policy stance in the near term.
Geopolitically, America and China have agreed on a reduction of tariffs by 90 days, regarded as a trade tension relieving and economic growth stimulating move. It has had a beneficial influence on sentiment within markets, leading to rallies of late.
The Magnificent Seven and the S&P 500
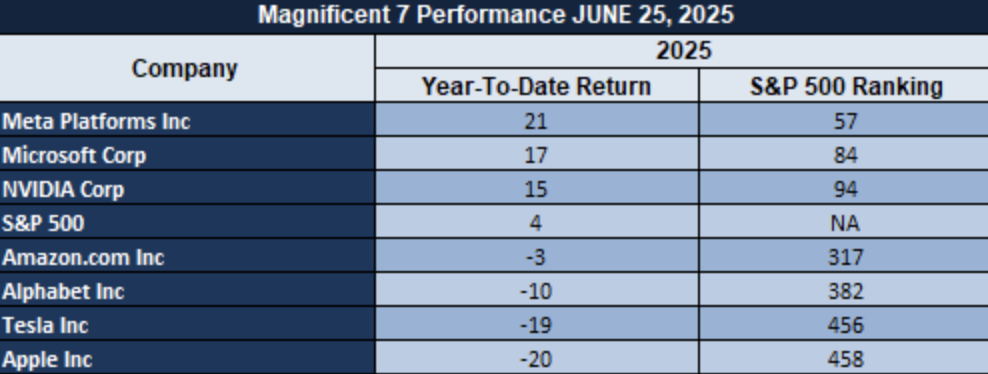
The S&P 500 has held steady, boosted by the good performance of big tech shares, which have come to be referred to as the “Magnificent Seven.” These include firms like Apple, Microsoft, and Nvidia, which have been bolstered by advances in AI and good earnings reports.
Even with these gains, wider market participation is uneven. Retail investor enthusiasm that fueled previous rallies appears to be losing steam, and analysts argue that without new investor interest, it will be challenging to maintain the uptrend.
AI IS MAKING ENERGY ACCESS A STRATEGIC PRIORITY
META’s ex-CTO indicates that AI’s expanding compute needs are forcing the big techs to make energy a core asset. This should positively impact the next-generation nuclear and grid stocks like $OKLO, $VRT, $EOSE, $BWXT, $SMR, $CEG, $NNE, $CCJ, and $LEU, as the energy infrastructure comes into spotlight.
$GOOGL WAYMO MILES AHEAD AS $UBER BUYS TIME
BMO AV expert says Waymo is “miles ahead” of others in autonomous vehicle (AV) tech. Uber is instead using partnerships to gain time until full autonomy technology can be developed. AV scaling will require massive investments in LiDAR, synthetic data, and purpose-built fleets—unknowns that will chart the course of the autonomous vehicle universe.
Major Index Performance as of June 27, 2025
- S&P 500: Closed at 5,916.93, a 0.3% increase for the day.
- Nasdaq Composite: Closed at 13,784.50, down 0.2%, putting an end to
- Dow Jones Industrial Average: Rose 0.7% to end at 38,650.00, its first gain in three days.
- Russell 2000: Closed at 2,092.10, with a modest gain, yet down 5.7
The days ahead will see market participants pay close attention to upcoming economic data and corporate earnings reports as a guide to the economy and potential policy response. The interplay between macroeconomic data and outside events will continue to dictate market direction on a day-to-day basis.
Gold Price Analysis – Friday, June 27, 2025
At recent numbers, gold is sitting at approximately $3,322 an ounce, a moderate 0.13% daily increase. After a series of losses, this may mark a turning point of a sort for the precious metal. Gold’s price remains highly responsive to economic data and geopolitics, so it is a key asset to watch as worldwide tension builds and economic conditions continue to fluctuate.
Gold pricing is influenced by a combination of factors, with recent remarks by President Trump injecting volatility into the market. His recent revelation of a U.S.-China agreement on the sale of rare earth is seen as an attempt at cooling down trade tensions, something which is sure to impact global supply chains, particularly for strategic minerals. This would be among the factors driving inflationary pressures, hence supporting gold as a safe-haven asset. Similarly, Trump’s insistence on military action against Iran, even in the face of modest gains, underscores ongoing geopolitical risk. Such tensions serve to drive investors into gold, which provides security amidst uncertainty. In addition to geopolitical factors, upcoming economic releases will also have a hand in setting the price of gold. Key markers like the Spanish Flash CPI y/y and Core PCE Price Index m/m are watched closely for indications that inflationary pressures are building, which favors the price of gold. Increased inflation readings higher than expectations would see gold soar even more as investors seek to hedge against increased prices. A softer-than-expected inflation read would spoil the appeal of gold, perhaps inducing a pullback as expectations of future rate hikes are advanced. In the meantime, the Revised UoM Consumer Sentiment report will also have news of consumer confidence, which can affect expectations of future economic growth. Good sentiment would suppress demand for gold, with investors potentially rotating into risk-on assets like equities.
In short, while gold has stabilized at current levels, its price remains extremely sensitive to both economic news and geopolitical developments. Investors will be following these closely, as they can potentially have a large impact on the direction of the precious metal near term.
Oil Prices – Friday, June 27, 2025
As of the latest data, oil prices have been highly volatile this week. The Brent crude is currently at about $68.07 a barrel, while U.S. West Texas Intermediate (WTI) crude is currently at $65.57 a barrel. The cause of these fluctuations is a combination of geopolitical tensions, economic data, and market expectations.
Recent comments by President Trump have also added complexity to the oil market. His revelation of a deal between the U.S. and China for rare earth export is seen as a step by him to ease trade tensions, which would affect global supply chains, particularly in terms of critical minerals. The event would contribute towards inflationary pressures, thereby supporting oil prices as investors shift into hedging assets as prices increase. Trump’s explanation of a military strike against Iran, even though allegedly of limited success, also reflects underpinning geopolitical risk. The tensions would shift investors into oil, seeking stability in uncertain times.
Bitcoin Prices – Friday, June 27, 2025
The Bitcoin price has risen to approximately $31,250, following a temporary spike within a 24-hour period. This has come about as a result of positive developments within the cryptocurrency sector, specifically with regards to increased adoption at an institutional level. High-profiling publicity of support from Jack Dorsey of decentralized Bitcoin mining efforts and Cantor Fitzgerald launching a $1 billion Bitcoin-collateralized lending vehicle have all presented a bullish argument for Bitcoin’s prospects. Nevertheless, ongoing geopolitical uncertainty and volatility within markets remain lingering drivers of Bitcoin prices with a penchant for short-term volatility. Trump’s last statements, especially with regards to Chinese-American agreements on exporting rare earths, have brought a degree of uncertainty into international markets, indirectly buffeting Bitcoin. Political risk and trade risk usually prompt demand for alternative assets like Bitcoin as investors hedge against economic uncertainty or currency devaluation. Trump’s explanation of incursions into the Middle East and his tirades against mainstream media also add an element of uncertainty on markets, persuading investors into Bitcoin as a hedge against traditional financial systems.
Yesterday’s economic releases consisted of slower-than-forecast U.S. GDP growth and high jobless claims, a sign of a broader slowing economy. This has worked in Bitcoin’s favor as an alternative store of value when traditional assets like equities and bonds underperform. Today’s releases of the Core PCE Price Index and Revised UoM Consumer Sentiment will help tell if inflation pressures persist. Should inflation remain high, Bitcoin can continue to gain as an inflation hedge with added buying demand. But weaker-than-forecast data deters investors, temporarily suppressing Bitcoin prices. In short, Bitcoin’s price action is being driven by a combination of macroeconomic factors and institutional adoption. With geopolitical risk and inflation concerns supporting demand, Bitcoin’s volatility remains elevated, and economic trends and policy announcements must be closely followed in order to anticipate future price action.
ETH Prices – Friday, June 27, 2025
The price of Ethereum (ETH) is now at about $2,446.23, a bit lower from last closing by 1.63%. Despite the dip, Ethereum has been moving within a tight price range, a sign of a still-transitional market. The ongoing tale of institution and whale investment is a driving force driving Ethereum’s movement, with its long-term worth remaining anchored on healthy market fundamentals.
Institutional demand is also visible, with players such as Bit Digital raising $150 million during a public offering, with a large amount of it dedicated toward buying Ethereum. The move is a strategic one toward building crypto treasuries. Ethereum whales aren’t idle either, with one of them purchasing nearly $39 million worth of ETH amidst these price movements, showing faith in Ethereum’s direction. Such whale movement and institutional demand signal Ethereum continues to attract long-term investors even with short-term price fluctuations. The anticipation of Ethereum ETFs, particularly the probable approval of staking in them, signals another level of faith because approval of such staking in them is expected to fuel even greater institutional participation within the Ethereum ecosystem.
