Where Are Markets Today?
European and US futures started the week on a positive note, with EUROSTOXX 50 and DAX up by approximately 0.2–0.3%, and FTSE futures higher by approximately 0.2%. On the other side of the globe, Dow Jones futures rose nominally by 0.13%, while S&P 500 and Nasdaq 100 futures rose 0.14% and 0.21% respectively. The trend continues from last week’s pace when Wall Street posted its second weekly gain and small-cap stocks rallied on hopes of easy monetary policy.
The rate cut expectations continue to be in the driving seat as the prime mover. The investors are more confident the Federal Reserve will cut rates by 25 basis points, and markets are assigning an 85% chance of the same to occur prior to Jackson Hole. Easing policy signals have propagated the cyclical and growth stage, and given a helping hand to small-caps, most vulnerable to borrowing charges. While Treasury Secretary Bessent has been advocating for more severe cuts, the futures markets have been calm, and faith in gradual but supportive easing cycle has been preserved.
Geopolitics has also provided reassurance. President Trump’s Summit with President Putin in Alaska was movement toward Ukrainian peace talks, and concerns about sanctions that would disrupt energy supply eased. Oil prices, having spiked momentarily last week, eased later as traders built in safer Russian supply. This more stabilised backdrop has seen investors gain more confidence to revisit risk assets, underpinning the modestly tighter tone in global equity futures. The pace of earnings is also one big pillar of support. Approximately 60% of S&P 500 issues reported improved EPS, buoying the index to record highs. In Europe, long-maturity bond yields, led by issuance and defence spending, are still a counterweight, however. Markets now look ahead to the Jackson Hole conclave and new European trade data for clues. Any Fed hawkish lean or validation of European demand frailty would once again temper optimism, but, for now, futures are reading cautious strength on the open of the week.
Major Index Performance as of Monday, August 18, 2025
- S&P 500: Trading at 5,860.12, down 0.2% on the day.
- Nasdaq Composite: Currently at 18,350.44, down 0.4%, pressured by tech weakness.
- Dow Jones Industrial Average: Up 0.3% to 41,240.56, supported by financials and energy.
- Russell 2000: Trading at 2,162.88, underperforming due to small-cap caution.
The Magnificent Seven and the S&P 500
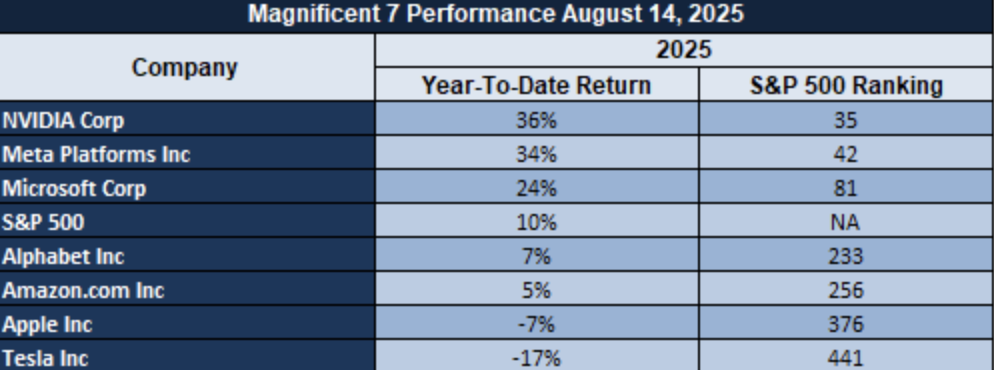
The “Magnificent Seven” of Apple, Microsoft, Nvidia, Amazon, Meta, Alphabet, and Tesla are withdrawing after prolonged runs. Shares collectively trade more than 16% below recent highs, with sell-offs led by Meta and Tesla. The correction is normalizing valuations in hotspots of AI-driven expansion. Support is muted at best from energy and industrials, and the S&P 500 has little room on the upswing until mega-cap leadership finds its groove.
Drivers Behind The Market Move
Global US and European shares are sustaining their positive sentiment today, boosted on cocktail of optimism regarding monetary policy, geopolitics, and expectation ahead of pivotal central bank cues. Futures are higher ahead of what promises to be deciding week, led by forthcoming Jackson Hole Symposium and fast approaching chain of speeches and home sales figures, and recent developments having surreptitiously driven sentiment in direction of the risky ones.
1. Jackson Hole Outlook Anchored Monetary Policy Optimism
Markets are rallying on the palpable expectation that Federal Reserve Chair Jerome Powell will reinforce dovish cues at the Jackson Hole Economic Policy Symposium, beginning this Thursday. With an approximately 85% probability of a rate cut priced in, investors are positioning around anticipated easing. Adding fuel to this is the pending release of the July FOMC minutes and remarks from other Fed officials, which are expected to shed light on internal consensus regarding inflation, employment, and tapering policy. The street is clearly aligning around the idea that key central bankers may signal a readiness to support growth.
2. Geopolitical Stability Post-Trump–Putin Summit and Ukraine Diplomacy
Sentiment among investors has been strengthened further through the alleviation of geopolitical risks. Donald Trump’s summit with Putin in Alaska and Ukrainian President Zelensky and European leaders’ trip to the White House today mark a switch from crisis to dialogue. Oil prices were held in check through disappearing hopes of new sanctions on America, calming inflation concerns and paving the way towards general optimism across markets. This thaw on the diplomatic front has been instrumental in calming risk sentiment on shares.
3. Company Earnings Momentum and Structural Fundamentals
Guiding the market’s upswings are-strong company quarterly earnings reports, led by European large-cap stocks, lifted on the back of positive Q2 reports that are creating forecasts of economic resilience. In Germany, the DAX is rising above records in the wake of subdued inflation reports, dovish rate projections, and enduring earning resilience. Defense sectors like energy are, in turn, helped by lower volatile geopolitical themes, while cyclic and growth-related issuers bask on the twin advantages of falling rates and accelerating pent-up consumer demand.
Digesting Economic Data
THE TRUMP TWEETS AND THEIR IMPLICATIONS
The markets are always reactive to geopolitical signals, but President Trump’s recent series of comments has escalated the process, causing volatility in equities, commodities, and currencies. His constant commentary on new steel tariffs and on chip tariffs, initiated at diminished initial rates, consist of balancing domestic support for industry and international supply line forces. Although staged on the surface of being gradual, such actions still include the possibility of Chinese or EU counter-retaliation, reopening the period of trade friction. Towards markets, they signal higher input costs in tech and manufacturing companies, potentially restraining company EPS estimates while also supporting defensive actions like utilities and gold. The commentary also spawns an overarching “risk-off” mindset, where investors allocate monies within safe-haven units every time trade friction arises.
On the diplomatic side, Trump’s summit with President Putin in Alaska generated enormous investor interest. His demand that they must make progress toward Ukrainian ceasefire, and implied suggestions of general peace agreements, shaved momentarily the risk premium ingrained in oil prices. That translated into recent weakness in Brent and WTI, with markets repricing against the odds of stable Russian supplies. His threats of “severe consequences\” should the talks fail, though, served to reinforce such fragility. In short, energy traders are being forced into a binary universe where diplomatic breakthroughs undermine spot prices and breakdowns rapidly reinstate supply shocks on the agenda. This geopolitical game of tug-of-war continues being highly volatile on the oil flank and vindicates the safe-haven status of gold, where investors are hedging against dramatic reversal outcomes. Trump’s economic commentary also influenced market sentiment. In going on record about CPI at 1.9% since inauguration and saying “plenty of disinflation in pipeline,” he put US inflation in check, more or less defying hot-pursuit Fed action expectations. His narrative is behind dollar stability, especially since he matched US strength against China’s and Russia’s weaker-looking economic outlook. It is commentary that is not just political sound bites but market pronouncements: healthy US economy means higher-for-longer interest rates, and discovery of foreign weakness underlies concerns of ebbing global demand. For risky assets, they are a double-headed sword—favoring dollar-based holdings near term but injecting doubts of slower cross-border growth that can be detrimental to multinationals.
Aside from geopolitics and economics, Trump’s claims of leadership prerogative also have structural effects. From offering guarantees of safety directly to Ukraine to ensuring Xi does not storm Taiwan on his watch, his words have transformed political commentary into forward guides to markets. Investors increasingly are treating Trump’s words as binding signals, and not as mere speculative noise. It makes financial markets more responsive, so that presidential rhetoric becomes triggers on the same order as releases or economics news. In practice, that means tighter intraday ranges, so that dealers rebalance portfolios within minutes of his words. The broader implication is self-evident: Trump’s unpredictability is now embedded within global markets as a permanent risk factor, so that political headlines are as effective as monetary policy in influencing near-term investor sentiment.
U.S Inflation Expectations Spike In August 2025: A Signal For Concern
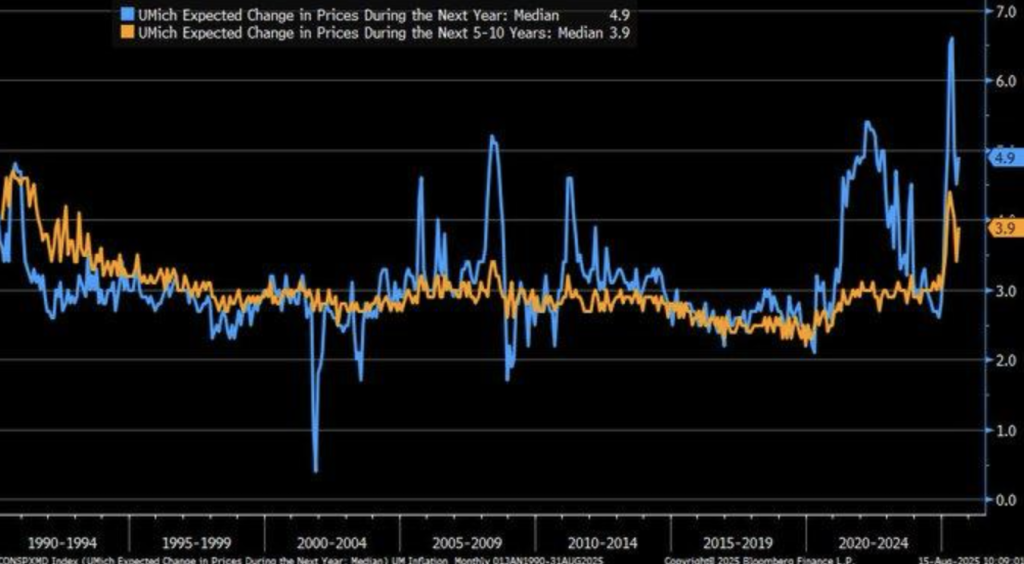
American inflation expectations rose sharply, as the August 2025 survey conducted by the University of Michigan revealed. Inflation expectations for a year rose to 4.9%, and inflation expectations over a five-to-ten-year horizon rose to 3.9%. It is a dramatic reversal from earlier data, where inflation expectations were tepid at 2.8% in 2024. It is a sign of rising consumer concerns, as the consumer sentiment index plummeted to 58.6, from 61.7 in the preceding month. Analysts must be very alert, as inflationary pressures could spike very sharply, if these expectations become a reality.
This inflation expectation spike is in tandem with a big jump in the Producer Price Index (PPI), 0.9% in July 2025, the largest in a month within three years. Improvements in the PPI mainly reflected higher tariffs and more elevated service fees. These inflation indications pose the threat of mounting input costs, consequently, putting pressure on companies’ margins within sensitive sectors such as consumer goods and services. To this end, the periodic fluctuations in inflation indicators and consumer sentiment should be handled with caution by market watchers.
With the current state of the economy, the utility stocks like Xcel Energy could be undervalued. In the presence of the probable inflationary danger against the operating cost, utilities are generally an inflation pressure hedge. Analysts would need to closely monitor areas of fluctuating consumer sentiment and inflationary patterns, as they are most likely going to shape the Federal Reserve’s future moves and have an influence in interest-sensitive companies.
Consumer Sentiment Plunges In August 2025: Inflation Fears Persist
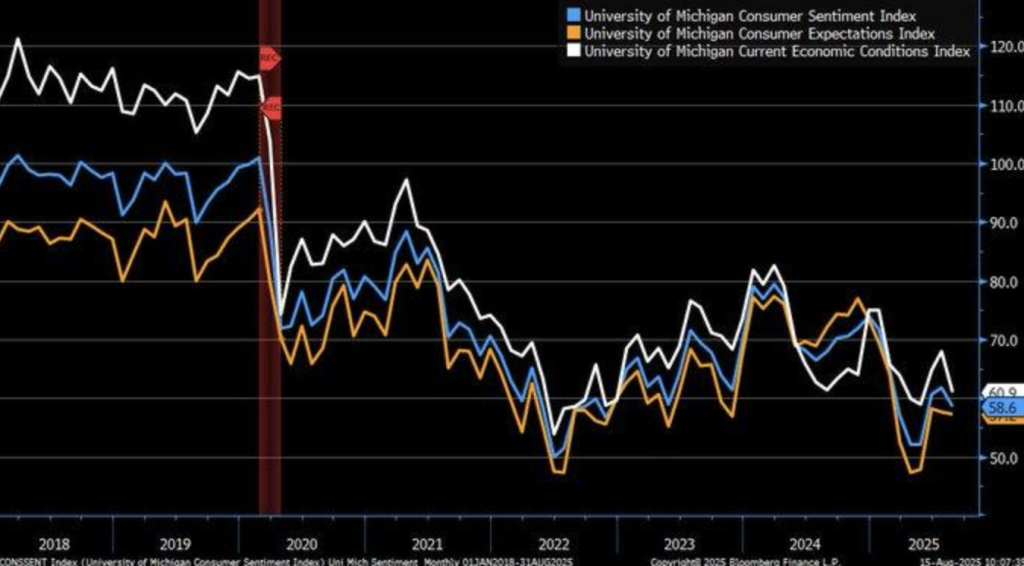
US consumer sentiment declined in August 2025 led by the University of Michigan’s Consumer Sentiment Index 5% lower at 58.6. That is a decent decline, in a sign of rising consumer anxiety about inflation. The report in the Surveys of Consumers is of a 14% decline in durable goods purchase conditions, its bottom in a year. Sentiment decline is a note that inflation pressure is making a solid contribution to consumer spend decisions, although there are a couple of encouraging trends at the personal income outlook level.
The weakening consumer sentiment is also fueled by residual impacts of President Trump’s April 2025 tariff threat, which led sentiment down 32% since January in the steepest drop since the recession in 1990. Wall Street recovered positively in the guise of rallies, but consumer sentiment changes suggest that the consumer is more responsive to trade policy moves than traders. The disconnect foreshadows bumpier days in consumer spending in the future, as homes remain responsive to economic uncertainty.
In this context, consumer staples stocks, e.g., those of Procter & Gamble, can be classified as undervalued, offering investors a chance at a piece of the strength amidst turbulence. Such stocks tend to record stable demand even in the face of economic turbulence. Analysts must monitor the gap between consumer demand and inflation expectations, which will hold the key to determining future retail performance, as well as general market behavior.
U.S. Industrial Production Falls In July 2025: Signaling Manufacturing Slowdown
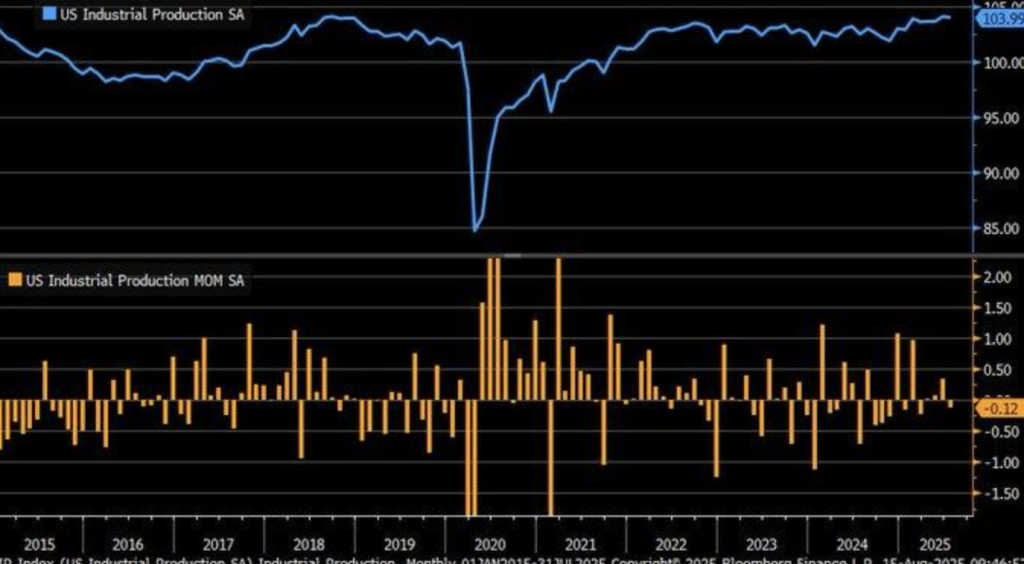
U.S. factory production fell 0.1% in July 2025, short of the 0% anticipated growth. Following the revised 0.4% increase in June, the decline could be an early indicator of factory activity tapering. While the industry fell, the health of the economy is still mixed, as the July reading for the Consumer Price Index, or CPI, indicated a modest 0.2% increase in inflation. That indicates that, although factory production is, in fact, flattening, the near-term risk of widespread inflation based on manufacturing slow-downs is muted, contradicting current projections of tariff-related price effects.
This declining industrial production is in contrast to the trend in the rest of the economy. Despite the occasional inflation fear from the most recent policies for President Trump’s tariffs, the small CPI increase indicates inflationary pressure is not yet at the level expected. History bears this out in that the measure of industrial production is a commonleading indicator of the health of the labor market. In the 2023 study published by the National Bureau of Economic Research, a 0.3% fall in production is a common precursor to the following 0.5% fall in employment, causing fear of a softening labor market if the trend is maintained.
Against such forces, industrial stocks, such as Caterpillar Inc., may be considered undervalued, providing a potential bonus as investors reevaluate the sector’s prospects in front of manufacturing headwinds. Analysts need to factor the connection between the trend in industrial production and labor market data, with a continued slowdown in production potentially being a sign of tighter conditions in the labor market overall, something highly important to consumer sentiment and aggregate GDP growth.
Federal Reserve Rate Cut Expectations Ease After Strong Retail Sales In August 2025
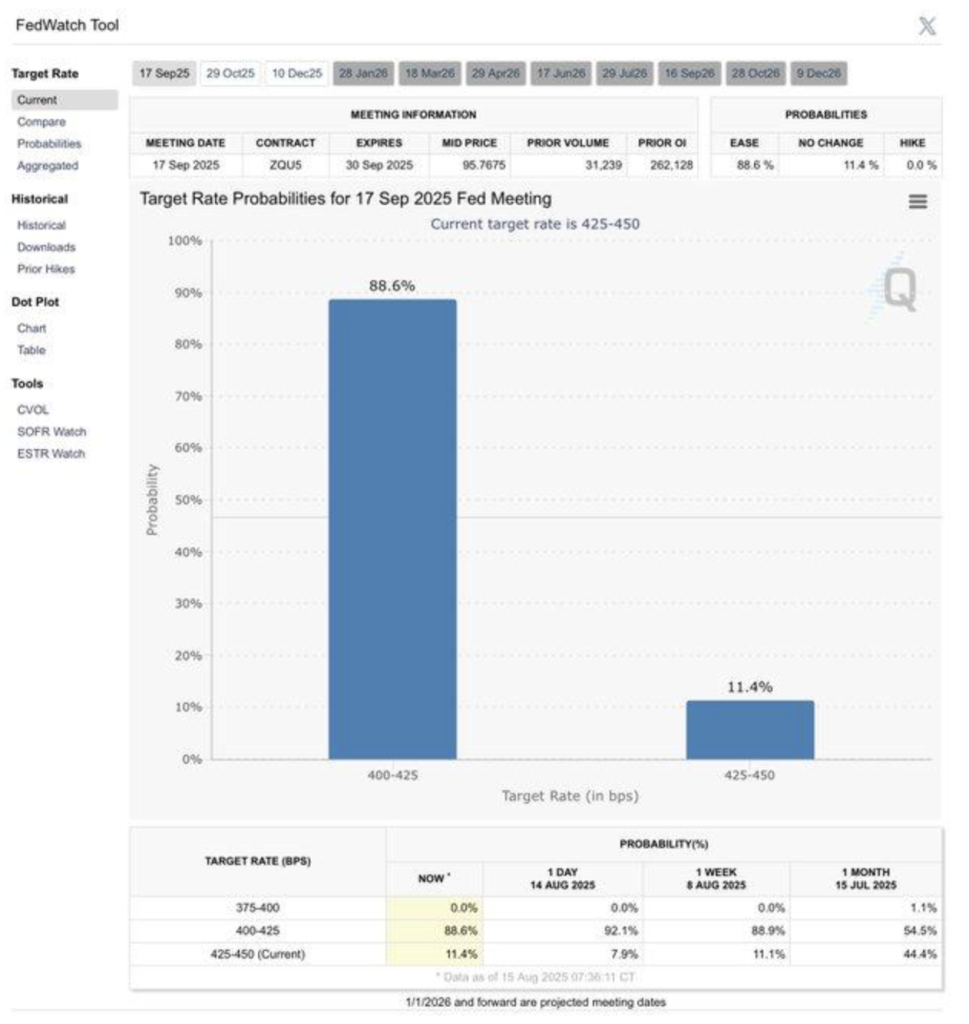
The chances of a 25-basis-point Federal Reserve cut in September 2025 have fallen from 92% to 88% following stronger-than-forecasted retail sales figures. The cut, tracked by the CME Group’s measure of sentiment in the form of its FedWatch tool, is an indication that the prospects for the economy are not as grim as anticipated, which means monetary relaxation is not as imperative. Retail sales are still a larger player in the form of rate policy, a reflection of present, real activity in the economy, and continue a key driver of rate activity.
This expectation adjustment fits with the larger story in the economy, such as the Goldman Sachs July 2025 call for three 25-basis-point reductions in the second half of 2025. Those calls were moderated, however, by the countervailing impact of the latest tariffs hikes and still-existing labor softness. It is a trend developing where markets are re-estimating in the face of shifting data, not tying the year-ago estimate. It is the looseness of monetary policy and the reactive stance of the Fed in reacting to a variety of measures in the economy.
With the prospects for rate cuts altered, consumer discretionary stocks such as, for instance, Home Depot could be cheap in this context. Strength in retail sales is a sign that consumer spending could be robust and supporting retailers. Analysts would need to exercise caution to watch retail sales, as well as the rest of the economy, since they give valuable signals regarding the trajectory of Fed policy that is vital to the broader framework of interest rate-sensitive sectors such as housing and retail.
U.S. Import And Export Price Trends Mirror Complex World Trade Dynamics
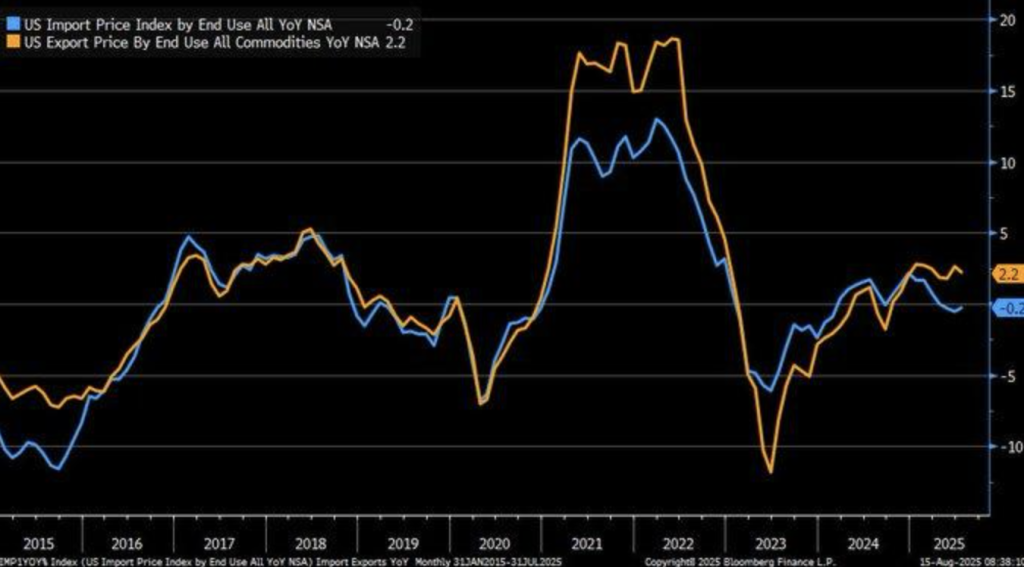
The U.S. Import Price Index declined 0.2% year-over-year in July 2025, while the Export Price Index rose 2.2%. That suggests a complex interaction of international trade forces, possibly influenced by tariff policy, including that put into place in 2024, which raised import prices by an average of 7.5%, according to the U.S. Bureau of Labor Statistics. The data point out that tariffs aren’t the sole determinant of import prices since other determinants, like world commodity prices and exchange rate changes, have similarly big impacts.
Historical analysis, such as a 2021 National Bureau of Economic Research study, has attributed export price increases to currency appreciation and commodity price spikes. This partially explains the increase in the Export Price Index amid the softening trend for imports. The data contradicts the premise that tariffs exclusively contribute to increased costs for U.S. consumers since exporters appear to take on a portion of the burden, possibly modifying their pricing strategy instead of completely transferring higher costs to purchasers.
Commodity-based equities, i.e., ExxonMobil, may be undervalued based on these trends in trade. That export prices are rising suggests commodities, i.e., energy, are finding price support despite decelerating import trends. Changes in exporters’ pricing policies and any geopolitical threats to global supply chains must be watched by analysts. Those will chart the direction of both import and export prices, with broader implications for inflation and trade balance.
U.S. Continuing Jobless Claims Signal Softening Labor Market, But No Recession Yet
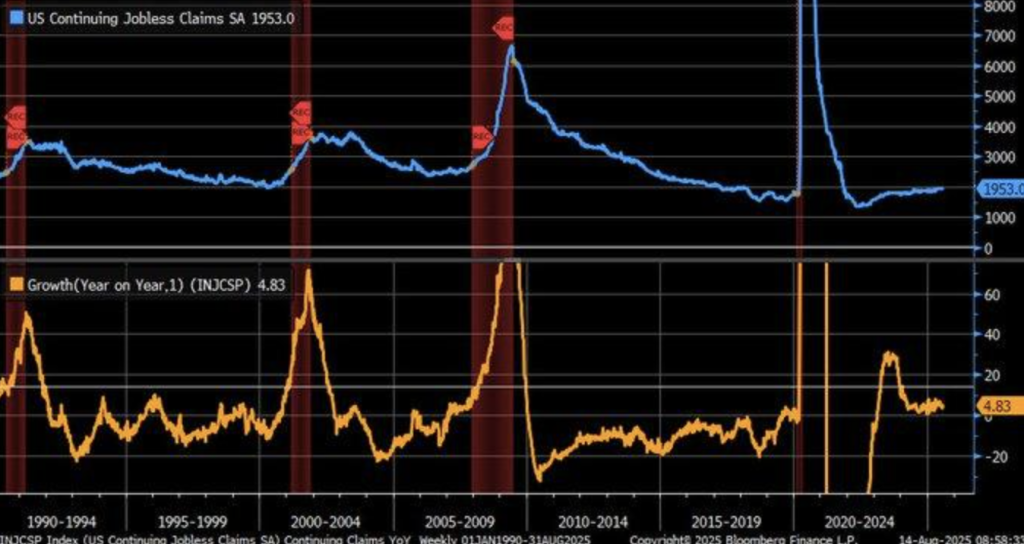
Additional U.S. unemployed claims for August 2025 totaled 1,953,000, a 4.8% year-year increase. It is a reflection of a softening labor market, but still relatively low of the recessionary peaks of past downturns, like the 2008-2009 financial crisis, when the housing bubble had popped and the claims had exceeded 6 million. The numbers indicate a very slight cooldown in the labor environment, but not the beginning of a big recession yet.
Such a conclusion is also confirmed by historical data from the Federal Reserve Bank of St. Louis (FRED), which shows that ongoing claims historically increase steeply during economic downturns. The benchmark for much greater claim levels is the 2008 subprime mortgage default-fueled financial crisis. While the uptick in claims is undoubtedly something to watch, it is not yet a harbinger of an imminent economic disaster, especially as the labor market has so far held up in the latest months.
Given the current macroeconomic environment, labor-centric stocks, such as Home Depot, might be undervalued. Even though the higher jobless claims are a pointer towards labor market challenges, the impacts so far have been relatively less severe than in the previous recessions. Jobless claims statistics must be monitored very closely in the coming weeks for further softening, as such a pattern could impact consumer sentiment and buying behavior, especially in labor-based segments.
Stagflation Fears Rise As Economic Concerns Mount In August 2025
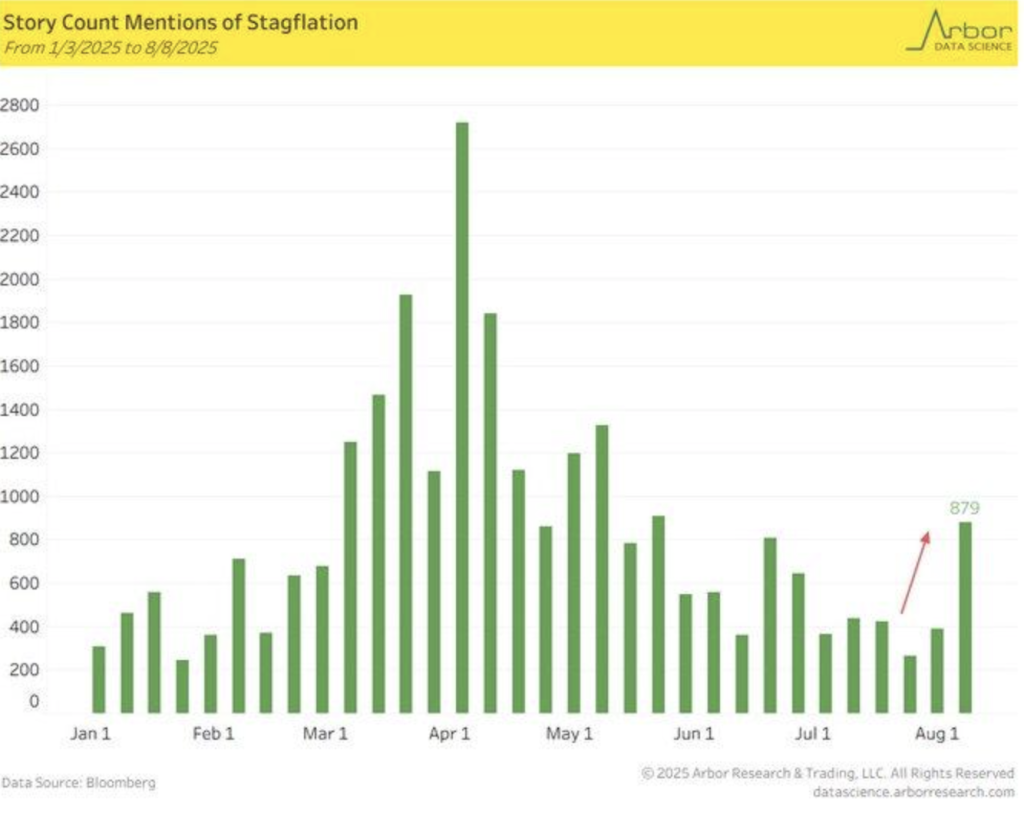
The term stagflation was a buzzword in economics, with news pieces quoting the term skyrocketing between February through August of 2025, with the most dramatic peak in the first half of August. The increase in media reporting is consistent with increasing fears of rising inflation, slowing growth, and potential labor market vulnerability. However, the U.S. July 2025 job report, with the slowdown in the economy, is in contrast to the strong 3% growth in the Q2 2025 report, undermining the strong economic recovery narrative and further heightening the specter of stagflation.
A 2021 paper on the UK supply shock, associating higher oil prices with stagflationary settings, is similar to the driving forces behind rising concerns. Both the simultaneous global-wide energy supply issues and the persistent inflationary dynamics can have the potential to make growth stagnate and increase unemployment. Old parallels, specifically the 1970s oil shock, demonstrate the pattern of press coverage towards stagflation occurring just before central bank policy actions. It could be an implication of policymakers potentially taking actions in the near term in a bid to compensate for supply-side shocks to the large economy.
Facing such dynamics, stocks in the energy sector, for example, Chevron, may become undervalued. Rising stagflation fears, usually associated with the volatility of oil prices, can be a boon for the energy business in rising commodity costs. Inflation, the price of energy, and labor market developments are areas where experts must be vigilant since they will be the determinants of future moves in the central banks, impacting the overall markets and the performance of the sectors.
Upcoming Economic Events
Traders enter the new week in search of a new batch of economic data, which may provide essential clues about the strength of the economy. Light is the schedule today, however, the days ahead are the stage for major indicators that will guide the direction of the market. Investors, of course, will be seeking clues about inflation patterns, consumer sentiment, and the manufacturing foundation, all of which can potentially play a starring role in determining the direction of the Federal Reserve’s next steps. Listen up, then, because the reports issued this week may hold the key to new possibilities in the markets.
Stock Market Performance
Indexes Move Past April Lows, though Breadth Remains a Concern
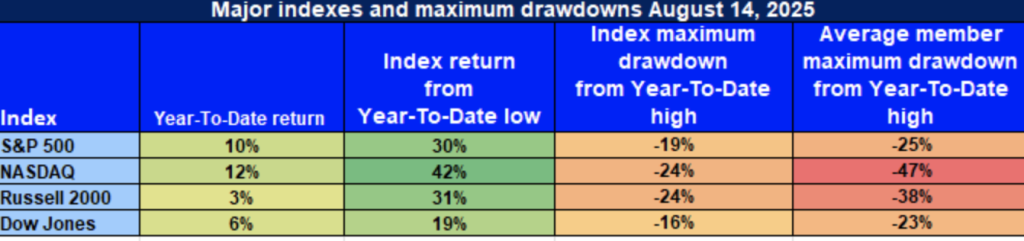
US stocks remain positive, directly out of the bottom created on April 8, but below, breadth is still an area of softness. Even though year-to-date large-cap indices have strong performance, the sporadic participation throughout the board and stocks is a weakness sign. Cautioned optimism is the best position in navigating the rocky ground, according to Zaye Capital Markets, where selectivity and quality are the key buzzword.
This is our present split based on the most current statistics:
S&P 500: Headlining the Index, yet Participation is Shallow
YTD: Up 10% | 30% discount April bottom | Down 19% from YTD peak | Avg. member: Down 25%
The S&P 500 index itself has been solid, advancing 10% year-to-date and 30% from the April lows. But beneath the radar screen, the typical member is down 25% from peaks, signaling leadership remains narrow in a concentrated group of names. This uneven participation is a negative in that the broad market remains unable to sustain consistent momentum.
NASDAQ: Tech Bounces Back, But Soft Below
YTD: +12% | +42% from April low point | -24% from YTD peak | Avg. member: down 47%
NASDAQ has rallied 42% since April, which is robust, but at its heart, there remains stress. Despite a 12% YTD gain, a 24% correction off the year-to-date high, and a 47% average member drop, this shows that the tech-heavy index remains sensitive, and the advance is narrow and concentrated among a select few. This is a reflection of the sensitivity of the sector, and we are continuing to be selective in the space.
📊 Russell 2000: Small-Cap Strength, But Confidence Still Lacking
YTD: +3% | +31% below April low | -24% below YTD high | Avg. member: -38% The Russell 2000 recorded a strong 31% gain from the April trough, but 3% YTD result and 38% average loss of members suggest indecisiveness on the whole. Liquidity concerns and macroeconomic sensitivities are a damper in the small-cap universe, hence a more selective strategy in the area with respect to trading.
🏛 Dow Jones: Stability with Defensive Lean, But Not Immune
YTD: +6% | +19% since April low | – 16% since YTD high | Avg. member: – 23%. The more stable of the two gauges has been the Dow, which is up 6% YTD and 19% from April lows. Its defensive positioning helped it out, and although the average member dropped 23%, even value-based segments are not exempt from larger market forces. We at Zaye Capital Markets remain committed to quality, defensively positioned stocks with solid fundamentals. Selectivity and risk management remain of prime importance at this stage in navigating the current climate.
The Strongest Sector In All These Indices
Communication Services & Information Technology Maintain Their Lead
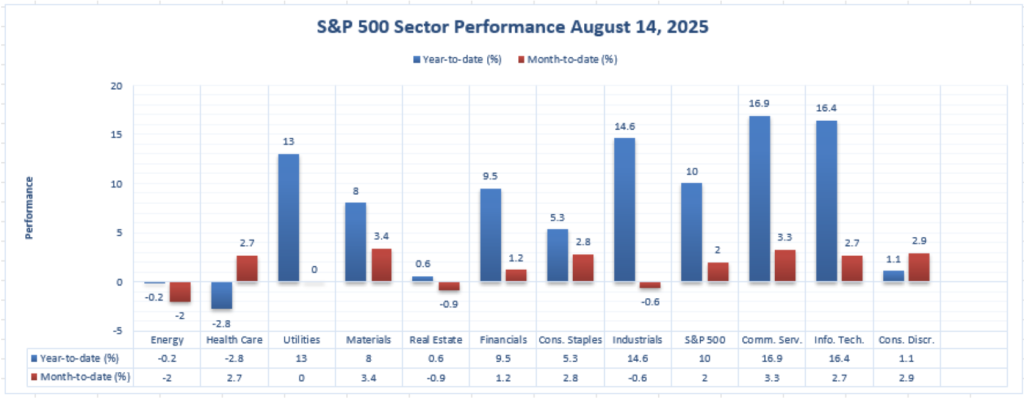
Up to August 14, 2025, the top-performing S&P 500 groups continue to be led by Communication Services and IT and continue ahead of the broad market year-to-date and month-to-date.
Communication Services
Year-to-Date: 16.9%
Month-to-Date: 3.3%
Communication Services remains the highest-performing S&P 500 sector. YTD, it’s returned 16.9% and has been one of the main drivers of the performance of the market. Even in the short term, it’s been incredibly strong, returning 3.3% month to date. Being able to hold its ground in the short term is a sound indicator of good growth, mainly in sectors like digital media, internet services, and telecoms. Owing to the need from the end-user for connective services and entertainment, the sector remains at the top of the list.
Information Technology
Year-to-Date: 16.4%
Month-to-Date: 2.7%
Information Technology is not lagging far behind, up 16.4% year to date. For the month so far in August, the sector has performed well as well, up 2.7% month to date. Information Technology strength is an expression of the ongoing demand for innovation, particularly in cloud, AI, and semiconductors. Sector strength on longer time frames implies the sector will keep propelling the market higher because adoption of technology is a secular growth theme.
🏭 Industrials
Year-to-Date: 14.6%
Month-to-Date: -0.6%
Industrials is still a top-three YTD performer, returning 14.6%. Industrials, though, experienced a very small August pullback, declining -0.6% month-to-date. Despite this very short pullback, Industrials continue to be a key part of the narrative of the economic recovery, benefiting from leadership in transportation, manufacturing, and infrastructure. In Zaye Capital Markets, we remain closely focused on the top-performing sectors, since they continue playing a vital role in the overall market performance, especially amidst changes in macroeconomic indices and rate expectations.
Earnings
Earnings for August 15, 2025: Key Updates and Insights
- Dillard’s, Inc. (NYSE: DDS)
Dillard’s reported better-than-expected earnings for the quarter, with an EPS of $4.66, significantly surpassing the consensus estimate of $3.79. Revenue came in at $1.514 billion, exceeding expectations. Despite a slight decline in net income compared to the previous year, Dillard’s saw a 1% increase in total retail sales, driven by strong performance in apparel and cosmetics. Investors are focusing on future consumer spending trends and how Dillard’s can maintain growth amid a competitive retail environment. The company also declared a quarterly dividend of $0.25 per share.
- Flowers Foods, Inc. (NYSE: FLO)
Flowers Foods exceeded earnings expectations with an EPS of $0.30, beating the consensus estimate of $0.29. However, revenue of $1.24 billion fell slightly short of the forecasted $1.27 billion. The company posted higher-than-expected earnings due to increased demand for packaged baked goods, but margins were squeezed by input cost inflation and labor shortages. Investors are concerned about the company’s ability to manage rising costs and potential margin pressures moving forward, as shares traded down 3.7% following the announcement.
- Foot Locker, Inc. (NYSE: FL)
Foot Locker’s earnings report showed modest improvements with the stock price rising 0.35% to $25.78 following the earnings release. The company’s performance has been solid but still faces challenges with inventory management and the shifting preferences of consumers. Investors will closely monitor Foot Locker’s strategy for navigating these retail challenges, particularly in relation to inventory levels and adapting to evolving trends in the footwear market.
Earnings Due for August 18, 2025: What to Watch
- Palo Alto Networks, Inc. (NYSE: PANW)
Palo Alto Networks is expected to deliver strong earnings driven by growing demand for cybersecurity solutions, particularly in cloud security. Analysts are looking for robust subscription revenue growth and insights into the company’s ability to sustain demand in the face of evolving cyber threats. Investors will be focused on the company’s guidance and strategies to strengthen its position in the competitive cybersecurity landscape.
- Fabrinet (NYSE: FN)
Fabrinet is expected to report solid earnings, benefiting from continued growth in the telecom and cloud infrastructure sectors. Investors will be looking for updates on demand for optical components, the company’s ability to manage supply chain dynamics, and its efforts to address production bottlenecks. Given Fabrinet’s position as a supplier in the tech industry, its earnings report could provide insights into broader trends in tech hardware demand.
- XP Inc. (NASDAQ: XP)
XP Inc. is likely to report earnings amidst a challenging environment for brokerage firms, where increased market volatility has affected trading volumes. Investors will be closely watching XP’s earnings for guidance on how the company is navigating evolving financial market conditions, especially in its efforts to diversify its revenue streams and expand its customer base. The company’s performance will offer valuable insight into the broader trends affecting the financial services industry.
- Bath & Body Works, Inc. (NYSE: BBWI)
Bath & Body Works will report earnings at a time when consumer preferences in the personal care sector are shifting. Investors are keen to see how the company has managed to retain customer loyalty amid inflationary pressures. Analysts will focus on sales trends in key categories, such as fragrances, and whether Bath & Body Works has been able to leverage its brand strength to sustain growth. The company’s approach to navigating consumer sentiment and managing costs will be a key point of focus for investors.
Stock Market Summary – Monday, August 18, 2025
U.S. stock markets opened the week quietly, with a sporadic batch of economic data and geopolitical events having sent mixed signals. Investors are considering the implications of July retail sales and patterns of consumer sentiment and are monitoring President Donald Trump’s recent comments on trade and economic strategy. The S&P 500 and Nasdaq are down softly, while the Dow has been showing some buoyancy on the strength of defensive shares. The small caps are still underperformers, hinting at risk-off attitude being sustained.
Stock Prices
Economic Trends and Geopolitical Events
Markets are working their way through the series of variables which continue to formulate sentiment. July retail sales were higher than forecast to the upside, thus calming bets on aggressive monetary easing, while initial measures of consumer sentiment also suggest cautious optimism amongst consumers. Geopolitical risk, including ongoing US-Chinese trade talks, also generates volatility. Investors are balancing, and this has led to selective buying of defensives and quality growth stocks, with subdued cyclical sector rotation.
Latest Stock News
10 monopolies shaping the future
- $NVDA | Nvidia powers AI, remaining at the leading edge of artificial intelligence solution innovations globally.
- $PLTR | Palantir Technologies is the operating system of AI, powering enterprise analytics and AI unification.
- $META | Meta remains at the top of social media, using AI and VR to improve interaction.
- $GOOGL | Alphabet dominates search and possesses clear control over information flows throughout the Web.
- $AXON | The company operates public safety technology, growing its AI-powered products and software services.
- $TSLA | Tesla is a virtuoso of applied AI used in autonomous cars and energies.
- $AMZN | Amazon has built unprecedented global logistics that have driven supply chain and e-commerce innovation.
- $ASML | ASML has industry-leading chip-manufacturing tools, essential to the chip industry.
- TSM | TSMC supremacy in chip manufacturing provides necessary parts used by tech leaders globally.
- $MSFT | Microsoft possesses business software that integrates productivity and cloud platforms and AI.
Together, these firms create tech dominance and directions of markets in the future, confirming that mega-cap dominance remains to define S&P 500 performance.
The Magnificent Seven and the S&P 500
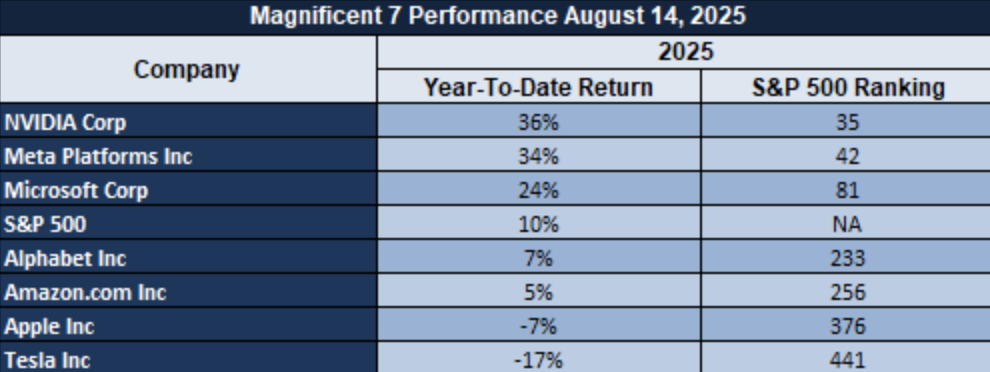
The “Magnificent Seven” of Apple, Microsoft, Nvidia, Amazon, Meta, Alphabet, and Tesla are withdrawing after prolonged runs. Shares collectively trade more than 16% below recent highs, with sell-offs led by Meta and Tesla. The correction is normalizing valuations in hotspots of AI-driven expansion. Support is muted at best from energy and industrials, and the S&P 500 has little room on the upswing until mega-cap leadership finds its groove.
Major Index Performance as of Monday, August 18, 2025
- S&P 500: Trading at 5,860.12, down 0.2% on the day.
- Nasdaq Composite: Currently at 18,350.44, down 0.4%, pressured by tech weakness.
- Dow Jones Industrial Average: Up 0.3% to 41,240.56, supported by financials and energy.
- Russell 2000: Trading at 2,162.88, underperforming due to small-cap caution.
We continue to be attuned to sector rotation and earning patterns at Zaye Capital Markets. Name selection and defensive exposure will be paramount as markets continue to navigate through economic and political uncertainty.
Gold Price
Gold remains firmly supported, with spot trading in the $3,340–$3,370/oz range, while SPDR Gold Shares (GLD) hovers near $307.43. The latest moves are driven less by economic data—today’s calendar is notably quiet—and more by political risk. President Trump’s rhetoric on tariffs for steel and chips, warnings of severe consequences in talks with Russia, and his calls for rapid ceasefire negotiations have injected uncertainty into global markets. Such unpredictability has historically reinforced gold’s role as a hedge, keeping investors defensive and sustaining flows into bullion even as risk assets tread cautiously.
Yesterday’s information brought further complexity. U.S. PPI climbed 3.3% year-on-year, higher than the expected 2.5%, and jobless claims fell to 224,000. Those numbers lowered dovish Federal Reserve easing expectations, pushing gold lower on heightened yield assumptions. Nevertheless, the metal still advanced, with spot gold rising close to $3,341.90/oz and futures to $3,387.60, showing the way geopolitical uncertainty and ongoing inflation overpowered the brake of higher interest rate expectations. Combined, Trump’s unpredictable policy attitude and ongoing inflation risks make gold maintain its safe-haven stance, which lends prices a solid band.
Oil Prices
Crude is lower at $62.76/bbl., and Brent at $65.50, recording a more general month-down decline of near 5%. Prices are fading on oversupply risk with OPEC+ supply remaining high, US supply remaining healthy, and summer demand peaking. Premium spread narrowing and structurally weakened demand are among recent indications, underpinning the bearish bias. Short-term technical bounces are evident, but fundamentals are pointing towards an imbalance market with builds in stock and spare capacity.
The political stresses have provided volatility. His meeting with Russian President Putin in Alaska eliminated fear of additional sanctions on Russian energy, supporting prices while traders looked for freer supply from Russia. His remarks on chip and steel tariffs created uncertainty, decreasing the risk sentiment and spilling over into commodities. Although yesterdays US data docket was subdued, earlier steadfast PPI and declining jobless claims underpinned the stronger dollar, putting pressure on the oil. Without major economic releases today, the markets will be looking at OPEC’s production attitude and IEA’s demand releases for cues, with geopolitics and supply forecasts remaining the underlying motivators.
Bitcoin Prices
Bitcoin stabilizes at $116,200, falling back after it probed highs of around $118,500, institutional demand and political narratives fueling demand once more. Gigantic inflows in U.S. spot ETFs, MicroStrategy’s massive reserves, and El Salvador’s recent purchases all underpin Bitcoin’s increasing adoption as a store of value, and European custody growth and wallet adoption through fintech are emblematic of increasing retail and private demand. Trump Media’s multibillion-dollar Bitcoin purchases in and of themselves have further locked digital-assets inside company coffers, illustrating how capital markets on the mainstream are incorporating Bitcoin into long-term planning.
At policy level, President Trump’s pro-bitcoin stance—supporting reserves, deregulatory opening up, and retirement fund exposure—has provided the stimulus, reinforcing the “digital gold” theme on Bitcoin. All the same, macro forces are dictating: yesterday’s resilience in US PPI data fueled pullback from all-time highs around $124,000 as investors repriced Federal Reserve easing prospects. It is this two-way character that captures Bitcoin’s dual nature as both hedge and risk asset—strongly underpinned, of course, by institutional chatter and political backing, but susceptible to shocks from inflation and monetary policy uncertainty driving short-term price dynamics.
Eth Prices
The price of Ethereum is currently sitting at around $4,392, varying between $4,391 and $4,569 during the previous session. Institutional demand and whale purchases support the optimism: there are more than $882 million of ETH bought through OTC desks and exchange withdrawals, and there is a subdued buyer who has accumulated $1.3 billion spread across multiple wallets. The humongous supply demand and increased ETF demand reflect strong conviction in Ethereum’s long-term direction and price strength despite near-term volatility.
Short-term threats do still exist, though. Unwinding shorts will capture leveraged long liquidations, incurring quick pullbacks, experts further point out. Also, some approximately $3.9 billion of ETH are set to be unstaked over the coming weeks, pouring additional supply into markets. Institutional buying and ETF flows, though, will, however, cap pressures such as these, limiting downside risks. Broadly, the future of Ethereum is still in balance—driven by aggressive institutionally and whale-buying, but countered by overhangs of liquidity, which are set to cause price volatility.
