Where Are Markets Today?
European equity futures opened modestly higher today, with the Euro Stoxx 50, DAX, and FTSE up 0.2–0.3%. Encouragement is in the form of news of advances in Ukraine diplomacy after President Trump’s renewal of the invitation for President Zelenskiy to Washington, and this is fuelling hopes of eventual de-escalation against Russia. European investors, especially sensitive to energy security and supply chain threats, are discounting fewer geopolitical risks, and this is supporting the mood. US stock futures, in contrast, edged modestly lower—Dow futures fell 38 points (-0.12%), S&P 500 futures fell 0.14%, and Nasdaq 100 futures fell 0.18%—and this is showing a more subdued tone on Wall Street.
The divergence fits into area priorities: Europe is hit head-on by geopolitical risk, and the U.S. by monetary policy. Traders are awaiting the Jackson Hole symposium, where Fed Chairman Jerome Powell establishes a major policy tone. As markets already assume an 83% possibility of a September cut, investors are awaiting Powell’s speech before making overstretched bets. Markets are seeking a dovish tilt, but a hawkish reversal would upset sentiment and continue the selloff on the U.S. futures. There are two underlying drivers pushing futures at the moment. European geopolitics optimism is causing a small bounce, with potential upside risks in the chance of U.S.-Russia-Ukraine talks helping to eliminate the near-term risk premium. Caution in U.S. policy is suppressing optimism, with investors looking for Powell to give some indication of whether the Fed looks committed to its path of delivering September and end-of-year rate cuts. Company earnings are a lower-order matter, as well, with Home Depot reporting today and other retail giants due to report, which will shape intra-term consumer and growth assumptions.
Overall, markets are delicately balanced between caution and hope. European markets are playing catch up on better diplomacy, and American markets are apprehensive waiting for a big Fed event. Zaye’s commentary is, on a repeat of dovish tones by Powell, a rally on U.S. futures would be synchronous with Europe. But on a repeat of worries around inflation or calls for policy independence, equities can be range-bound, onus of supporting markets on the shoulders of geopolitical events from outside.
Major Index Performance on Tuesday, August 19, 2025
- S&P 500: At 6,432.96, flat for the day.
- Nasdaq Composite: At 18,220.11, down 0.2%.
- Dow Jones Industrial Average: 44,905.23, down 0.3%.
- Russell 2000: At 2,279.60, up 0.3%.
The Magnificent Seven and the S&P 500
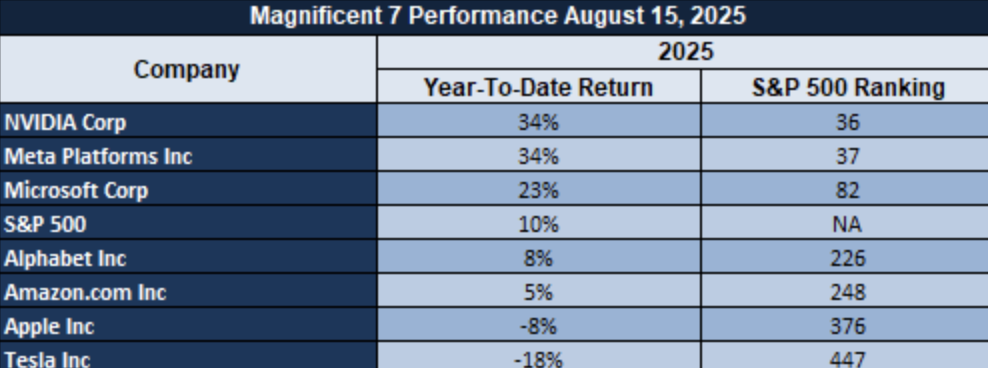
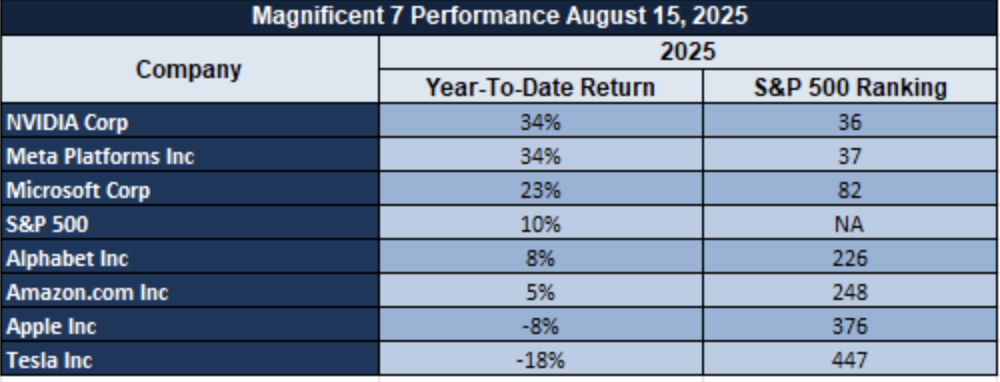
The “Magnificent Seven” — Apple, Microsoft, Nvidia, Amazon, Meta, Alphabet, and Tesla — are all feeling squeezed too. Here, the group has averaged declines of over 18% from recent highs, and they are led by Tesla and by Meta. That’s a tech leadership valuation reset, and its direct aim is the S&P 500. Energy and industrials are offering some soft support, but unless mega-cap leadership got better, upside conviction is weak.
Drivers Behind the Market Move
- Diplomatic Optimism Powers Up European Markets
European futures are higher as investors react to new Ukrainian peace talks momentum. President Trump’s meeting with President Zelenskiy and European leaders, and his indications to Putin and the potential for a trilateral summit, have increased hopes for de-escalating the conflict. This is lowering the kind of geopolitical risk premiums that usually beset European equity and energy markets.
- Federal Reserve Focus and Rate-Cut Expectations
The September US markets are navigated cautiously following major speeches by Fed officials at the Jackson Hole symposium. As the fed funds futures market is pricing a 25-bps cut in September at an 83-86% probability, there is a growing consensus of dovish tone. Any hint that a rate cut is on its way can support equities, but ambiguity or hawkishness can temper market sentiment.
- Robust Consumer Spend Holding Sentiment Firm
Market stability on the shoulders of strong consumer demand, headlined by high-paying households, remains supporting it. Despite rising credit stress by low-earning households, strong aggregate wage earnings and steady consumption by high-earning households are easing recession worries. This remains a cause for at least a year-end continuation of growth, giving regard to consumption’s significance to the GDP of the U.S.
We think markets are evenly weighted between geopolitical optimism and policy caution. Risk balance is in Jackson Hole but, at the moment, diplomatic evolution and strong consumer strength are offering a floor under equity markets, especially those in Europe, waiting for stronger policy guidance by American traders.
Digesting Economic Data
The TRUMP Tweets and Their Implications
US President Donald Trump’s recent tweets and comments encapsulate both of his twin focuses of home domestic electoral reform at home and international statesman work abroad, both of which are of major market significance. At home, Trump rededicated agendas of “getting rid of” the mailing of ballots and reform of voting machines, signing on Twitter what he terms “sophisticated watermark paper” as a futureproof of voting integrity. Trump has additionally rededicated signing of a future executive order on the midterm elections of 2026, aiming to insure what he terms increased honesty within systems of voting. Such vows, even if politic in tone, carry investor concern of institutional credibility, providing a measure of uncertainty which can underlie defensive flows into safe-havens such as Gold while acting on risk appetite within equities.
Global, Trump’s communication of contact with Ukrainian President Volodymyr Zelenskyy and potential direct talks with Vladimir Putin summarize the central role of the American leadership in establishing the trajectory of the future of the Russia-Ukraine war. But by providing markets hope and a chance of a trilateral summit, Trump injects a qualified optimism, which is tempered by his simultaneous communications of there would be no ceasefire, and fighting may continue even if a search towards peace starts. This reflects the subtle balancing between fighting and negotiation. For oil markets, uncertainty has direct ramifications: actual diplomatic breakthroughs would act to allay disruption of supplies and low prices, while sustained conflict has a risk premium embodied in crudes. Aside from commodities, Trump’s positioning has spillovers to other assets. Traders view him turning towards Russia and Ukraine as giving a possible shift of direction in geopolitical risk, which, if it came, would ease equities’ volatility and make a case for cyclicals. Uncertainty over outcomes, however, prevents markets from fully pricing in de-escalation. Any such “wait-and-see” environment is amenable to rangebound trades wherein assets such as Bitcoin benefit as alternative hedges in the period of political uncertainty with shifting monetary expectations.
In Zaye Capital Markets, we find Trump’s remarks an articulation of the growing intersection of political rhetoric and financial markets. Local policy risk is triggered by his election reform platforms, and international security dynamics are affected by his diplomat personality. To clients, the remarks imply heightened sensitivity across asset classes: Uncertainty works in favor of Gold and Treasuries, hopes for peace push the oil price, and cryptocurrencies affirm their niched function of non-sovereign conduits of value. As long as there is no clarity in sight, Trump’s remarks are an excellent driver of market psyche, highly worthy of close attention by investors hedging in a risk-prone macro and political environment.
Housing Confidence Drops Because of Rate Pressures
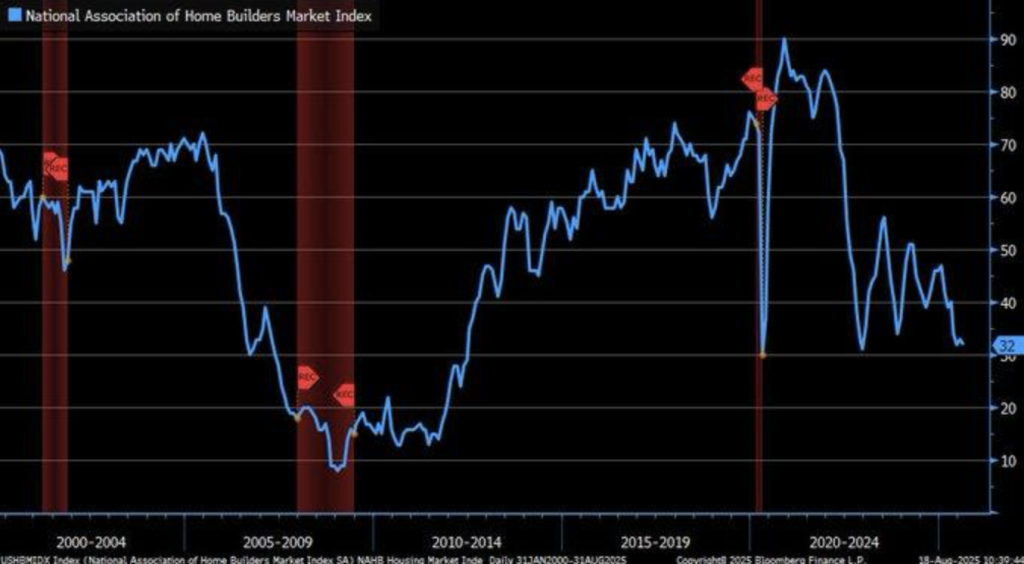
The latest fall in the U.S. Housing Market Index to 32 is corroborating the chorus of affordability concerns and softening builder sentiment. 6.58% mortgage averages have deterred most potential customers from the market, leading 37% of builders to reduce prices by around 5% and nearly two-thirds of builders to resort to incentives in a bid to spark demand. Softness persisting offers clues to the way in which greater borrowing costs are rewriting construction fundamentals and anaesthetizing pipelines of new projects. A modest upturn in prospective buyer traffic since May, however, belies underlying demand for respite in financing circumstances, and portends the possibility of a reversal subject to rate reductions becoming a reality.
Historical patterns verify the narrative. Since the beginning of January, a 0.5 percentage-point drop in mortgage rates already has shown modest relief, highlighting the central bank policy’s leadership role in residential activity direction. State-level nuances obfuscate the big picture: the Northeast has dipped into its troughs of confidence since early 2023, a reflection of deeper structural and regulative issues, while the West has sustained modest gains, a reflection on regional economic conditions and policy configurations. These performances at various levels lend support to the proposition that the decline of the American residential market cannot be considered a one-size-fits-all story but a patchwork of adjustments and impulses at the state level.
We believe Lennar (LEN) is undervalued at current prices, with its solid balance sheet, national diversification, and capacity to use incentives to counteract volumes lost by peers with more dramatic declines. Investors will be watching Treasury yield signals and short-term housing start signals, as both will be crucial in determining if consumer traffic is driving strong sales. Interplay between monetary policy changes and local limitations is the dominant trend of opportunity in the near term, and homebuilders with the ability to react most quickly to pricing trends and geographic exposure are positioned best to succeed.
Economic Calendar Signals Sharp Divergences
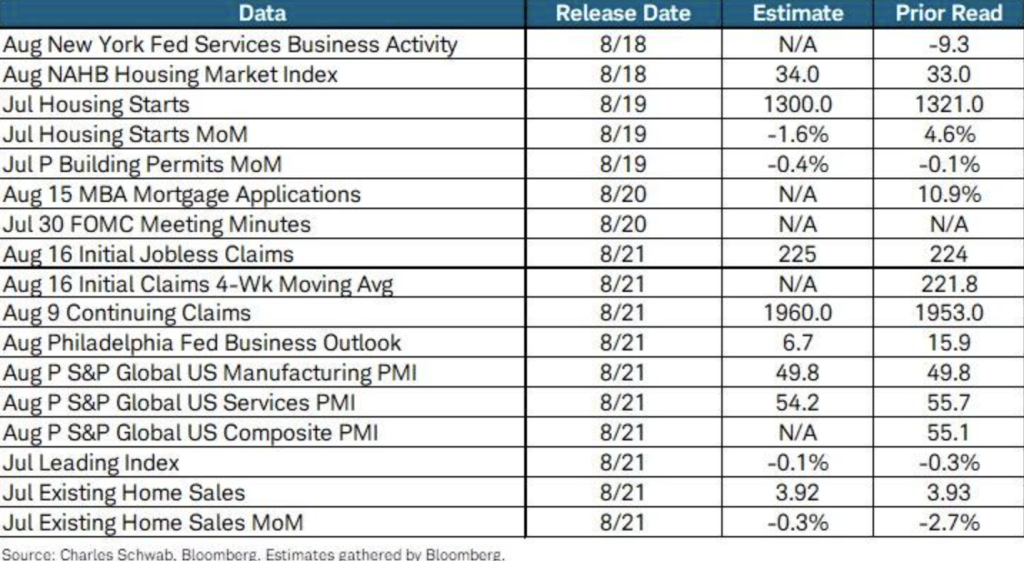
The Aug. 18-21 releases from the U.S. are a reminder of just how volatile and one-sided the economic atmosphere is. From a range of a -3.9% Leading Index forecast all the way to 198,000 jobless claims, markets are left with conflicting messages which muddy the canvas of sustained recovery. Housing sentiment is still subdued, with the NAHB index falling further, which would tend to verify that rising mortgage rates are continuing to hammer construction and affordability, and attitudes towards purchasing depend very much on monetary policy.
International comparable provide fleshing-out of the picture of divergence. As American residential starts fell 1.8% in July, domestic markets like Glasgow saw more than 8% year-on-year appreciations in house prices, a pointer to the resilience of some geographies even in softer aggregate markets. Such a divergence exhibits the reality where international employment and residential patterns are no longer moving in sync, and neighborhood policy regimes are playing a increasingly larger role in shaping outcomes. Such diversification raises the question of whether investors can anymore be dependent on broad-based macro themes, or whether finer sectoral and geographic nuances would be the standard of the next page of market evolution.
Where we are sitting, D.R. Horton (DHI) looks cheap as it is well placed to navigate U.S. cycle turns with a solid pipeline and ramping ability of incentives despite weakness in the near term in the housing market. Analysts need to keep track of jobless claims carefully and leading index releases later this week, as sharper-than-anticipated drop in labour market trend would put more pressure on the Federal Reserve to accelerate pace of rate cuts. Such occurrences would be crucial in giving guidance on pace of revival of latent housing demand and which of the homebuilding stocks gain early traction.
Housing Price Cuts Signal Market Reset
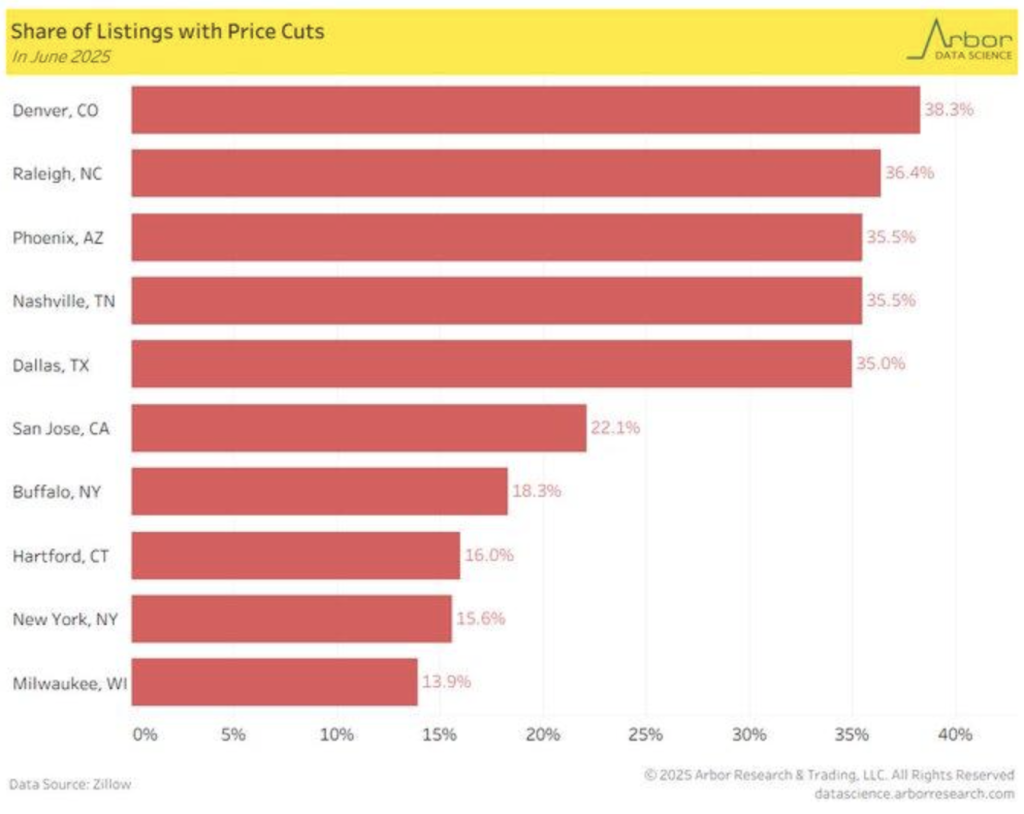
The steep spurt in home cuts with price concessions is a reflection of the rebalancing of the U.S. residential market. Denver, in June 2025, saw the highest percentage of cut listings at 38.3%, followed by Raleigh with 36.4% and Phoenix with 35.5%. Such readings are a reflection of the elevated mortgage rates and inflated inventory forcing sellers into concessions, a reversal of the high appreciations of the earlier years. Otherwise considered healthy, such metro economies see some of the deepest corrections now, a trend to drag national averages lower. Such pressure is a reflection of caution among buyers unwilling to push beyond affordability limits, the turning point of a sort in demand-supply dynamics.
Monetary policy is the catalyst of such a transition. The signal by the Federal Reserve towards easing has already reduced the marginal cost of funds, but the residual pain of years of high rates persists. Historically during past cycles of houses, inventory surpluses are followed by 8-10% corrections in prices, on course with Denver’s pattern of expectation. Local differentiation counts, too: western and southern metros are subjected to severe pullbacks, others less due to narrower structural supply constraints and population tailwinds. This is all intended only to illustrate that although the correction is widening, its depth is city-specific, which is making the one-size-fits-all recovery narrative all the harder. We believe Zillow Group (ZG) is undervalued at Zaye Capital Markets. As reset in residential market picks up speed, its platform and data relevancy increase, which bode well to capitalize on stream of transaction when affordability improves. Investors need to monitor closely pace of declines in mortgage rates, absorption of high inventory, and sensitivity of buyer traffic. These are likely catalysts of whether this bottom in declines of pricing turns into a wider correction or slips into a cycle recovery, which in turn dictates investment opportunity in residential and related space.
Consumer Sentiment Suggests Increasing Job Concerns
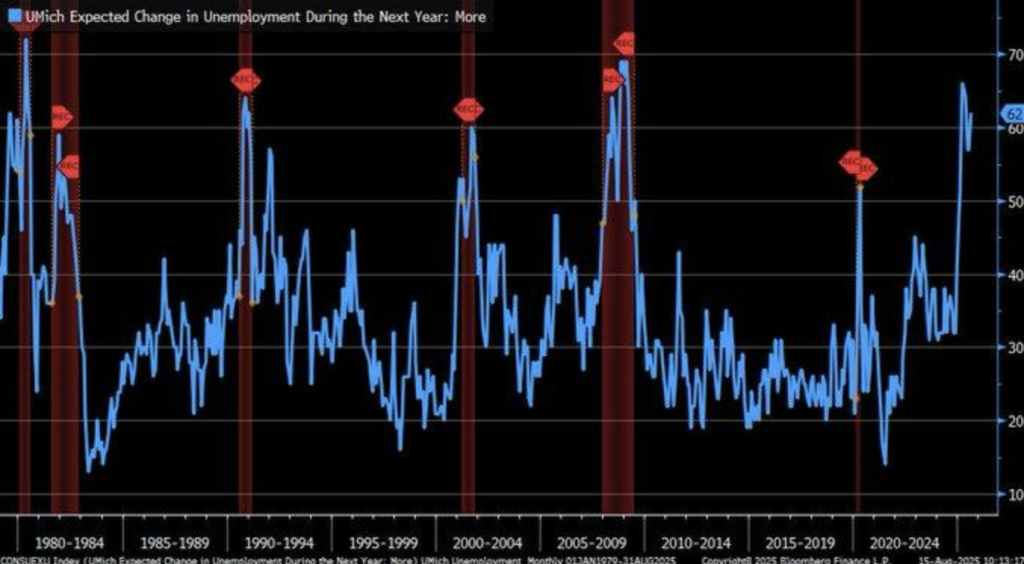
The consumer sentiment measure in early-August 2025 by the University of Michigan notes a swift increase in expectations of higher unemployment in the following twelve months, red-diamond peaks on the chart in the past also marking past recessions like 2001 and 2008-09. This gives evidence of consumers signaling stress in the labour market a long way before official statistics make it public. Increased caution towards safety of jobs is a pointer towards curtailing household consumerism, precautionary saving gaining pace whenever consumer sentiment is that the employment situation is less rosy.
Historical verification of sentiment secures sentiment not as a noise variable but a predictor. National Bureau of Economic Research set a strong 0.72 correlation of future change in unemployment and consumer expectations over a 12-month span. Assuming persistence, recent acceleration of pessimism would foreshadow a decline of American employment statistics by June of 2026, challenging the resiliency theme provided by past-focused GDP data. Global stability of unemployment at 5.2% makes obvious locally distinct causes, such as acceleration of company financing terms, increased wage rates, or tech-industry focus of layoff.
We believe Paychex (PAYX) is undervalued on these assumptions. Its human resource and payroll services give us a current snapshot of employment trends, and it’s a defensive stock and can be an early winner when job recoveries are achieved. Anticipate ahead of time on future jobless claims, nonfarm payrolls, and company layoff announcement updates, which will determine if in fact sentiment gets translated into labour market weakness through a leading indicator. The question is one of whether consumer pessimism leads to self-reinforcing demand declines or policy easings hold down employment before pessimism affects hard data.
Manufacturing Output Shows First Strong Recovery Signals
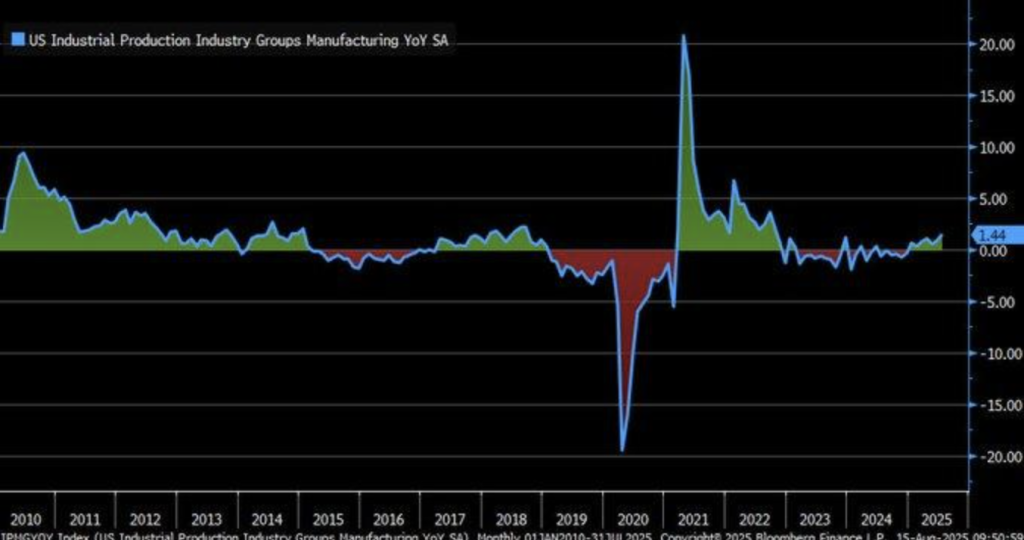
US manufacturing industrial output increased by 1.44% year-on-year during July 2025, marking the highest increase since October 2022. Reading on the Federal Reserve’s index of 103.9867 evidences a sector gaining strength after a prolonged period of weakness. This surging trend implies stability on the part of the manufacturers even in the face of stiff headwinds of higher rates of borrowing and weaker global demand. This increasing trend may be a reflection of early cyclical recovery, the data of production once again signaling industrial resilience and not contraction.
This change is set against the backdrop of 2023–24, when it was interrupted by labour shortages and supply chain disruptions. Firms resorted to automation, where 62% of firms embraced robotics in an attempt to make up for capacity limitations, something which is yet to be translated into efficiency improvements. Adoption of high-end technology would seem to lag behind the sustained increase in productivity, allowing firms to respond to demand even when labour pressures and input prices are elevated. Utilization by way of technology is seen to be at the core of the sector to increase output in an uncertain world.
Policy tailwinds are fueling the recovery as well. The $50 billion U.S. CHIPS and Science Act investment in semiconductors and the $1.2 trillion Infrastructure Act keep pumping money into the manufacturing corridors, specifically electronics and transportation. Such programs are fueling resilient pipelines of demand, although the longer-term trend of the industry will remain conditioned upon a development of the global trade risks and geopolitical tensions. We believe Caterpillar (CAT) is cheap in its investment in infrastructure and global industrial consumption. Order backlogs, export flows, and regional PMI data are what are needed to validate whether such a recovery constitutes a larger manufacturing cycle.
Retail Sales Control Group Highlights Consumer Resilience
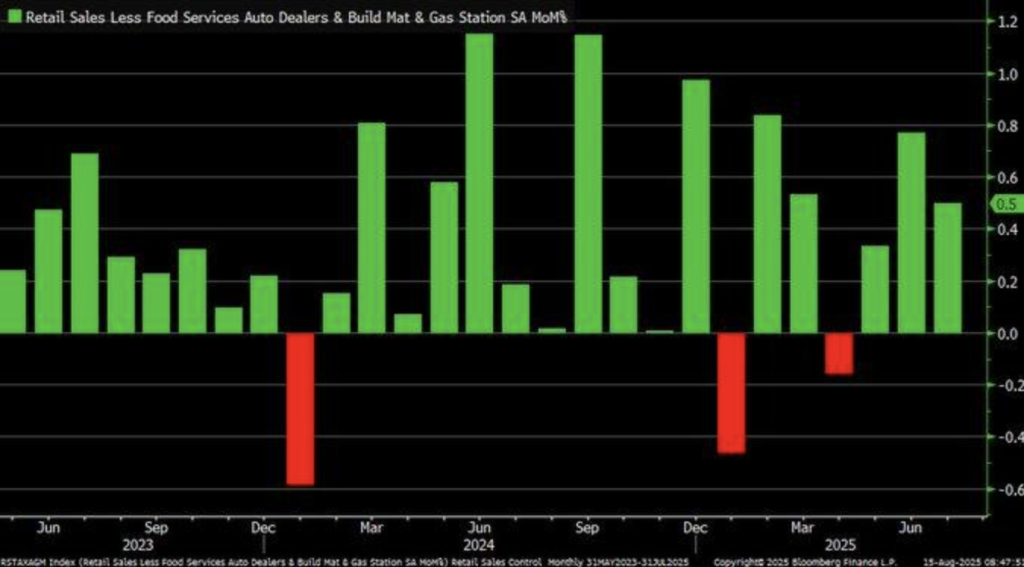
The July 2025 retail sales increase by the “control group,” a key input to the consumer spending element of the GDP, is the third straight monthly increase, justifying household strength against headwinds due to tariffs. A 0.5% increase foretells where spending directions are positive towards overall economic growth, where consumer demand has ironed out trade change conditions. Sales softness during end-2024, which can be attributed to uncertainty surrounding tariffs, is a testament retail flows’ sensitivity to policy shocks, but rebounding later into mid-2025 would be evidence consumers have reconciled.
The indicator carries additional weight due to personal consumption spending, which stood at 67.7% of GDP in Q1 2025, itself directly correlating with it. Statistics show consumption is still the epicenter of economic activity in spite of tariff headwinds, with consumers proving braver than slowdown headlines indicate. Pre-tariff stockpiling activity and shifting to lower-cost items seem to be cushioning the effect, though steadiness of labor income seems to be good news for further spending. Durability of strength is still a test, though, in the event the terms of the labor market weaken as consumer sentiment measures threaten.
We believe Target (TGT) is currently undervalued, given its wide range of products and potential to benefit from sustained consumer demand amidst the background of tariff pressure. To assess consumer momentum’s direction, we suggest monitoring retail control group tendencies/personal consumption spending in relation to tariff-linked policy change, which would help define whether consumer traction is a force strong enough in negating overall economic weakness. Direction of household spending would be a key driving factor of second half of 2025 GDP growth and sentiment.
Consumer Buying Conditions Weaken Sharply
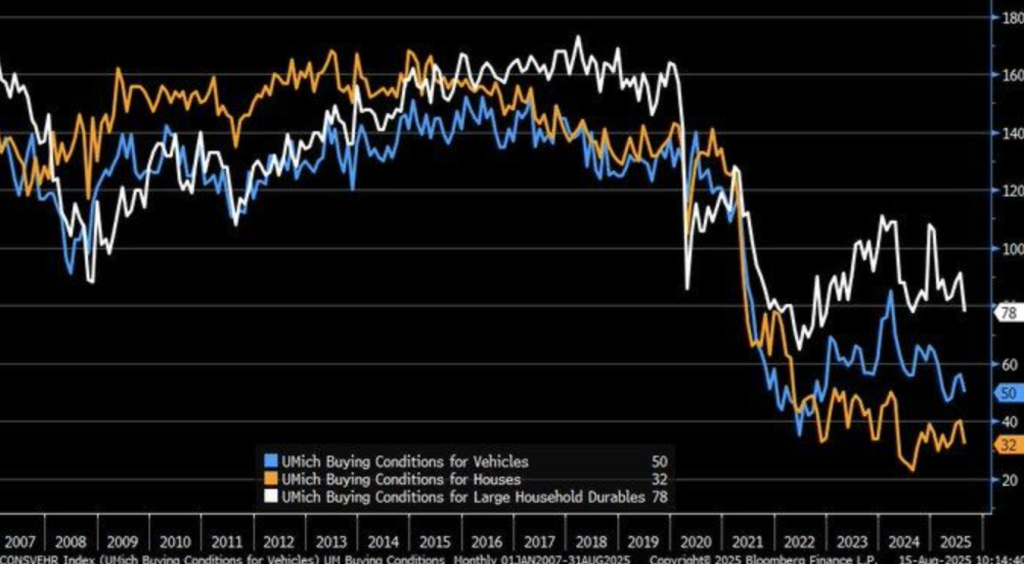
The University of Michigan sentiment reading of August 2025 reveals a rapid deterioration of consumer spending circumstances in autos, residential, and high-ticket household durables, with sentiment on durables dropping to a one-year low. Heightening anxiety on inflation remains the dominant force, acting negatively on household’s propensity to make high dollar commitments. Higher borrowing costs, combined with constraints on affordability, are keeping down demand in those product groups traditionally signaling optimism on medium- toward longer-term financial strength. This dissipation of durables demand is a reflection of more apprehensive consumer attitudes, supplemented by household pullback in the face of strains in the macroeconomic scene.
Higher rates are step- upping the trend. As policy rates are increased by the central bank due to inflation, cost of borrow- ing is reaching levels significantly impacting discretionary spending. Statistical evidence identifies a 1%-point rates increase reducing durable spending by nearly 0.8%, and the sector is highly responsive to monetary tightening. Soft recovery during 2025 outlines the truth consumption- oriented houses are restrained even in a period of overall macro stability, which is a indicator of vulnerability underlying the trend. Differential between headline growth and weak consumer sentiment identifies structural stresses within residential and automotive markets driving cyclically induced pressures.
From our perspective at Zaye Capital Markets, Ford Motor Company (F) is currently undervalued, since there are opportunities for exploiting cost reduction and aligning product re-shufflings with changes in affordability trends. We would monitor the pace of movement of interest rates, delinquencies of auto loans, and leading consumer sentiment indices. They would inform us whether weakness in big-ticket spending endures or reverses with eventual monetary easing. The development would be important to gauge if consumer caution turns into a wider economic slowdown.
Retail Sales Growth Holds Steady Amid Volatility
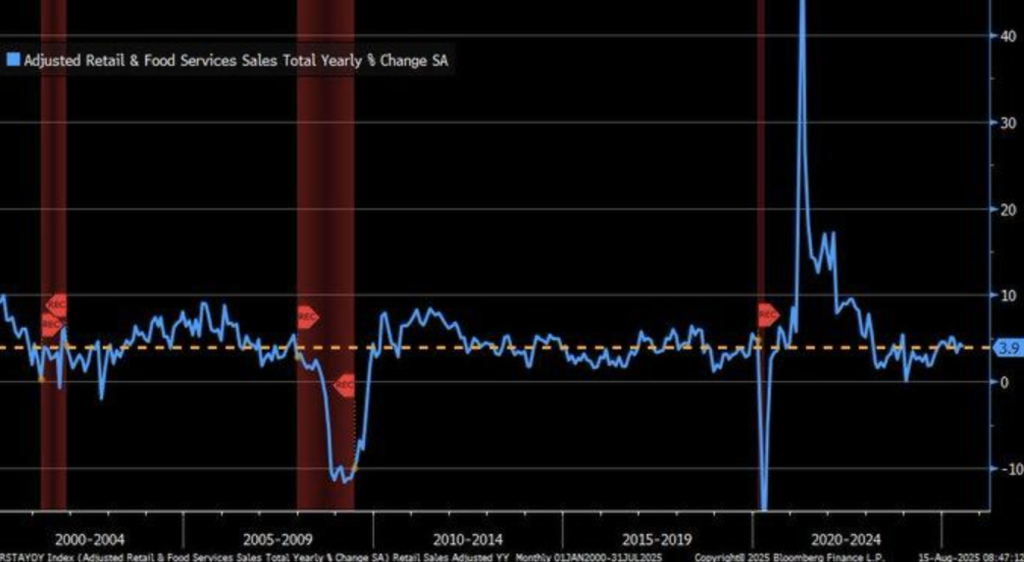
American retail and food service sales grew 3.9% per year in July 2025, to $726.3 billion, in advance estimates. While such a rate continues to be largely near long-term trends, the latter continues to be significant in terms of recent uncertainty. Stabilization shows consumers’ capacity for spending pace despite recent high rates and inflation, showing household demand as a foundation of overall economic activity. Stability, however, conceals underlying weakness, when growth continues to be founded on necessity spending instead of discretionary growth.
History brings current resilience into sharper perspective. Consumer spending recoveries are likely to track increasing demand after phases of restraint rather than persistent structural shift. 3.9% growth rate might therefore be a catch-up rebound from supply shocks and policy shocks, rather than a start of a new growth cycle. Comparisons with previous downturns, such as those including the crashes of 2008-09 and 2020, highlight the speed at which sentiment can reverse in the presence of external shocks, and markets are cautious to predict too far ahead on the basis of this stability.
We believe Costco (COST) is too low on the ground. Capture of robust consumer demand by scale efficiencies and economies of prices in bulk places it in a good position in case volatility accelerates. Investors need to watch discretionary category trend, retail sales on a comparable basis, and shifts in consumer credits usage. The latter will help decide spending levels are sustained or a temporary high before general pressures on household spending re-emerge.
Upcoming Economic Events
With nothing notable on today’s list of releases, markets suspend breath, waiting for the next series of catalysts to alter mood and influence positioning. These periods usually trim volume and range in but also lay the groundwork, too, for greater reactions subsequently when news or policy directives are released.
Quiet on the headline side for investors doesn’t always remain quiet below. Market players are rethinking plans with regards to the convergence of robust consumer demand, residual risks of inflation rising higher, and the Federal Reserve’s direction. This calm of pause is a period of rethinking portfolio exposure before flows of information get higher again.
We would suggest our clients capitalize on the spells of quiet during which they can concentrate on market breadth, turns within a sector, and direction of the yield curve. Such spells of quiet usually serve to distinguish patient investors from noise traders. Coming economic data releases subsequently during the week are significant in whether strength spills into the second part of the year, or underlying weakness gathers increasing notice.
Stock Market Performance
Indexes Rally from April Lows, But Drawdowns Expose Fragile Market Breadth
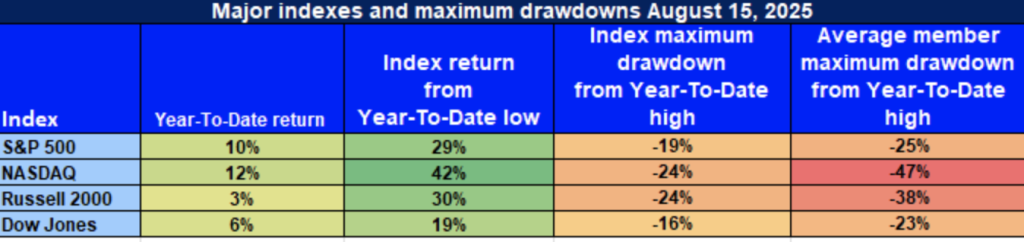
U.S. equities have mounted a significant recovery since the April 8th lows, yet headline gains mask the fragility underneath. While index-level performance appears encouraging, deep drawdowns from year-to-date highs and heavy average member losses reveal how narrowly led this rally remains. The divergence between benchmarks and their underlying constituents continues to raise questions about sustainability.
📈 S&P 500: Resilient But Narrow
YTD: +10% | +29% off April low | -19% from YTD high | Avg. member: -25%
The S&P 500’s 10% gain year-to-date and a 29% rebound from April lows show clear resilience in large caps. However, the index remains 19% below its yearly peak, and average members are down 25%, illustrating that performance is concentrated in a handful of mega-cap leaders. This imbalance suggests that while institutional flows continue to support index strength, breadth is too weak to confirm a durable bull market.
🚀 NASDAQ: Strong Rebound, Harsh Underlying Losses
YTD: +12% | +42% off April low | -24% from YTD high | Avg. member: -47%
The NASDAQ has led recovery, surging 42% from April’s bottom and up 12% on the year. Yet beneath the surface, the picture is far less robust: the index is still 24% below its peak, and the average member has lost nearly half its value from highs. Such dispersion underlines that while large-cap growth remains the backbone of U.S. equity momentum, smaller tech and speculative names remain under significant pressure, raising questions over sector sustainability.
📊 Russell 2000: Small-Cap Struggles Persist
YTD: +3% | +30% off April low | -24% from YTD high | Avg. member: -38%
The Russell 2000 shows how fragile sentiment is outside large-cap benchmarks. Although it rebounded 30% from April lows, it is only 3% higher year-to-date, reflecting weak conviction in small-cap recovery. A 24% decline from yearly highs and 38% average member drawdown highlight the vulnerability of smaller, less liquid firms, particularly those tied to cyclical sectors and higher financing costs. This index underscores where the broader economy still shows strain.
🏛 Dow Jones: Defensive Tilt, Modest Losses
YTD: +6% | +19% off April low | -16% from YTD high | Avg. member: -23%
The Dow has gained 6% this year and recovered 19% from April levels, benefiting from its defensive composition. The relatively shallow 16% drawdown from its peak demonstrates stability compared with tech and small-cap indexes. Yet average member losses of 23% show stress remains even in value-oriented sectors. The index offers relative safety, but investors should be mindful that resilience here does not eliminate underlying pressures in industrials and consumer cyclicals.
At Zaye Capital Markets, we interpret these dynamics as evidence of a bifurcated market — headline resilience versus underlying weakness. Microsoft (MSFT) remains undervalued given its strong earnings profile, balance sheet strength, and ability to capitalise on structural growth in cloud and AI, providing stability in a volatile environment. Analysts should continue monitoring market breadth metrics and sector rotation, as a sustainable rally requires broader participation beyond the current concentration in mega-cap leaders.
Strongest Performing Sector In All These Indices
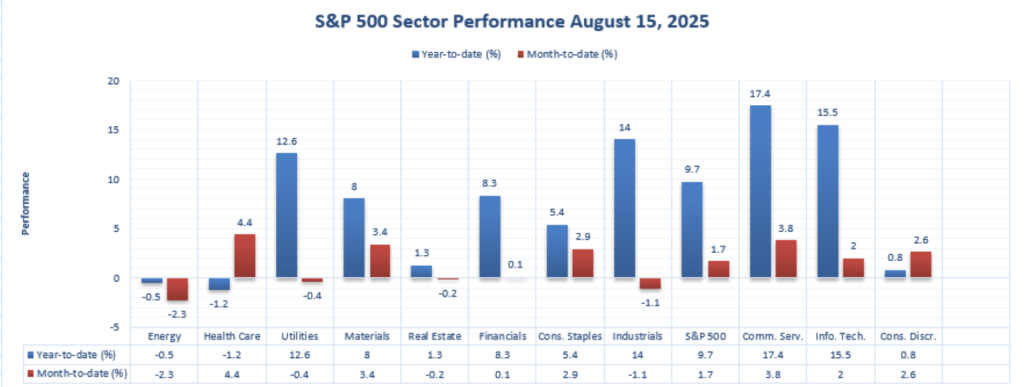
Wherever we sit here at Zaye Capital Markets, leadership on both of our two horizons is clear: year-to-date, Communications Services leads at +17.4%, followed by Information Technology +15.5% and Industrials +14.0%. Utilities +12.6%, Financials +8.3%, Materials +8.0%, and the S&P 500 +9.7% populate the second tier. Consumer Discretionary +0.8%, Real Estate +1.3%, Health Care ‑1.2%, and Energy ‑0.5% lag on
MTD leadership changes: Health Care leads with a gain of +4.4%, followed by Communications Services +3.8%, Materials +3.4%, Consumer Staples +2.9%, Consumer Discretionary +2.6%, Information Technology +2.0%, S&P 500 +1.7%, and Financials +0.1%. MTD losers are Industrials -1.1%, Utilities –
YTD leadership rests with Communication Services (+17.4%), followed by Information Technology (+15.5%), and short-term leadership with Health Care (+4.4% MTD). We’ll be watching to see if MTD leaders become sustained YTD leaders or fall back into the trend of the benchmark at +9.7% YTD.
Earnings
Yesterday’s Results — August 18, 2025
- Palo Alto Networks, Inc.
On August 18, Palo Alto Networks reported a 16% year-over-year revenue increase to $2.54 billion. The strong performance was driven by demand for cybersecurity solutions amid elevated digital risks, reinforcing the company’s leadership in the security space and its ability to capture recurring growth opportunities.
- Fabrinet
Fabrinet also released results on August 18, delivering record fourth-quarter revenue of roughly $910 million, a 19% rise from the previous year. Non-GAAP EPS came in at $2.65 per share, slightly above forecasts. Despite the beat, the stock traded lower, suggesting investor focus on future growth sustainability rather than past execution.
- XP Inc.
XP Inc. reported second-quarter results on August 18, with net income climbing 18% year-over-year to BRL 1.321 billion. EPS rose 22%, supported by revenues of BRL 4.7 billion, up 4% from last year. Client assets expanded 17% to BRL 1.9 trillion, highlighting the firm’s ability to scale and deepen its market presence.
- Bath & Body Works, Inc.
On August 18, Bath & Body Works saw its stock rise 5.16% on unusually high volume after unveiling a new Disney-themed product line. While not a formal earnings release, the market reaction underscored the impact of strategic product launches on investor sentiment.
Today’s Expected Results — August 19, 2025
- Home Depot, Inc. (The)
Home Depot is scheduled to report results today before the market opens. Analysts expect EPS of $4.70 and revenue of $45.37 billion. A strong report would reinforce consumer spending resilience in housing and home improvement, while a miss could dampen broader sector sentiment.
- Medtronic plc.
Medtronic will also post results today, with investors watching closely after recent regulatory headlines. Margins and order flow will be key factors; a beat could restore confidence, while weaker results may deepen concerns.
- Keysight Technologies Inc.
Keysight is set to release third-quarter earnings after market close. Consensus points to EPS near $1.67, with investors focused on demand for 6G, AI, and defense solutions. A strong report would highlight tech infrastructure resilience, while a miss could weigh on growth expectations.
- Viking Holdings Ltd.
Viking Holdings is due to release second-quarter results this morning, with forecasts calling for EPS of roughly $0.98 and revenue near $1.84 billion. Outperformance would suggest strength in leisure travel demand, while any shortfall could signal a softer consumer backdrop.
- Amer Sports, Inc.
Amer Sports is expected to post Q2 results before the open, with analysts revising forecasts in recent days. The release will provide clarity on discretionary spending in sports equipment, a segment sensitive to macroeconomic shifts.
- Opera Limited (ADR)
Opera Limited is also on the docket today, with consensus revenue estimated around $140 million. A beat would reinforce confidence in its digital platform monetisation, while a miss may highlight challenges in sustaining growth across competitive emerging markets.
Market Outlook – Tuesday, 19th August, 2025
US stocks are moving cautiously during the day with investors looking for a lead from the Federal Reserve’s upcoming symposium and grappling with crosscurrent messages in company earnings. The Dow Jones Industrial Average is lower, and the S&P 500 and Nasdaq Composite aren’t doing much. The Russell 2000 has small advances, which would suggest there’s a second round of interest in the small caps.
Stock Prices
Economic Indicators and Geopolitical Developments
The markets are delicately balanced between robust corporate earnings and risk of policy and geopolitical risk. News flashes reiterate the aspect of S&P 500 companies announcing one of the strongest quarters of earnings on record, wherein more than 60% of them crossed estimates by wide margins. Investors are cautious of further extension of valuations and risk of concentration of megacap tech. Geopolitics-wise, investors are looking out for potential guidance by the Fed’s Jackson Hole meeting, with cautious optimism towards Russian-Ukraine diplomatic advances.
Recent Stock News
Meta and Palantir dropped sharply due to disappointing guidance, but Palo Alto Networks jumped on solid results restoring cybersecurity’s status as a growth driver. Otherwise, megacap valuations are under threat because AIs’ trading activity is waning, causing uncertainty if there is sufficient general market breadth to continue fueling the rally.
The Magnificent Seven and the S&P 500
The “Magnificent Seven” — Apple, Microsoft, Nvidia, Amazon, Meta, Alphabet, and Tesla — are all feeling squeezed too. Here, the group has averaged declines of over 18% from recent highs, and they are led by Tesla and by Meta. That’s a tech leadership valuation reset, and its direct aim is the S&P 500. Energy and industrials are offering some soft support, but unless mega-cap leadership got better, upside conviction is weak.
Major Index Performance on Tuesday, August 19, 2025
- S&P 500: At 6,432.96, flat for the day.
- Nasdaq Composite: At 18,220.11, down 0.2%.
- Dow Jones Industrial Average: 44,905.23, down 0.3%.
- Russell 2000: At 2,279.60, up 0.3%.
We would like to know whether value and cyclicals rotation can be sustained in driving the overall market, or whether megacap weakness pulls the indices lower into the second part of this week’s trading.
Gold Price
Gold stays at $3,331-$3,334 an ounce today, holding record high levels as investors hedge against political and monetary risk. President Trump’s string of comments varying from a vow to spearhead a campaign against mail-in voting, to a call to overhaul voting machines, and hints at developments in Ukrainian diplomacy preceding negotiations with Zelenskyy and, possibly, Putin, has placed more market focus on geopolitical risk. This is supporting demand for Gold as a safe-haven asset as investors would rather be defensive until clearer results are on the horizon. Diplomatic breakthroughs may dissuade demand, but sheer weight of political risk on the table varying from electoral reform via promises of national security, and even the possibility of trilateral talks, continues to support Gold. No significant economic data is released today, which puts the markets in holding pattern, further supporting the price of Gold as a portfolio stabiliser. Yesterday’s wider sentiment is bullish for the metal, especially with investors set to look at the upcoming Federal Reserve’s Jackson Hole symposium. Hopes of dovish remarks by officials lift Gold’s relative attractiveness, where low rates render assets providing yields less attractive while subtracting non-yielding hedges such as bullion. Yesterday’s weakness in consumer sentiment, easing durable conditions, and warning signs within the various indices of manufacturing served the same purpose of bolstering the case towards safe-haven usage. From our view, at Zaye Capital Markets, we believe Gold well placed within such a setting: playing a twin role of hedging versus inflation, a buffer versus political risk, and a countertrend towards vulnerable equity breadth. So long as consensus within Fed policy direction and Trump’s diplomatic initiative remains elusive, we look for Gold set at high levels, risk towards the upside on strains persisting, or policy easing confirmation.
Oil Prices
Oil trades around Brent at ~$66.53 a barrel and WTI at ~$63.36, markets proceeding cautiously with direction defined by diplomacy and supply outlook, respectively. The International Energy Agency warned of surpluses imminent through 2026 owing to high OPEC+ output and decelerating demand growth among major economies, and OPEC is already increasing output ahead of plan. But such dynamics are dampening bullish enthusiasm, aided by testimony of shale producers retreating under margin pressure. Absence of significant U.S. economic data on Wednesday left direction of the price significantly in the hands of geopolitics, and the intersection of dovish IEA projections and incremental OPEC+ supply growth has held oil within a narrow range.
US President Trump’s remarks about Ukraine, such as a Russia-Zelenskyy trilateral negotiation, has sparked speculative hopes of reducing geopolitical risk, which has exerted mild bearish pressure on prices. Traders fear genuine peace plans would dismantle sanction-linked supply deficits and drive oil into low-$60s or even high-$50s. With no significant US data releasing today, oil remains centered on such diplomatic cues and supply-demand stories. From our observational vantage seat at Zaye Capital Markets, prices are set to remain highly volatile in their range, with near-term bias towards the bearish side unless geopolitical risk re-escalates or demand projections surprise on the higher side.
Bitcoin Prices
The price of Bitcoin stands at $117,600 today and remains close to all-time highs following a swift institutional-backed rally. Strong inflows into U.S. spot ETFs—frequently over $460 million recently—countered by recent MicroStrategy purchases and El Salvador’s recent Bitcoin infrastructure fund reflect deepening usage. Such structural supports countered some slackening of geopolitical hedge demand following President Donald Trump’s recent words on possible peace talks with Putin and Zelenskyy postponing imminent safe-haven flows. This latter political brinkmanship surrounding the U.S. elections re-affirmed uncertainty in traditional markets, favourably underpinning Bitcoin’s store of value thesis. With no key U.S. economic data on today’s schedule, analysts are highly attuned to ETF flows, institution allocation, and regulatory leadership, all of which remain positive towards Bitcoin’s ecosystem.
Yesterday’s non-material economic releases continued sentiment on positionings and flows and not on macro fundaments. This has ushered a “wait-and-see” period into the Federal Reserve’s Jackson Hole event, where dovish rhetoric may temper real yields and lift risk assets such as Bitcoin. From which, BTC’s resilience bodes well on its liquidity-sensitive asset and emerging “digital gold” roles. Short term, additional ETF flows and active derivatives turnover—in quantities of above $12 billion—portend upside bias into the $120K–$125K area, where weak flows or higher-scale dollar activity can spur a retest of the $112K–$114K supporting region. At Zaye Capital Markets, we continue to monitor Bitcoin’s ecosystem near maturity, volatility tempering even at extreme levels, holding its position at the center of portfolio diversification within a policy and geopolitical uncertainty backdrop.
Eth Prices
Ethereum’s value is $4,212 today, retreated from its four-year weekly high of $4,475. Institutional inflows continue to be a driving force, with spot Ethereum EFTs experiencing record inflows—pacing last year’s total in six weeks. There has been significant accumulation, such as a whale and BitMine $882 million ETH purchase, which indicates optimism despite retail traders’ profit-taking. This demand has played a significant role in maintaining ETH stable, which has become the second-largest market-cap altcoin and one of the biggest centers of institutional adoption liquidity.
At the same time, profit-taking by the big players has also been pressuring near-term optimism. The “7 Siblings” whale cluster just sold 19,461 ETH (~$88 million) in 15 hours, and reports have the Ethereum Foundation, other whales, and hackers selling nearly $500 million of ETH last week. Those sales have been pressuring the pullback and providing liquidity risk, even with corporate adoption and ETF inflows remaining strong. At Zaye Capital Markets, we’re looking for a base at $4,000–$4,150, with continued inflows and accumulation providing a bullish potential of $4,400–$4,500. That, of course, is changed if selling pressure continues and ETH clearly breaks beneath support, sending the correction further into the $3,650–$3,750 range.
