Where Are Market Today?
U.S. stock futures are slightly higher, with Dow futures 0.1% (+50 points) higher and the S&P 500 and Nasdaq 100 futures around 0.1% higher. The announcement comes as the market anticipates hearing Federal Reserve Chairman Jerome Powell give his highly-anticipated speech at Jackson Hole, when the market anticipates him giving guidance of the policy direction through September. European futures are mostly unchanged, and STOXX 600 futures mirror the subdued mood in the region. The subdued mood reflects the fact that the investment community awaits the green light from the Fed to initiate new positions, due to the central role of the United States policy in the direction of global flow.
The US market’s optimism is fueled by speculation that Powell may suggest a rate cut in the month of September, although the officials of the Fed this month provided mixed commentary. The CME FedWatch tool still suggests a 75% chance of an end-quarter cut, but this has come off of higher readings over the past week as the economic data remains patchy. The futures are, for the time being, lifted by the newly emerged demand in the small-cap and value names, while the megacap tech, which has been under pressure of late, continues its rotation cycle. The European markets also show this prudent approach, as the futures hold steady ground waiting to see the tone of Powell before committing capital toward the risk assets. Two drivers are in contention this week. The first is signaling monetary policy, and Powell’s speech must reconcile evidence of growth slowing with continued concerns over inflation. Market participants are set either way: dovish suggestions would create risk appetite, and a slightly hawkish tone would put significant pressure on equities. The second driver is the macro environment, and weaker US housing and labor data are damping short-term euphoria while regional pockets of strength were revealed in the eurozone PMI readings. The differential between these variables keeps the futures in line, considering the risks and the potential of future policy resolution.
Here at Zaye Capital Markets, our day reading consists of patient strategy. The US futures are up and the European counterparts are stable, a reflection of the hesitation of the investors to over-extend before Powell’s speech. The mood is very sensitive to Fed direction: dovish rhetoric would witness a rate-sensitive rebound into property and into consumer discretionary likely while hawkish undertones cause defensive rotation into energy and industrials. Against this sensitive mood, Jackson Hole will be the pivotal catalyst to the direction of the market into September.
Index Performance Up to Friday, August 22, 2025 Key
- S&P 500: 4,952.11, declining 0.3%
- Nasdaq Composite: 17,482.92, down 0.5%
- Dow Jones Industrial Average: 41,128.47, unchanged on the day
- Russell 2000: 2,145.26, down 0.1%
The Seven Wonders and the S&P 500
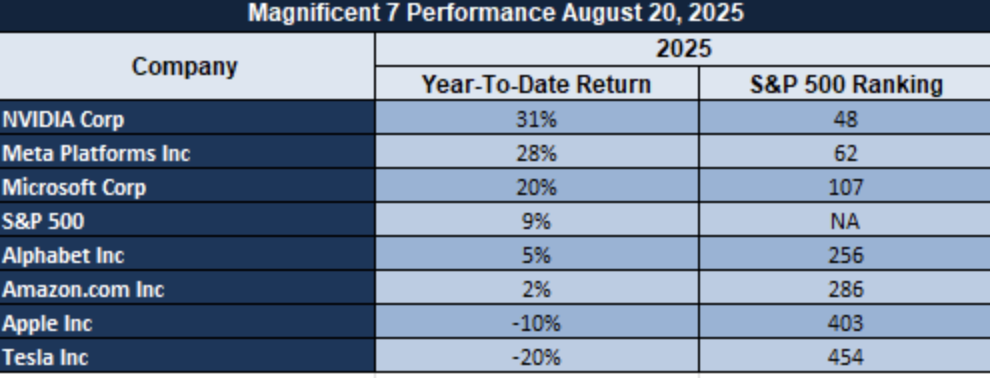
The “Magnificent Seven” of Apple, Microsoft, Nvidia, Amazon, Meta, Alphabet, and Tesla continued dragging the S&P 500 lower, and the group collectively averages a near 18% drawdown from recent highs. Tesla and Meta are hit the hardest, which highlights the speed of the reversal in sentiment for the growth trade. Energy and industrials provided some relief, but the S&P 500 can’t generate any momentum on its own without the mega-cap leaders’ comeback.
Drivers Behind the Market Move
The following are what are driving the U.S. and European markets nowadays, based on the latest updates:
1. Jackson Hole and Fed Policy Dominate Markets
The market is in suspended animation during the lead-in to the address by the US Fed Chair, Powell, to the Jackson Hole world symposium. The US and European futures are higher slightly as the market looks to draw fresh clues about interest rate policy. The economic figures yesterday presented an bitter pill-weakening labour data reduced the rate cut possibility-but market pricing remains consistent with a of about a 75% chance of a cut in September. The message from Powell today will be the biggest near-term equities and debt catalyst.
2. Political Pressure Adds to Market Jitters
President Trump’s recent demands for the resignation of Federal Reserve Governor Lisa Cook and continued pressure from the White House regarding the autonomy of the central bank are causing policy uncertainty. The increased volatility can break the confidence in a stable monetary course unless Powell strongly re-affirms the even-handed approach of the Fed.
3. Trade Tensions and Global Growth Signals
The market sentiment is also being affected by signs of uneven global growth and changing geopolitical conditions. European sentiment is recovering, buoyed by positive business trends in the key areas of the continent, but policy uncertainty and tighter-than-anticipated US inflation data are holding the near-term prospects of monetary ease in check. Also, fresh developments in US–EU trade policy are causing concern about re-emerging protectionism, which has the potential to act as a brake to global trade and impede cycle industries.
Digesting Economic Data
The Tweets of TRUMP and the Implications
Markets are acutely sensitive to what President Trump says, and his recent comments are continuing to stir waves through policy expectations, central bank credibility, and investor sentiment. His repeated demands for Federal Reserve Governor Lisa Cook to quit, and his threat to fire her for cause, are a personal political challenge to the central bank’s independence. If she quits, Trump would then have a majority of the Fed’s board, and future monetary policy would therefore effectively shift in the direction of his administration’s interests. Investors are already interpreting this as a possible bias towards more politically driven rate decisions, and concern about the future of the autonomy and direction of the Fed are the result.
Beyond monetary policy, Trump has amplified cultural and institutional confrontations, promising to expunge “woke influence” from federal agencies and delete Smithsonian content, along with end the White House tours in favor of an expensive Mar-a-Lago–style ballroom building. These actions are an extension of his larger task of rewriting the narrative of the government, but in the financial markets they highlight risks of poorly targeted federal expenditure and renewed division. Market actors are considering the ways in which cultural policy change might translate into pressures on consumer sentiment and discretionary consumption, especially in sectors related to public funding and federal contracts. In geopolitics and security, Trump’s declaration of patrolling Washington, D.C. step by step with the police and National Guard, and news of more than 630 federal crackdown arrests, introduces a firmer approach to issues of law and order. Even as stated in terms of restoring order, heightened domestic unrest introduces fears of a capital volatility and its ability to temper investor sentiment. Coupled with Trump’s incendiary rhetoric regarding the Russia-Ukraine war, during which Trump rebuked Biden for leaving Ukraine to fend for itself, the market seeks heightened geopolitical uncertainty, a phenomenon in the past which brings capital into defensive instruments such as gold and Treasuries.
Finally, his political and judicial triumphs, such as the overturning of his $464 million New York civil fraud penalty, and his threat to withhold funding from California school districts that resist his transgender decrees, both demonstrate his persistence and his willingness to use fiscal levers to advance political agendas. To the markets, they verify Trump as a disruptor force whose policies can remake the balance of state, federal, and company power—in ways that reshape the policy landscape less stable, and in which monetary autonomy, cultural expenditures, and geopolitical stability are all in jeopardy—scenarios that reinforce doubt but also create tactical opportunity in equities, bonds, and commodities.
Philadelphia Fed Prices Paid Index Captures Inflation Pressure Despite Soft Orders
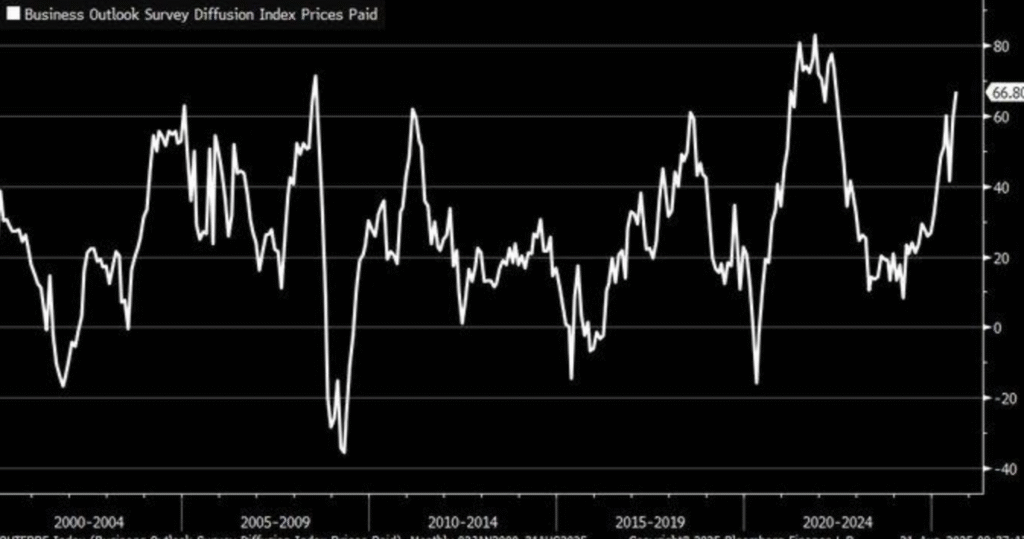
Philly Fed Prices Paid Diffusion Index decreased to -0.30 in August of 2025, from the previous month of 15.90, after having spiked sharply during this year. The index, while down of late, indicates high input costs in the US manufacturing space, and indicates inflation pressure despite broader measures of demand decelerating. The historic price spike through weaker orders goes against the classical narrative of demand-driven inflation and indicates structurally imbalanced circumstances.
For analysts, this discrepancy translates into having to pay close attention to supply-side pressures compared to demand. Rebounding shipping bottlenecks, increasing raw material costs, and persistent supply chains dislocations keep the input costs elevated. Industrials offers an under-owned area in this space, i.e., mid-cap producers with price disciplines and diversified supply bases. The investors have to wait until the next PPI reports and regional Fed surveys are in hand to confirm whether pressures persist or start gradually ease up.
In hindsight, steep peaks in the Prices Paid index were equally experienced prior to the 2008 financial crisis and equally so in the 2020 recovery, and both were followed by demand shocks. What we are experiencing today, however, is a structural cost environment, not cyclical recovery. This nuance implies that margin strength, not revenue growth, will be the discriminator. We think select industrial leaders and financials are undervalued opportunities, given market sentiment has reflected more risk of downside than today’s fundamentals warrant.
U.S. Existing Home Sales Increase More Than Forecast as Mortgage Rates Decline
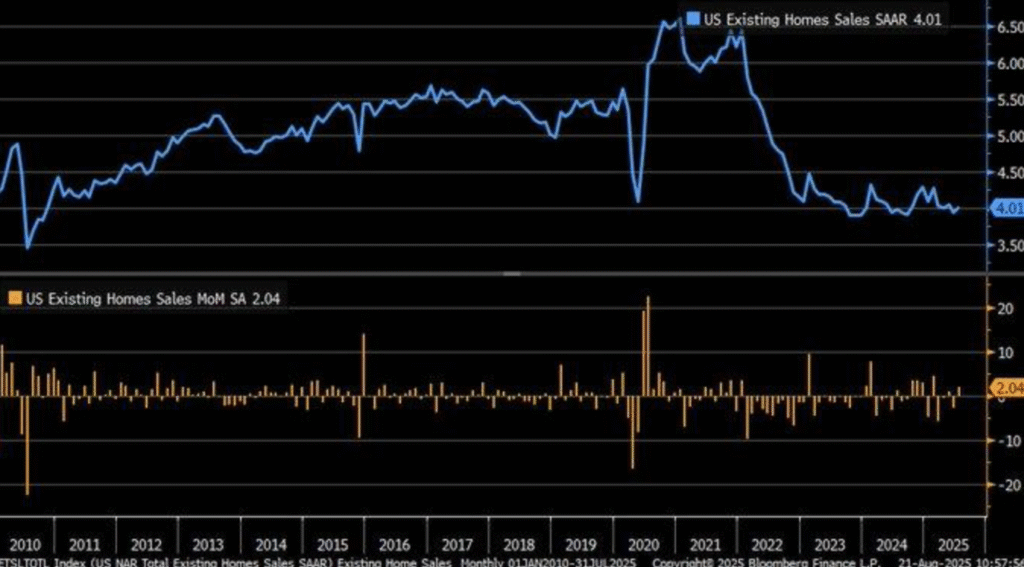
U.S. home sales of existing homes increased by 2% during the month of July 2025 to 4.01 million units, bettering the forecast of a decline and the quickest pace since early spring. The recovery saw mortgage rates drop to 6.72% and supply rise by a low 0.6% to 1.55 million units, the largest supply since May of the year 2020. The recovery indicates rate-sensitive buyers rebounding, spurred by slightly better availability but the affordability barrier persisting as the median home price averaged $422,400, a negligible 0.2% year-to-year advance — the weakest advance since the month of June of the year 2023.
For the analysts, robust pricing and improved sales is a delicate equation of recovering demand and ongoing supply woes. Though building inventory is some buffer, it lags behind the long-term July benchmark by 23%, and thus continues to pull at the affordability reins. Local conditions validate the equation, as wide Northeast, South, and Western gains are offset by Midwest losses. Spot recovery of this magnitude continues to peg performance from market to market by mortgage affordability and local supply woes. Real estate-sensitive equities, and homebuilders and suppliers in particular, are undervalued by their capability to absorb incremental inventory advances and catalyze acceleration of earnings. Historical context contributes to the relevance of this observation. Unlike the housing boom leading up to 2008, fueled by expansionary speculative credit and inevitably unsustainable, the current recovery is unfolding on tighter lending standards and reduced supply. Such a environment produces structural conditions in which small increases in inventory can disproportionately impact prices and activity. We believe analysts must remain sensitive to mortgage rate action and inventory trends as early leading indicators. The potential is present for homebuilders well-positioned to capture demand stabilization with cost control, creating undervalued entry points in a market where sentiment has been prone to lag fundamentals.
U.S. Leading Economic Index Indicated Further Weakness, Elevated 2026 Recession Probability

The United States Conference Board Leading Economic Index (LEI) declined 0.1% in July of 2025, as expected but the most recent of a sequence of declines in a downtrend since 2021. As a highly watched combination of ten leading indicators from building permits to stock prices, declining LEI is a sign of general economic weakness. The indicator has in the past predicted declines approximately seven months in advance, and the decline now suggests the likelihood of strain to accumulate via early the year 2026.
The LEI’s continued contraction satisfies the Conference Board’s “3Ds rule” — of breadth of weakness and velocity of decline consistent with early signs of recession, as in the run-up to 2008. The lesson is one of warning by analysts taking growth potential for granted. Aside from the statistics in the headlines, ongoing skepticism regarding official revisions to data merely serves to ramp up the necessity of confirmation by real-economy evidence. Increased bankruptcies by firms, credit pullback, and slowing consumer demand attest that cracks are spreading beyond financials. Cyclicals and financials, on the sidelines, are underpriced, and offer entry points by investors positioning themselves ante-policy offsets. Looking back, LEI has rarely persisted this long in the red without causing economic downturn. By comparison with the post-2020 recovery, when stimulus and liquidity covered up underlying weaknesses, the current downturn signal implies deeper issues — ranging from diminishing productivity growth to increasing debt carry costs. Equity strategists need to watch for increasing market dispersion in 2026, as defensive sectors will outperform and undervalued finance and some industrials will gain from any follow-on policy easing. The gradient of LEI falls and the credit space must be watched closely in measuring to what depth this signal is conveying recessionary risk.
U.S. Jobless Claims Rise Above Forecasts, Highlighting Labor Market Cooling
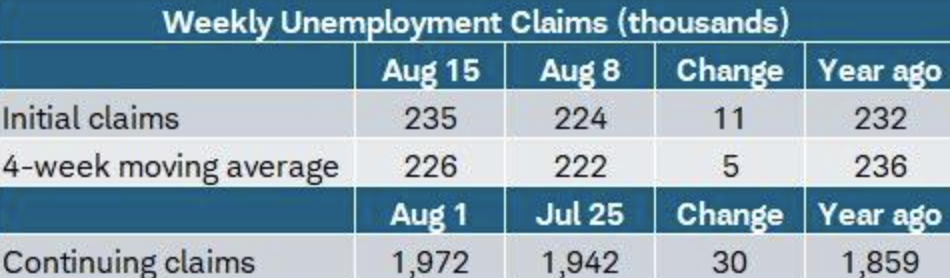
U.S. initial jobless claims increased to 235,000 during the week to August 15, 2025, from the predicted 225,000, and the 4-week moving average increased to 226,000. Continuing claims increased by 30,000 to 1.972 million, further evidence of long-term joblessness and not short-term dislocations. The persistent trend indicates a cooling labor market, which is beneficial to post-pandemic job recovery yielding to a softer, more structural adjustment phase.
Regional differences also mirror regional differences in the nation as a whole. The largest gainers in claims were Kentucky, Massachusetts, and Iowa, losing by California, Michigan, and Texas, and these are mirroring regional exposures of sectors — manufacturing and services — that are shaping labor market dynamics. For analysts, this implies a fascinating dichotoemy: national data obscure regional differences, which thus become vital by-sector and geography, and thus demands sector- and geography-driven analysis. Equity markets are slowly devaluing labor-intensive sectors, which are selling selective issues of the consumer discretionary as well as related staffing sectors to trade fundamentals at undervalued prices.
Historically, continuing claims advances tended to prelude persistent labor slow-downs, like leads into previous cycle downturns. The latest advance indicates firms are hesitant to re-hire as financials come into line and orders moderate. In our estimation, investors also must watch closely if jobless claims move beyond the line of 250,000, a barrier which tends to be associated with increasing recession risk. For the moment, the trend implies the labor market itself is shifting from strength into moderation, and from our standpoint, undervalued opportunities are developing through defensive industries better insulated from decelerations in hiring.
Nashville Leads America in Hotel Construction as Tourist Boom Fuels Hospitality Investment
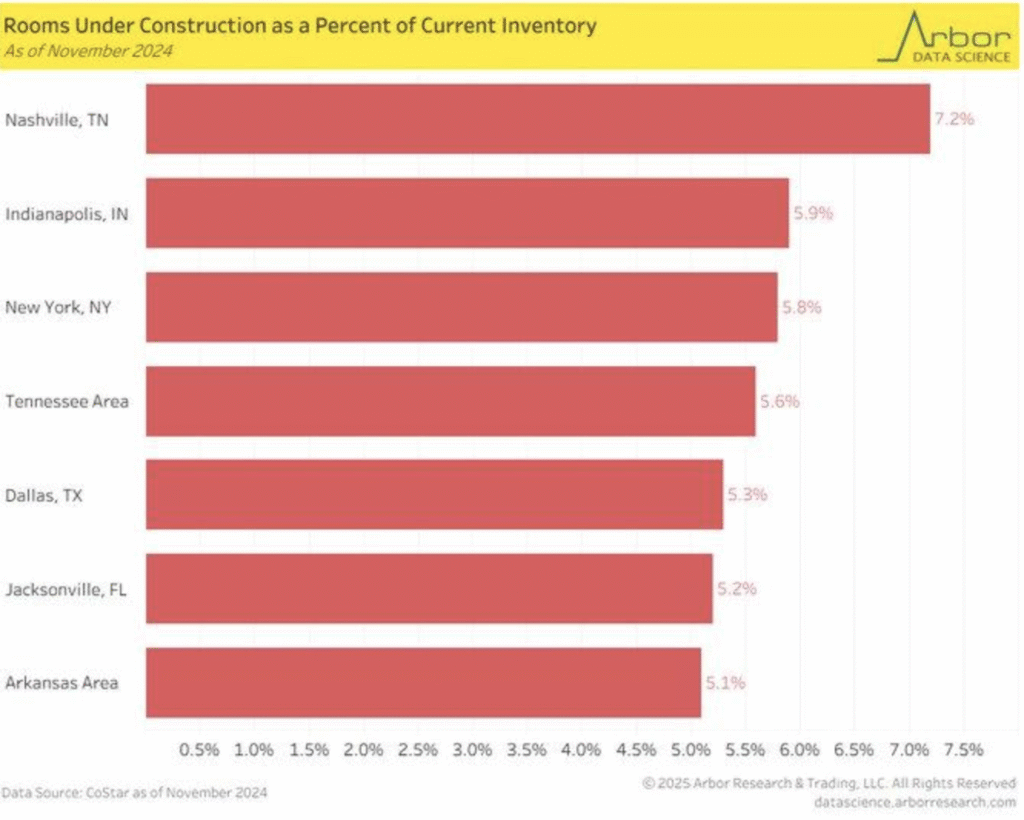
The development rate of hotels in Nashville stood at 7.2% up to November 2024, the largest of the major US cities, followed by Indianapolis by 5.8% and by New York by 5%. The boom verifies greater hospitality investing, fueled by a 14% boost in tourism during last year’s 2023. The growing entertainment and culture profile of the city, its music scene first of these, has created sustained demand for lodgings, causing developers to invest in new plans even as the business climate tightened up.
The trend indicates the aggregated U.S. hotel construction pipeline, which in mid-year 2024 hit its 16-month high, and exhibited consistently bullish sentiment. The cycle break of prudent spend yarns woven by analysts translates into evidence of the capability of select industries to come through even when the macro environment underperforms. Hospitality equities, such as hotel REITs and building-related entities, are reasonably valued compared to high-demand market growth potential. Money and RevPAR room tracking will be critical in deciphering whether this wave of investment, if any, translates into an earnings push.
Past history has seen cultural or entertainment-led urban growth also seeing disproportionate hotel capacity expansion. Nashville’s own experience is consistent, with activity in the building sector beating out national tendencies as builders were betting on long-duration demand resiliency wagers. Growth in this phase of expansion compares favorably to speculative previous-cycle overbuilds on the basis that it has a strong structural tourist growth foundation. We see hospitality real estate and certain construction-related equities as being undervalued, regional path divergence in performance creating opportunities for portfolio-specific exposures.
Capital Expenditure Outlook Stays Subdued Amid Inflation and Alternative Investment Strategies
Plans for capital spending are close to the pre-pandemic low, and this suggests business investment prudence. After recovering somewhat, companies are holding off until they can do larger projects like data centers and manufacturing re-openings, which suggests the appeal of high borrowing cost and lingering inflation. The prudence also suggests a general company policy of holding off until broad macroeconomic guidance becomes clearer, which is consistent with past episodes of monetary tightening.
One of the primary trends in the transitions of CapEx is the increased prominence of modular construction. Modular construction pre-assembles the units off-site and compiles them in site versus the traditional method, trimming build time by anywhere from 30–35% and cost. For an industry like data centers, speed-to-market being the name of the game, modular strategies possess cost-reducing efficiency savings commensurate to the focus on capital frugality. That, by itself, accounts for the modest increase in CapEx compared to the overall hesitancy, companies not wanting to spend money on cost-efficient solutions but not committing to outright expansion in infrastructure.
The effect of inflation is still the primary headwind to CapEx. Increasing costs of inputs — from raw materials to labor — increase the friction to a sufficiently high return on investment, and companies are less inclined to embark on ambitious initiatives. Funding costs are also a component of the friction, with debt-funded capital projects less appealing under contracted monetary environments. The primary observation for analysts to keep in mind is that underappreciated opportunities lie in the spaces redefining under this regime — i.e., the industrial companies adopting modularization and the technology vendors facilitating efficiency-driven investment. Watching inflation and credit conditions will be essential in assessing when normalized growth of CapEx will return.
Redbook Index Bounces Back Strongly, Provides Early Consumer Confidence Indication
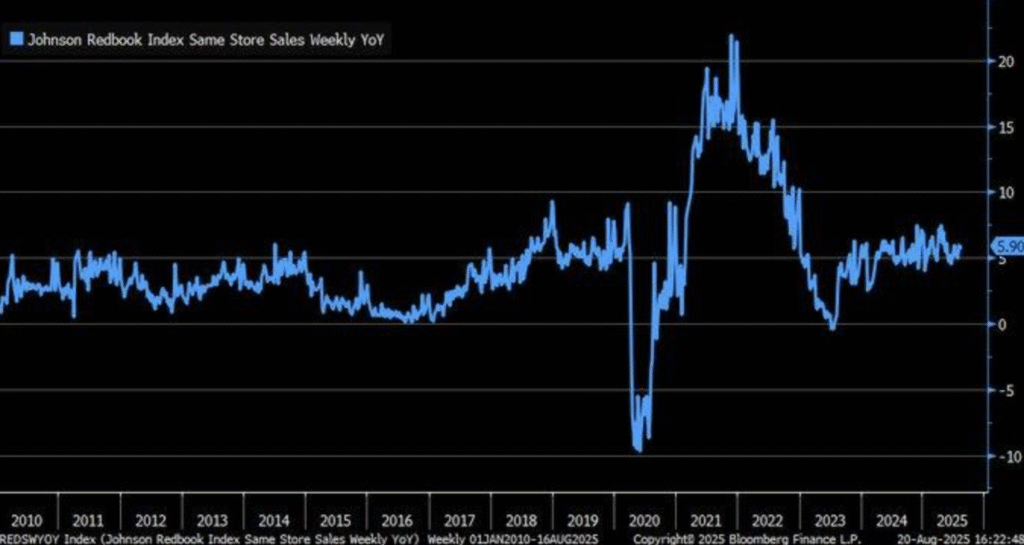
Johnson Redbook Index of same-store retail sales surged to +5.9% year/year the week of mid-August 2025, an immediate rebound from 2022 losses. The acceleration is the sign of the return of consumers’ vigor, spearheaded by the chains store segment, and is a sign of the presence of underlying demand strength despite the skepticism about the economy. For the sake of reference, the official July retail sales reported a relatively muted 0.5% month-to-month as well as 3.9% year/year gain, supporting Redbook Index’s propensity to report swifter swings of consumers.
The difference between Redbook and Census Bureau statistics is the same-store indexes giving a lead indicator reading of consumer sentiment. More discretionary expenditure via chain stores is reassurance as entire retail segments are battered by the pressures of inflation and credit constriction. Retail equities are, via the mid-cap discretionary universe, undervalued compared to this pick-up in pace in sales. Tracking Redbook and core data will be instrumental in determining whether the consumer demand is strengthening or if pressures on households’ balance sheets can continue to dampen larger retail contributions.
Traditionally, same-store sale indices provided shorter leads of the direction consumers were taking than aggregative series did. Evidence indicates they are better lead indicators of confidence reversals of recovery or recession, and the bounce of the last couple of months is no exception, and this in our view suggests greater intrinsic strength of consumer confidence than the media are portraying. We believe this presents opportunities to the investor in underpriced retail and consumer discretionary shares which possess strong brands and supply chains capable of meeting the ongoing global shocks.
U.S. Real Interest Rates Higher than Global Peers, Indicating Policy Differences
Since December 2024, the U.S. Federal Reserve’s real interest rate has been steady at 1.8%, the biggest among any of the major advanced economies. While central banks across the world reduced rates by as much as 250 basis points, the reluctance of the Fed to do so represents a sign of peculiar domestic inflation dynamics. The divergence signifies the Fed’s caution, with the sense of greater ingrained inflation in the United States relative to peers. To markets, it will be a widening policy divergence, which will have implications beyond U.S. shores.
Historically, US real rates seldom deviated from peers by such amounts. The last such episode was in the early 1980s, when Volcker’s sharp policy correction restrained inflation only to initiate a global slowdown. The present episode is larger in size but no less dangerous: the comparatively tighter US financial conditions relative to the world can attract capital inflows, weaken the dollar, and expose weakness in the external debt markets. For analysts, this divergence renders the emerging markets exceptionally vulnerable to US policy complacency.
Data points rate differentials fund cross-border capital flows most often, supporting the U.S. dollar and hurting economies with foreign-currency denominated liabilities. The same dynamic operated in the 2013 “Taper Tantrum,” when the emerging world was shaken by surprise currency depreciations. In our opinion, undervalued plays are the U.S. financials and dollar-strength beneficiaries such as exporters, while debt-exposed emerging market-oriented companies are best addressed with caution by the investor. The key watchpoint here will be whether the higher-for-longer policy of the Fed continues past 2026, and therefore continues to fuel global imbalances.
Brent Crude Falls Steeply, Signaling the Shift in Geopolitics and Directions of Supply
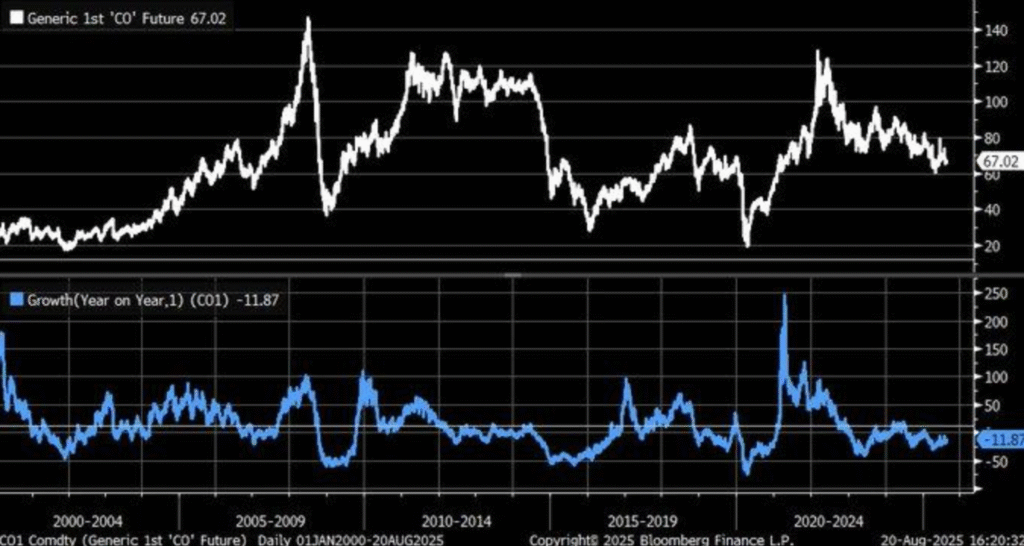
Prices of Brent crude oil retreated near 12% year-to-date by August 21, 2025, a significant deviation from the 2000–2025 mean. The decline signals a convergence of judicious supply adjustments and softer global demand, and whether this signals the start of the cooling-off of the cycle of the commodity, is questionable. The decline goes contrary to generalized pressures of inflation elsewhere in the economy, and this facet defines the complexity of the macroeconomic environment in the present age.
Geopolitics are in focus with this development. World leader diplomacies in Alaska, which are directed at de-escalating tensions in Eastern Europe, have soothed risk premia in the energy sector. Oil, traditionally, calms after significant diplomatic breakthroughs, and price action now indicates the trade hopes to cut volatility by pre-positioning. For analysts, this equation means a twin-barbed market — pressure on the producers, but possible buoyancy in fuel-starved sectors whose margin sensitivity is in the sphere of fuel inputs. Energy stocks with robust Balance Sheets now appear undervalued, especially those which benefit from diversified exposure in the upstream and downstream segment.
While crude decreases, the cost of petrol in the UK stays stubbornly high, the result of the high taxes of 43–44% and mediocre pass-on to the end-user. The gap exists owing to the existence of structural price stickiness of the areas of fiscal policy and retail practice which dampen the influences of falling global references. The competitors are likely to respond to both geopolitical agitation and refining margins, as they will set the cut costs of price viability. The underappreciated areas of potential are being revealed in world transportation and manufacturing sectors which will enjoy low input costs despite the adaptations of the energy producers to low references.
Mortgage Purchase Index Falls, and Early Warning Signs are Raised About Growth and Housing
MBA Mortgage Purchase Index falls resolutely from 2022 and below pre-pandemic levels, indicating a categorical US residential demand slowdown. Higher cost of borrowing, which trapped the Federal Reserve in the 5.25–5.5% bracket, are keeping affordability in a tight spot and scaring new entrants. The fall is contrary to a context in the rest of the world, where lower borrowing costs are poised to push lending upwards, highlighting the US market’s hyper-sensitivity to monetary policy development.
Deceleration describes a lag response as high speeds course through mortgage-backed security and housing-related credit conduits. Worries about future policy change by investors have probably increased the pull-back, skepticism about fiscal direction keeping pressure on credit spreads. Analysts’ trend implies the importance of keeping tabs on housing gauges both as proxy sentiment of the consumer as well as the ultimate predictor of the overall economic cycles. Home builders and mortgage originators seem bargain-tinted this cycle, but the earnings momentum comes late when the cut comes through in the rates.
Historically, mortgage application drops have precipitated economic downturns, according to academic studies that linked housing credit conditions to recession. The drop measures more than cyclical weakness: It measures structural weakness in the relationship between housing and finance. We believe the sector warrants close watching in the coming months. Undervalued opportunities can emerge in diversified financials and well-positioned homebuilders with solid balance sheets, poised to rebound when policy conditions eventually begin to unwind. Meanwhile, housing data still remains an early recession watchpoint for 2025–2026.
Hotel Occupancy Rises Towards Pre-Pandemic Levels, Indicating Hospitality Sector Resilience
US hotel occupancy recovered the pre-pandemic levels of 43.9% in 2020 to an estimated 63.4% at the end of 2025, near the rates of 65.9% last seen in 2019. The continued increase indicates strong recovery of demand as the restrictions are lifted and postponed consumer spend keeps the bookings up. The resilience of the industry challenges pre-pandemic predictions of ongoing decline, rather highlighting the way in which the tourism and business travel are adjusting to the new balance.
Trends in funding imply structural transformation driving the recovery. Mid-week stays are boosted by the emergence of hybrid work habits, while intraassay travel during staycation has shielded slow international pick-ups. They provide revenue visibility to operators, especially at resort and urban sites. In hotel-oriented REITs and service providers, the segment constitutes underpriced opportunity, ignored by the market until occupancy-driven margin expansion, from analysts’ perspectives. Continued surveillance of RevPAR and advance bookings shall be critical to the recovery’s sustainability.
The recovery also depends on the world tourism recovery, which regained 98% of the pre-pandemic level of 2019 by 2024. The wide regional variations still persist, but the overall trend is towards a robust travel economy though with cost and sustainability challenges. In contrast to the past cycles, the hospitality recovery of the decade has leisure and business travel driving it, which provides a firmer revenue base. To us, the sector provides a structural winner in changing work and travel habits and under-the-radar names provide an upside as occupancy nears pre-crisis levels.
IPO Market Rebounds to Pre-Pandemic Levels, Showing Cautious Optimism
US IPO activity in 2024 came close to pre-pandemic 10-year average of $30.9 billion, indicating a bounce back from the deep post-pandemic decline of 2020–2022 when uncertainty and subdued investor sentiment damped listings. The recovery indicates a pick-up in risk appetite, with issuers returning to equity markets against the backdrop of tighter monetary conditions. Excluding SPACs, closed-end funds, and REITs, the figures still represent robust underlying momentum, indicating recovered resilience in capital formation.
Latest reports indicate a change in deal structure, with Q2 2025 IPO issuance rising 16% year-o-year but total proceeds decreasing 20%. The bifurcation indicates a market leaning towards smaller and specialist issues compared to blockbuster issues, employing a wait and see strategy after investor wariness and issuer sentiment toward incremental capital raisings. For analysts, the strategy is selective optimism — businesses are feeling their way, but valuation sensitivity remains where tariff threats and volatility are involved. Opportunities are being underestimated in mid-cap growth names, most of which are listing at discounted valuations to long-term potential.
Historically, IPO activity has mirrored broad economic health and decreased when growth prospects hardened up. Such acceleration of activity now is similar, but the less extensive volume of deals maintains the optimism in check by skepticism. Unlike earlier euphoria manias, the activity now offers a healthier, more disciplined atmosphere, from which ongoing equity market gain can follow. From our vantage, buyers are likely studying IPO lines very carefully, as underpriced new issues in the tech and health-care industries can mobilize disproportionate returns once sentiment overall improves.
Business Inflation Expectations Ease Sharply, Signaling Cooling Pressures
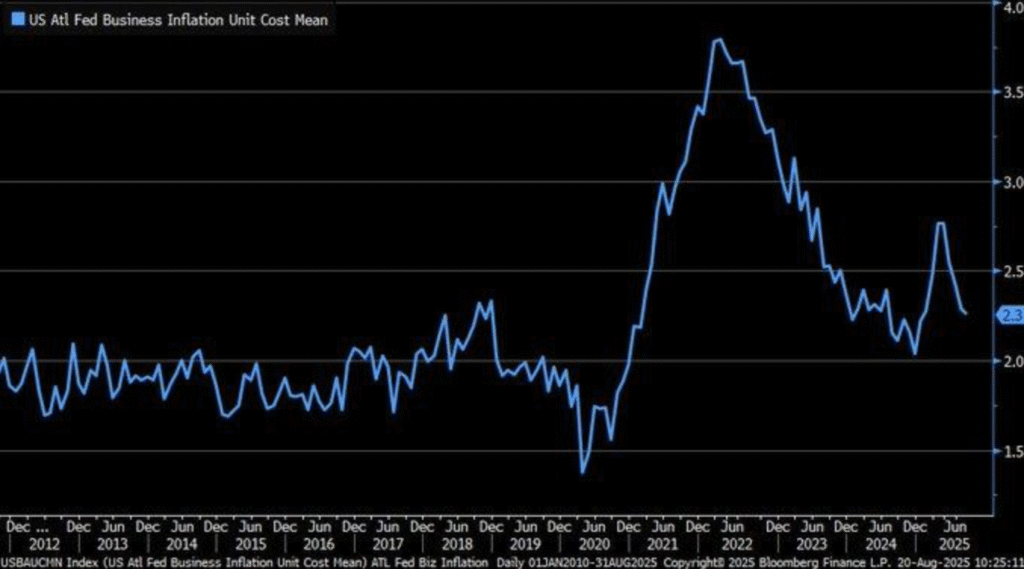
Atlanta Fed’s Business Inflation Expectations survey dipped to 2.3% during August 2025 from recent highs of nearly 4% during this cycle. The precipitous drop indicates businesses now anticipate less-tight price pressures, a strong contrast after recent adjustments to official economic data drew into question their credibility. The forward-looking aspect of the survey matters most, these readings in the past having looked forward and forecast CPI trend directional changes, consistently predicting inflection points in the inflation cycle before the headlines’ confirmation.
To observers, the decline in expectations reduces pressure away from hawkish monetary policy and opens room for shift toward more even keel by the Federal Reserve. A steady reading at or below 2% would indicate business opinion of prospects for inflation to be largely in check and could reinforce financial conditions and support rate-sensitive sectors. Industrials and rate-sensitive consumer discretionary stocks are undervalued in this environment, and specifically those with price flexibility and strong demand profiles.
Previously, comparable magnitude decreases of business surveys of inflation preceded sluggish pace of the economy, which fueled decelerating growth concerns while pressures upon the inflation are reduced. The investor challenge lies in distinguishing softer inflation from questioned gauges’ quality, while the political row regarding the statistics departments obscures the faith in the official readings. In our view, value opportunities of the equities benefiting from the lower rate do materialize, but the market sentiment will be dependent upon the survey-based leads being vindicated in the hard data in the forthcoming months.
Future Economic Directions
Fed Chair Powell speaks, President Trump speaks
Markets are set to embark on a critical week during which political signaling and policy guidance will set the risk tone. The question that speeches from both the Fed Chair Powell and US President Trump imply investors are preparing for direction shifts by asset class to the interplay, or lack thereof, of their respective signals, highlights the critical nature of the speeches since monetary and fiscal tales are converging as the rate of inflation decelerates, the rate of growth continues the deceleration, and capital flows internationally continue to be highly sensitive to change in US policy.
Fed Chair Powell speaks
Powell’s words will be monitored for any deviation from the current “higher-for-longer” Fed mantra.
- If his words turn hawkish before expected—highlighting ongoing inflation risks, strong labor markets, or the need to keep policy uncomfortably firm—the knee-jerk response will be swift: equities will experience widespread selling, Treasury yields will rise, and the dollar would gain as foreign investors reshuffle into United States assets. Defensive equity sectors such as healthcare and utilities can be expected to sparkle in these circumstances, while rate-sensitive groups such as technology, real estate, and consumer discretionary will experience selling pressure.
- If Powell speaks dovish, which means acknowledging softer prints of inflation, softer job growth, or policy accommodation, the markets will immediately price in prior rate cuts. The latter would cause the risk-assets rally, flatten the yields, and break the buck. The best-positioned assets would be high-duration issues in the form of growth equities and homebuilders specifically. The analysts also need to watch the financials: declining interest rates could flatten the yield curve, and this could loosen the banking space after quarters of margin squeezes.
President Trump Speaks
The president’s rhetoric also holds similar market-sensitive potential, and this is mainly in the area of influencing sentiments about trade, taxes, and growth policy.
- In the event his language is tougher than anticipated—more tariffs, greater regulation, or fiscal austerity of an aggressive nature—markets might sell off in risk aversion mode. Stocks might fall, the dollar may gain on safe-haven demand, and export-sensitive shares would likely underperform. Energy and commodities may also experience volatility, as talk of tariffs usually translates into supply chain nervousness globally.
- If his rhetoric is softer than expected—in signaling reduced trade tension, detailing new plans for tax relief, or highlighting pro-growth policy—relief bounces in the market are possible. Industrials and export-sensitive shares will like softer threat of tariff, fiscal boost signaling shares may gain, and financials will benefit if growth prospects are enhanced. Importantly, if pressure by Trump on the Fed to raise ease becomes stronger, the move will be considered by the market as policy convergence episode, and this will buoy bull sentiment in equities and commodities globally.
Main Point
The Powell and Trump speeches combined are an unusual twin test of markets: the first of monetary leadership, the second of fiscal and political leadership. If both are hawkish, risk-off sentiment can be the result with equities lower and yields higher. If both are dovish, the global relief rebound can occur through markets as a whole. But if their subtleties are mixed—Powell dovish, Trump pro-growth—the latter can result in higher volatility as sectors move sharply as the investor community wrestles to price the balance of risks.
Stock Market Performance
Indexes bounce back from April lows, but breadth remains weak
U.S. indexes recovered spectacularly from the low of April 8, and key indices held up robustly in all directions. Performance this year so far is robust, but the underpinning of the rally in the understructure is uneven engagement. Large-cap leadership of the overall sentiment of the market is upbeat, but constituent-level drawdowns are vulnerable below, which serves as a reminder volatility still resides in market infrastructure.
Our greater detail on recent performance by major indexes is as follows:
S&P 500: Large-Caps Keep Making Headline Moves
YTD: +9% | -28% below Apr low | -19% from YTD peak | Avg. member: -25%
The 9% YTD gain and 28% bounce off April lows of S&P 500 is a testament to the strength of United States’ mega-caps, particularly the most transparent earnings business, but the drop from YTD high by 19% and mean-member losses by 25% proves the rally still thinly dependent. Such lopsidedness proves the investor’s worldwide dependence on a select group of mega-cap leaders, with the majority of the stocks struggling with leaner finances and lesser earnings growth.
NASDAQ: Tech-Driven Mania Conceals Secret
YTD: +10% | -39% from April low | -24% from YTD high | Avg. member: -47%
The NASDAQ has led, up 10% this year and a whopping 39% from April lows. The index, however, still trades 24% below the high and the rally remains overwhelmingly one-sided, as the average member gain of only 47%. The mega-cap techs are propping the index up, and the small growth issues are still getting pounded, which only serves to illustrate just how one-sided the recovery is. This kind of vulnerability leads one to wonder about the staying power of the gain if leadership stays concentrated or sentiment towards high growth areas shifts.
Russell 2000: Small-Caps Lack Conviction
YTD: +2% | -29% lower than April’s low | -24% from YTD high | Avg. member: -38% The small-caps rebounded 29% from the April low, but the Russell 2000 has rebounded just 2% year-to-date, which attests to damped investor sentiment. A 24% YTD peak correction and a 38% average member depreciation are evidence of the funding pressure, damped demand, and macro sensitivities small firms are undergoing. Market players are not yet ready to grab a sustainable small-cap upcycle until they receive better signals of enhanced credit availability and enhanced economic traction.
Dow Jones: Defensive Bias Offers Stability
YTD: +6% | -19% below April low | -16% below YTD high | Avg. member: -23% The Dow Jones has produced tame returns, rising 6% on the year and 19% since April, and defensive weighting providing cover compared to other indexes. A 16% pullback from peaks is shallow by historical standards, with strength in value-driven areas like healthcare, staples, and industrials. But mean-member declines of 23% still mark underlying tension, even in so-called safe-haven sectors, evidencing defensive coverage not immune to volatility.
While the rebound is welcome, we also remain cautious here at Zaye Capital Markets. The ongoing difference between index-level strength and member-level weakness adds credence to the view that breadth in the market remains to recover. We continue to favor good balance-sheet names, defensive earnings profiles, and pricing power, and remain interested in breadth, as that will be a necessary measure of whether or not this rally is being supported.
Strongest Sector in All These Indices
U.S. equity sector performance remains a gauge of divergence between long-term leadership and short-term changes in momentum. Cyclicals and growth-oriented sectors are best contributors to index performance so far this year, while the defensives are lifted by recent month-to-date flows. The divide is a reflex of the market offsetting sentiment about growth optimism versus caution regarding near-term risk.
Industrials and Communications Services Sector Leads YTD
The Industrials and Communications Services lead the table so far this year in 2025, both yielding +14.6% year-to-date returns. The leadership is a vote of confidence in the cycle of revenue growth driven by infrastructure investment and strong communications platform investment. The former group, though, dropped -0.6% and the latter +1.3% this month, and both are showing some rotation from the cyclicals of recent periods.
Utilities and Information Technology Secure Strong Positions
Utilities are +13.3% year-to-date because of defensive purchases and solid cash flows, although their month-to-date return is only +0.2%. Information Technology is still in front at +12.6% year-to-date, but the industry dropped -0.6% month-to-date, which is indicative of profit-taking as investors recalculate valuations. The two sectors represent the contrast between long-term sustainability and short-term adjustment.
Health Care and Consumer Staples Lead Month-to-Date Gains
While softer year-to-date (-0.2% Health Care and +7.4% Consumer Staples), the defensive sectors of the market are the undisputed month-to-date leaders. Health Care rose by +5.4% and Consumer Staples by +4.8%, and this implies they are running from macro uncertainty. The defensive rotation here being a warning sign despite the cycle sectors of the market, by a long shot, still leading year-to-date in performance.
We select Industrials and Communication Services as end of year winners of 2025 in the Zaye Capital Markets, crediting the sentiment of the market being positive about the defensives like Consumer Staples and Health Care. Such dichotomy fulfills the need of selectivity—in finding a balance between the long-term growth plays and the short-term stable plays.
Earnings
Earning Preview — August 21, 2025
- Walmart Inc.
Walmart delivered another strong quarter on the top line with $177.4 billion in revenue, exceeding expectations of $175.9B. Same-store sales climbed 4.6% YoY, fueled by continued grocery dominance and a surge in e-commerce — U.S. online sales rose 26%, while international grew 25%. These figures confirm Walmart’s ability to capture consumer demand despite inflationary pressures. However, adjusted EPS of $0.68 fell short of the $0.73 consensus, reflecting higher tariff-related costs and compressed margins. Net income declined more than 40%, reminding investors that revenue growth is not translating cleanly into profitability. Walmart raised full-year revenue guidance to 3.75–4.75% and boosted EPS outlook to $2.35–$2.62, signaling confidence in underlying demand. For investors, the takeaway is clear: Walmart remains a market share winner, but margin pressures tied to trade policy must be monitored closely.
- Intuit Inc.
Intuit’s results reflected strong momentum in digital accounting and tax services, but its 14–15% revenue growth guidance for fiscal Q1 2026 came in shy of consensus. Shares dropped about 6% in after-hours trading, showing how sensitive investors remain to growth expectations in the tech sector. The cautious outlook implies small-business demand may be moderating as financing conditions tighten. Analysts will focus on customer retention, AI-driven product adoption, and expense management as key levers for sustaining growth.
- Workday, Inc.
Workday posted Q2 revenue of $2.35 billion, up 13% YoY and modestly ahead of estimates. Subscription revenue growth remained healthy, underscoring ongoing enterprise adoption of HR and financial software solutions. However, the stock slipped ~4–5% post-release as management’s commentary suggested a more tempered demand environment ahead. For investors, this highlights that while Workday continues to expand its cloud footprint, macro headwinds in enterprise IT spending could cap near-term upside.
- Ross Stores, Inc.
Ross Stores delivered a better-than-expected quarter, driven by early back-to-school spending that boosted comparable sales. Investors rewarded the discount retailer, sending shares 2–3% higher after hours. The results highlight the defensive appeal of off-price retail during uncertain times, as consumers trade down but maintain spending momentum. Margin management and inventory discipline will remain key watchpoints, but Ross reinforced its positioning as a resilient name in consumer discretionary retail.
- Zoom Communications, Inc.
Zoom surprised positively with revenue and EPS above consensus and raised its full-year guidance. Shares climbed ~6%, reflecting renewed investor confidence. The company continues to benefit from hybrid work adoption, expanding its enterprise customer base, and strengthening margins through cost efficiency. While growth is slower than during the pandemic peak, Zoom’s ability to generate consistent profitability and broaden its platform offering makes it an attractive play in the tech communication space.
Earning Preview — August 22, 2025
- Didi Global Inc. ADR
Didi is set to release results today, with investors focusing on mobility demand recovery in China. Key areas of interest will be active user growth, gross transaction volume, and commentary on regulatory developments that have constrained the company since 2021. Any signs of stabilization in profitability or easing of government scrutiny could be positive catalysts, but risks remain elevated given the competitive landscape and macro softness in China.
- Ubiquiti Inc.
Ubiquiti’s earnings, expected later today, will give insight into global enterprise networking demand. With corporates balancing hybrid work infrastructure against tighter budgets, investors will watch closely for order growth, backlog levels, and supply chain commentary. Gross margin resilience and forward-looking guidance on demand for Wi-Fi and data networking products will be key factors in determining sentiment.
- BJ’s Wholesale Club Holdings, Inc.
BJ’s reports before the market open, with consensus calling for EPS of $1.10 (+0.9% YoY) on $5.46 billion revenue (+4.9% YoY). Membership growth and comparable club sales will be the top metrics, alongside insight into how inflationary pressures are influencing consumer basket mix. BJ’s has historically been resilient in downturns due to its value proposition, so any upside in digital adoption and new member retention could support stock performance. Investors should also monitor margins closely, as wholesale clubs have been navigating cost pressures in supply and logistics.
- Buckle, Inc. (The)
Buckle is scheduled to report earnings later today, with the retail sector watching closely for indicators of consumer discretionary health. Inventory management, promotional activity, and forward guidance will be critical in assessing resilience. As a mall-based apparel retailer, Buckle is sensitive to consumer confidence and discretionary spending trends. Strong results could signal improving apparel demand, while weaker performance may highlight continued strain on middle-income consumers.
Stock Market Analysis – Friday, August 22, 2025
U.S. equities closed lower for the week in the face of selling as mega-cap tech shares experienced profit-taking from fund managers. The S&P 500 experienced its biggest weekly losing streak since the start of January, and the Nasdaq underperformed due to tech vulnerability. The Dow Jones exhibited relative strength, headed by energy and financials, while small caps in the Russell 2000 were in rangebound action.
Stock Prices
Economic Indicators and Geopolitical Developments
Markets are expecting important policy direction entering Powell’s speech, the Federal Reserve Chair. Treasury yields rose modestly, which was evidence of concerns the Fed would keep rates “higher for longer” even with softer evidence of pressure from inflation. President Trump’s recent comments on trade tensions from Europe fueled panic among investors, and renewed threats of the imposition of tariffs raised the specter of supply chains being disrupted. In general, these contributed to the pressure on growth-sensitive areas and risk aversion over the weekend.
Recent Stock News
- Broad Technology Rotation
The Nasdaq drops are tied to fresh selling in mega-cap growth stocks. Among the most closely watched mega-cap growth ETFs, one fell more than 3.5% for the week, a decline after almost a year of strong performance. Analysts point to overextended valuation and the risk of slowing AI monetization as the cause of the correction.
- Retail Resilience
On the positive side, US retail earnings were strong, with Walmart surpassing revenue expectations and Ross Stores also noting that back-to-school orders were good. Those results did lift consumer discretionary optimism even as increasing input costs weighed on margins.
The Seven Wonders and the S&P 500
The “Magnificent Seven” of Apple, Microsoft, Nvidia, Amazon, Meta, Alphabet, and Tesla continued dragging the S&P 500 lower, and the group collectively averages a near 18% drawdown from recent highs. Tesla and Meta are hit the hardest, which highlights the speed of the reversal in sentiment for the growth trade. Energy and industrials provided some relief, but the S&P 500 can’t generate any momentum on its own without the mega-cap leaders’ comeback.
Index Performance Up to Friday, August 22, 2025 Key
- S&P 500: 4,952.11, declining 0.3%
- Nasdaq Composite: 17,482.92, down 0.5%
- Dow Jones Industrial Average: 41,128.47, unchanged on the day
- Russell 2000: 2,145.26, down 0.1%
Here at Zaye Capital Markets, we view this pullback as a long-awaited correction as investors are diversifying away from concentrated positions in tech. Market breadth will be in the spotlight heading into September, and Powell rhetoric and tariff fears will drive near-term bias.
Gold Price
Gold held steady above $3,335 an ounce last Friday, August 22, 2025, amidst increased financial market volatility. US President Trump’s recent comments, including his threat of sacking US Federal Reserve Governor Lisa Cook, his remarks about the Russia-Ukraine war, and fresh concerns about central bank autonomy are adding politics uncertainty. These are the conditions likely to boost gold’s safe-haven appeal, with money managers seeking refuge from possible future volatility in monetary policy and geopolitical affairs. Furthermore, speculations about an American reevaluation of gold reserves are supporting the long-term bullish undercurrents behind the precious metal.
The yesterday’s economic data provided a mixed backdrop as jobless claims increased to a three-month high, a gauge of slumping labor momentum, while the inflation rate continues above the Fed’s 2% target. The investor skepticism about the possibility of the cut of the interest rate by the Fed in the near term, and the expectation of Chair Powell’s speech later this afternoon, sent the yellow metal to a support above the $3,300 line, fueled by the safe-haven inflows but capped by dovish rhetoric of the Fed. In our view from Zaye Capital Markets, the yellow metal remains an integral hedge in portfolios, and may rise if tensions regarding politics or the economy rise.
Oil Prices
The price of oil is $63.50 a barrel and Brent $67.54 a barrel as of August 22, 2025, end of week. The price of oil stabilizes after two weeks of decline, buoyed by a larger-than-awaited United States crude draw of about 6 million barrels, but capped by concern the supply will engulf the demand over the year of 2026. The IEA and the OPEC anticipate an even-bulging future market, and the acceleration of output growth drowns the consumption trend. The geopolitical risk of the war of Ukraine continues to carry a small premium, while the techs monitor resistance about $68 the Brent contract and support about $66. The market, here, remains stuck in a tug-of-war between short-term supply snugness and long-term supply expectation excess.
President Trump’s recent remarks bring in volatility once again, and not least his invoking weak energy prices as leverage when negotiating with Russia, welcomed by the investor community as proof of policy embracing lower oil levels. The more subdued US labour data yesterday re-asserted fear of weakening demand, tempering crude’s upside, while today’s upcoming remarks by Fed Chair Powell are pivotal – any suggestion of long-term high rates would intensify the calls for weakening demand, while a dovish bias could take the bear pressure off. Oil is not only sensitive to the unfolding geopolitics, though, but also to changing central bank mood, and hence also serves as a proxy for both global macroeconomic mood and risk appetite.
Bitcoin Prices
The coin is trading at $113,284 by end of Friday, August 22, 2025, after correction from the August high of more than $124,000. Correction aside, Bernstein analysts predict that the bull cycle will rise to 2027 and see targets in the range of $150,000–$200,000, spurred by institutional flows, growing regulatory clarity, and directionality towards global adoption. Recent events show increasing volatility around the options expiry later this week on Deribit of $3.8 billion, expanding short-term oscillations as the market rebalances ahead of the Jackson Hole symposium.
Broader sentiment is still cautiously optimistic, and high-net-worth Asian funds and US institutions are incrementally adding exposures, a reflection of the health of the ecosystem even as stresses build near term.
Political risk is giving Bitcoin’s appeal an additional dimension. President Trump’s comments regarding firing of Fed Governor Lisa Cook and reshaping of the central bank are giving policy independence concerns, backing Bitcoin as a hedge against volatility of the institutions. Disappointing labor data yesterday sent the message of slowing pace from the US economy, which chilled the risk appetite, but also supported the narrative of softer monetary conditions in the future. The market is now anticipating the response of the Fed Chair Powell today: a dovish remark will provide the last crypto buys, while a hawkish reaction may keep the price contained. The experts from Zaye Capital Markets’ team believe that the recent consolidation of Bitcoin in the $113,000 area shows the game of the balance between the safe-haven interest, macro unfavorables, and the anticipation of near policy change.
ETH Price
Ethereum trades at $4,293.76, which holds its ground after recent volatility which kept the spot price in the $4,200–$4,300 range. Institutional positioning does count, and spot Ethereum ETFs experienced one of the largest this-month withdrawals of close to $422 million, which suggests short-term prudence. But, this follows the backdrop of prior inflows and continued structural demand, so it’s a reevaluation of the timing and not an abandonment of the ETH exposure in full.
At the same time, whale action is concentrating into an influential counterbalancing force. One of the largest Bitcoin whales just swapped nearly $76 million of BTC essentially, trading it for 68,130 ETH, while holding long positions leveraged about $4,300. Moreover, new whale addresses summed up nearly $200 million of ETH cumulatively, solidifying faith in the long-term trajectory of Ethereum. Such a whale purchase strategy implies regardless of short-term pressure potentially induced by institutional ETF flows, high-net-worth individuals are taking accumulation positions anticipating higher values. In general, the dynamics of strategic allocations of ETFs and whale accumulation position Ethereum to be volatile in the short term but founded in strong underlying demand.
