Where Are Markets Today?
The U.S. equity futures started the week around the flatline to indicate restraint from investors after last week’s rally into record territory. Dow-linked futures slid 0.12%, S&P 500 futures down 0.09%, and Nasdaq 100 futures down 0.1%. That came after the Dow jumped 846 points the previous day to an all-time 45,632 finish, the S&P 500 finish just shy of a record top level, and the Nasdaq finish solidly higher at 21,496. European futures were just as indicative of a mixed opening: the DAX -0.34%, Euro Stoxx 50 -0.33%, FTSE 100 +0.05%, and CAC 40 +0.38%. The gap is an indication the market is breathing to process the signals from the central banks to prepare it for key earnings and economic reports.
This rally was due to dovish remarks by Federal Reserve Chairman Jerome Powell in Jackson Hole, where he kept the door open to the possibility that rate cutting may come sooner than expected. Rate-cut probabilities surged to 84%, from 75% yesterday’s estimate, into the week, infusing optimism into investors across the equity complex and shifting into value and cyclicals names. This morning’s futures warning asks investors if policy easing is evidence of economic strength or weakness that needs corrective action. Follow-through on the expectation core PCE inflation remains near 2.9% later in the week offsets the risk of sluggish inflation against weak growth conditions, dampening the euphoria that took the market to record levels. Earnings will be the next big sentiment test for the market. Nvidia’s earnings will be an event-of-a-tipping-point for the AI trade and will have far-reaching implications. As one of the strong performers on the market, its earnings will signal whether mega-cap tech reclaims leadership or the rotation into the cyclicals persists. Later this week, Dell and Marvell report, and investors will want to be comforted that demand for data centers, cloud computing, and semiconductors continues. In Europe, the mood is subdued, with investors tempering the tailwinds of ease policy hopes by concerns over declining industrial demand and the nebulous future direction of consumer confidence.
From our perch at Zaye Capital Markets, today’s conservative caution indicates the equilibrium achieved by short-term momentum against longer-term fundamentals. The rally off the pivot from last week’s Fed pivot has provided new opportunity but added risk if earnings or macro data weaken. Broadness are lean with most of the year’s gains accruing to mega-cap tech and a handful of cyclical names, leaving the market vulnerable to sudden reversals. Investors so far seem content to wait tight pre-electric economic prints matched with strong-featured earnings reports. Upside will continue to be dependent on the double phenomenon of monetary easing being followed by evidence of economic resiliency with power profit strength coming from the corporate universe or rally gives way to consolidation when re-emergence of risks.
Main Index Performance on Monday, 25 August 2025
- S&P 500: 6,464, down 0.05%
- Nasdaq Composite: 21,500, 1.9% higher
- Dow Jones Industrial Average: 45,632, +1.9% (new record close)
- Russell 2000: 2,362, +3.9% (new YTD high)
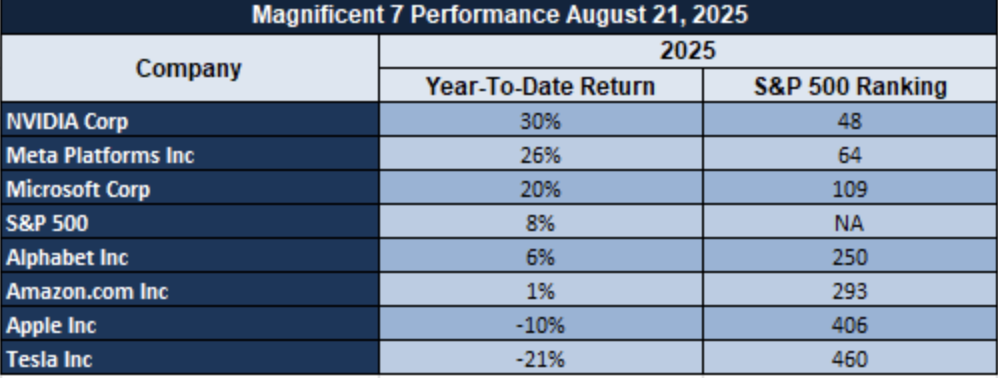
The Magnificent Seven and the S&P 500
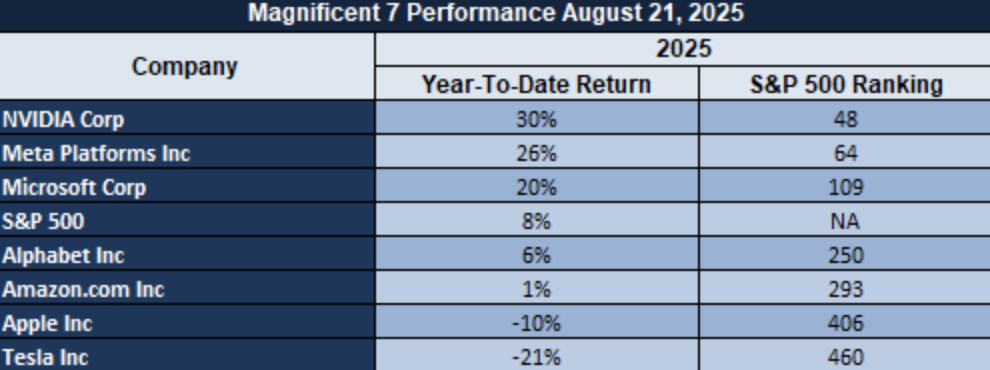
The “Magnificent Seven” — Apple, Microsoft, Nvidia, Amazon, Meta, Alphabet, and Tesla — remain dictating the tone to the market, yet already the weariness is palpable. The group has come down an average 18% from recent peaks, worst-hit being Tesla and Meta. This re-balancing is an indication that the hopes that investors have had on AI and growth possibly getting ahead of the fundamentals, and the S&P 500 remains fragile unless the leadership is diversified into industrials and defensives.
Drivers Behind the Market Move
Markets go into risk-balancing mode on Monday, weighing the optimism that the Fed signals last week against the geopolitical uncertainty and the deluge of data today. Market mood is not risk-on or risk-off overall, hoping to see if the rally is robust enough to sustain the stretch-driven upsurge.
1. Fed Policy Outlook & Inflation Watch
Jerome Powell’s Jackson Hole speech shut down the rate cut speculation in September, and the market is pricing close to 85% probability now. That kept the equities steady, although investors fear that the cut would be on the back of the economic slowdown instead of the strength. As the core PCE inflation forecast is still close to 2.9%, the traders are cautious to extend the rally further from last week before the disinflation trends get definitively proven.
2. Trump & Geopolitical Tone & Safe-Haven Flows
President Trump’s confrontational comments on Ukraine, his outrage over pipeline attacks and skepticism over any ceasefire, introduced another dimension of geopolitical risk. His comments have helped to support safe-haven demand, i.e., gold and oil, and added to pressure on already-shock-prone markets. Market players remain attentive for signals on how this tension is set to build and drive more general volatility.
3. Germany & U.S. Housing Incoming Data
Today’s U.S. New Home Sales and the German Ifo Business Climate will be the key sentiment setters. Better readings would be positive about U.S. and euro-area growth to favor the cyclicals and temper cut anticipation on the Fed. Weak readings would be favorable for defensives, firming safe-haven flows and cutting equity breadth further.
Digesting Economic Data
The Tweets of TRUMP and Their Implications
Recent consecutive remarks by President Trump present the market with a mixed basket of domestic policy confrontation, institutional posturizing, and geopolitical tension. His vitriolic denunciation of Ukraine shelling an Hungary-feeding pipe put energy security concerns across the Continent in sharp relief immediately. Coupled with his view that a ceasefire is unimaginable and one cannot go to war unless there are attacks on intruders, Trump’s comments provide another fuel to the already entrenched geopolitical risk premium in commodities. Applying to the oil and gas market, on the one hand, such remarks lends credence to the likelihood of disruption to delivery and strategic repositioning, but to safe-haven assets like gold, it reinvigorated investors’ determination to keep defensive hedges tight. Market pricing would hopefully take cognizance of optimism that such warlike rhetoric would enhance volatility even before actual escalation.
Domestically, Trump tweeting on pulling money out of Californian school districts that resist complying with transgender policies and continued obsession with voting machines and mail-vote sends a larger agenda of Trump to reorganize U.S. political institutions. While seemingly political in nature, these tweets are interpreted by markets as messages of regulatory uncertainty and possible social unrest. Consumer sentiment, especially in the education and tech sectors, would be harmed by this kind of divisive rhetoric. Additional concern for investors is institutional infighting would still tie Congress to call for additional fiscal action, extending infrastructure spending horizons on energy. This takes caution into equity markets most exposed to regulatory and policy change. At the federal level, Trump asks Congress to send him an additional $2 billion to Washington, D.C., along with the promise of guarantee toward safety and promises to “American buyers” constitutes a strategic wager toward further fiscal stimulus. This does matter a lot to the bond market levels and the dollar. Highly anticipated government spending makes the possibility of deficit unsustainability, generally sending yields up and the curve steeper. Rate-sensitive corners would be damaged by a headwind if bond market activity were forceful. There is investor interest as well in the spending promises existing nicely along with his approaches toward China and Russia due to the nature that fiscal promises tend to follow diplomatic approach.
Trump’s hedging communication style of oscillating between combative and conciliatory notes whelps double signals to the investors. On the one hand, Trump criticizes massive media and emphasizes an anti-establishment agenda driving equity volatility, especially across the communication and tech sectors. On the other hand, milder language from Trump—declaring love towards Russian and Ukrainian nations, interest towards cooperation with Zelenskiy, Putin, and Xi, and hints towards deals—are channels towards relaxing risk and renewed risk appetite. On the part of market participants, the duplicity is the maximum: abrupt shifts towards hawkish or dovish words cause day-ahead volatility but provide opportunities towards sector rotations. At Zaye Capital Markets, we interpret these tweets as a reminder that portfolios must balance exposure to cyclical sectors positioned to benefit from fiscal expansion with allocations to safe havens like gold, Treasuries, and defensive equities to weather policy and geopolitical shocks.
U.S. Housing Cools As Price Growth Stalls
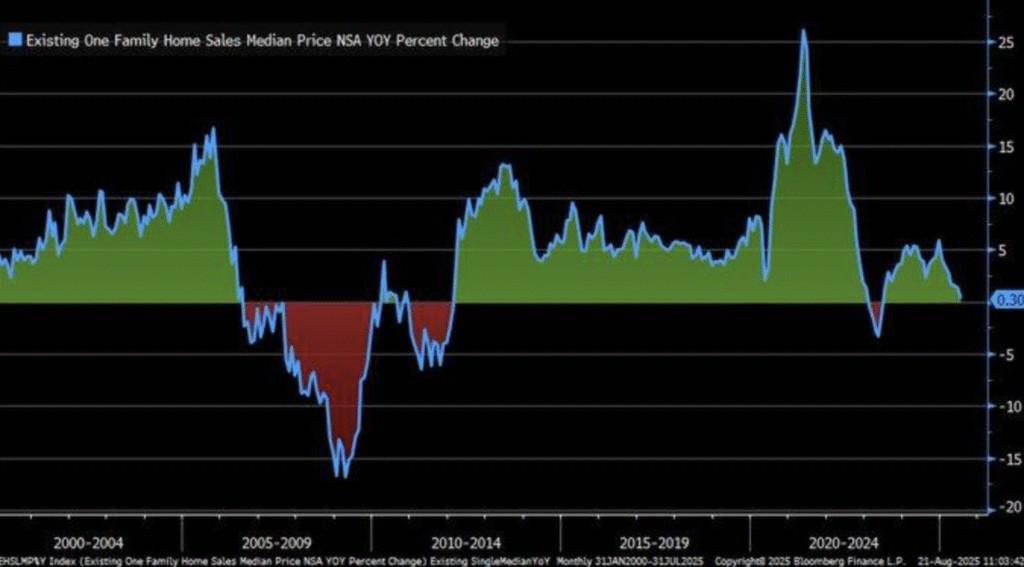
Year-over-year U.S. existing single-family home median price changes slowed down significantly to +0.3% in July 2025 from highs of more than 15% in 2021. The slowing trend is brought about by tight supply, affordability pressures, and tempered demand notwithstanding aggressive rate cutting since the late 2024 period. Earlier instances of such sudden decelerations in home price appreciation rates had identified weak household balance sheets and defied larger-sized consumption activity.
Housing property is a central monetary policy channel, and price volatility directly affects consumer spending and financial stability. A housing value plateau translates to reduced wealth effects, which might shrink retail, household maintenance, and mortgage-related industries. UK house prices did grow 1.3% in the same period, showing how divergent monetary and fiscal conditions make housing performance vary geographically. In US markets, the plateau translates to policy limitations in generating demand through lowering interest rates alone.
Here, U.S. homebuilders appear cheap to us, especially those diversifying geographically and having strong balance sheets due to prices within the market seeming to discount additional weakness among fundamentals. Investors should be on alert on inventory levels within the residential market, affordability on the part of mortgages, as well as central bank guidance. Uptrend deceleration would risk turning investor demand towards defensive equity names, stabilisation on the other hand would arouse renewed demand towards value real estate-linked names.
Leading Indicators Suggest Soft Landing
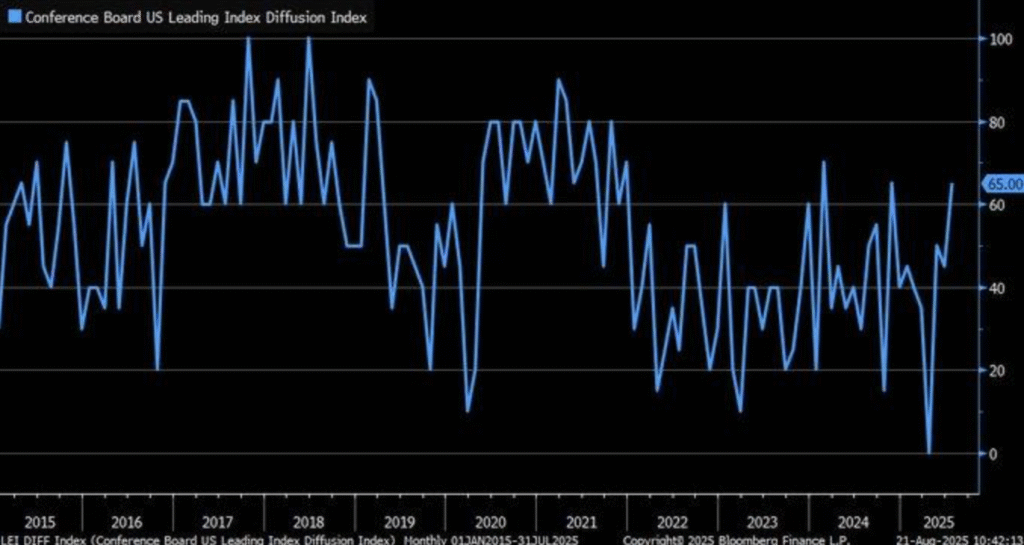
The diffusion reading in the LEI rose to 65% in July 2025 to mark overall economic improvement as even more underlying indicators firm up. Diffusion readings above 50 generally signal general positive activity across inputs, and the latest rise defies bearish expectations predicted to be the early outcome this year. With no signs from the “3Ds rule” — that was the signal to previous recessions — the conditions instead compute to stabilisation instead of contraction.
Previous peaks in LEI diffusion were ahead of the pickup in the growth of the GDP, validating its reliability as a leading indicator. This implies the economy is leaning towards a soft landing on the back of growth led by strong jobs, softening inflation, and slowly tightening consumer confidence. Equity volatility remains a dampener despite investors rewiring portfolios on policy sentiment and earnings clarity. The absence of recession triggers removes one risk contribution on the negative side but does not do anything to reduce market vulnerability.
For equity market exposure, we believe some industrial names remain undersold, especially those which remain sensitive to infrastructure and demand within logistics, where the forward earnings growth is yet to be priced. Analyst estimates should remain closely watched vis-à-vis the ensuing LEI print series as well as the release of the GDP accompanied by the corporate guide. Continuation of diffusion improvement would confirm the soft-landing hypothesis, re-rating the cycle names discounted vis-à-vis the wider indexes.
Jobless Claims Indicate Labour Resilience
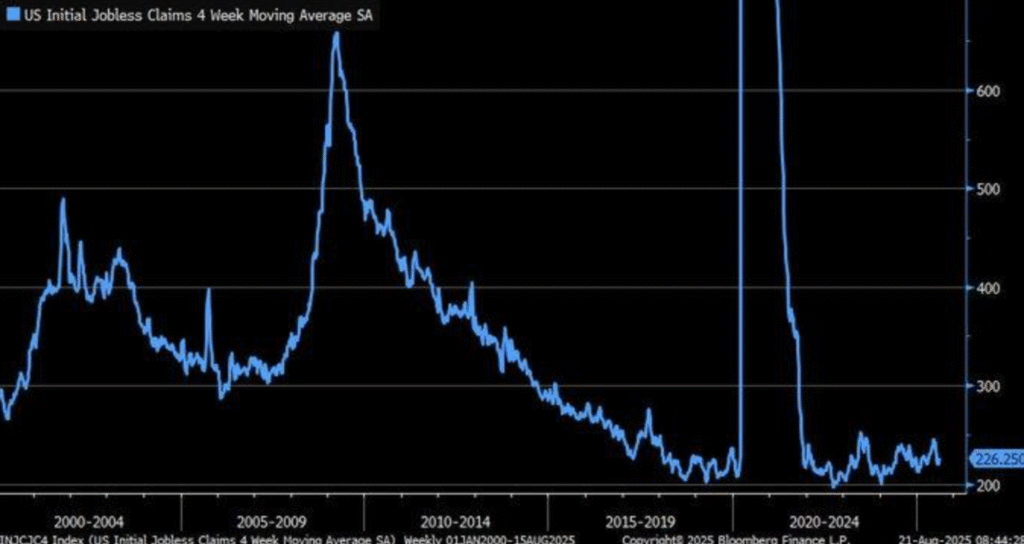
The initial U.S. unemployment claims 4-week average has fallen to close to historically low levels of around 200,000 as of mid-2025, signaling continued labour market strength. Conversely, those reductions are contrary to mainstream economic weakness narratives and supportive of continued labour demand despite the tighter monetary backdrop. Historically low initial claims have previously been linked with strong GDP growth and reduced near-term recession risks, and that is a buffer against policy uncertainty.
But the backdrop is most definitely not subtle. As the initial reports remain subdued, the ongoing reports move towards multi-year highs, hinting towards re-employment hurdles after the job loss. This apparent paradox can be an indicator towards structural labour market dynamics, where the businesses continue to hire selectively but the unemployed labour spends more time unemployed. Both commentators and analysts acknowledge the dichotomy to indicate the necessity to skew the optimism towards the headline labour market stability towards the fears about the underlying frictions.
The under-valuation is evident in staffing and workforce solutions companies that position strongly to continue to benefit from ongoing labour churn and strong special placement demand. Recurring claims will remain an important monitoring point by the analysts due to the possibility that recurring divergence may put a strain on consumer spending patterns. On-going labour demand does though support the soft-landing hypothesis and positive cyclical exposures that remain undersold relative to growth indexes.
Manufacturers Signal Renewed Capex Strength
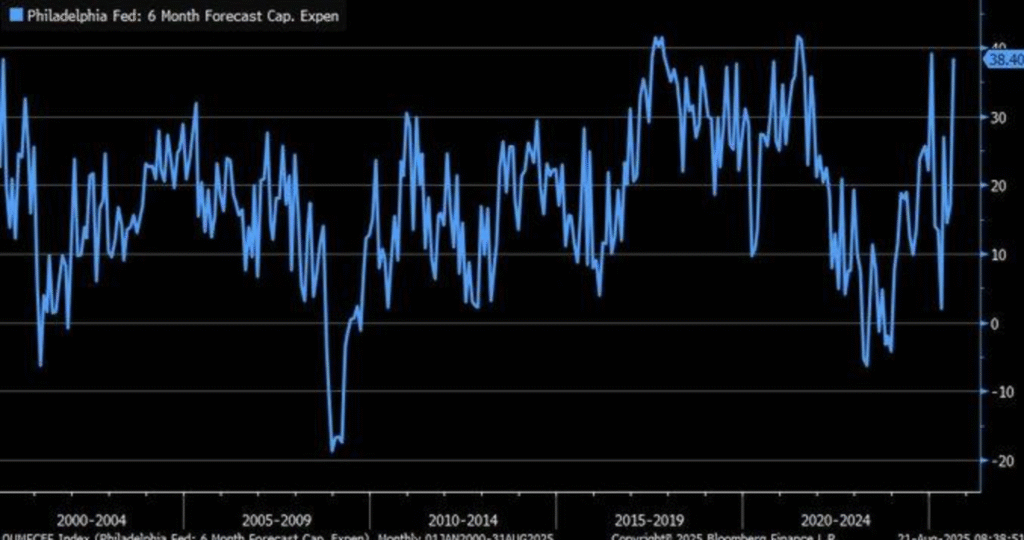
Philadelphia Fed August 2025 Manufacturing Index releases surprise six-month increase in intentions to invest in capital following years of reversals in sentiment. Having fallen into the negative late 2022, renewed vigor on the index indicates business gearing up for period of expansion just as it had done in the past when increasing capex intentions had subsequently been led by industrial expansion. Past associations between the index and the GDP strongly confirming the current upward movement contradicts claims of sustained slow-down in manufacture.
This optimism has been based upon strategic investments across core demand areas. Demand within cloud capacity and artificial intelligence is propelling intensifying global demand for energy infrastructure and data centres, aided by these. Factory-driven improvements in energy efficiency are gathering momentum as well, spurred by policy support and cost pressures. Overall, these plans amount to firms positioning themselves to position themselves in anticipation of structural transformation across domestic and foreign chains of industry supply, industrial resilience being underappreciated compared to prevailing market prices.
From an equities perspective, we think that certain industrial and energy-infrastructure vendors are undervalued, i.e., those with a skew toward next-gen data centers and green power grids. Upcoming capex surveys and company guided forecasts will be monitored by analysts, as positive confirmation of the trend would re-price cheaper industrial stocks. Persistent follow-through in manufacturing expenditure would be a very significant pillar of support for the overall soft-landing thesis, affirming cyclical leverage at favorable levels.
Persistent Bearish Sentiment Signals Contrarian Opportunities
The AAII Bull-Bear Spread is bearish since early 2022 and signals consistent bearishness among U.S. investors. Bull sentiment was 30.8% the August 2025 survey, significantly low relative to the average 37.5%. This ingrained caution is the opposite of long-term trends when optimism has bested bearishness despite contrarian indicators pointing to an environment that yields better equity performance due to value opportunities getting missed on the consensus level.
Longer bear sentiment considers macroeconomic headwinds and policy uncertainty. Higher U.S. interest rates with sluggish transmission to the real economy subdued risk appetite but increased caution. In addition, cross-border uncertainty regarding the cost of tariffs, trade reorientations, and labour-market policies has maintained investors on guard. The ongoing negative spread is to blame for sentiment stuck on fear in spite of greater datasets showing stabilisation on growth and inflation.
From the standpoint of valuation, the market offers selectively U.S. mid-cap names as cheap, meaning those that have strong cash flow strength but discounted relatively to previous multiple norms. Sentiment spread needs to be watched meticulously by the analysts alongside forward earnings estimates and Fed speak. If negative sentiment starts to turn on its head, it would trigger a switch into discounted names on the cyclical periphery offering profit opportunities to contrarians before the consensus.
LEI Decline Indicates Continued Weakness
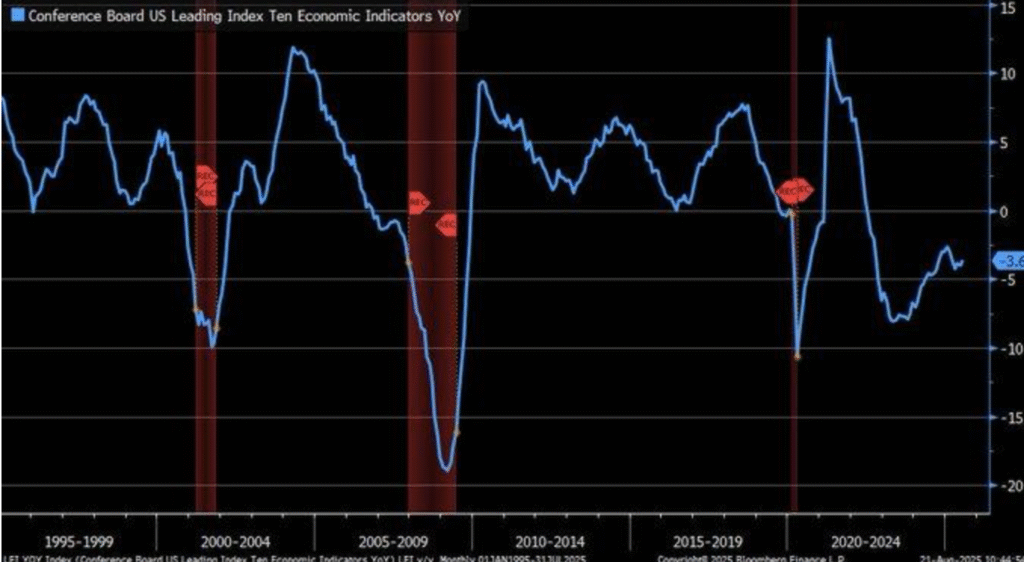
The Conference Board LEI (Leading Economic Index) slipped 3.6% year-over-year in July 2025 yet again despite a modest increase on a monthly level. Long-term slides into the LEI were considered classic recessionary previews, accordingly casting a skeptical gaze toward the near term. The index value, though, altered the composition of the economy from an nearly wholesale-based manufactural economy to an index that incorporates wider indicators through stock prices and credit market conditions, clouding the forecast ability of the index.
Although the headline weakness is sizeable, evidence shows the LEI is best when accompanied by other indicators. Metrics such as equity performances and building permits tend to precede economic turning points by six to twelve months or more. Present weakness is thus never conclusively indicative of a recession but rather an indication of the weakness of growth momentum. Analysts should take note when balancing it against strengthening labour market data and better estimates of spending on capital to achieve an even balance.
For investors, undervaluation seems most evident on select defensive stocks, namely consumer staples and utilities, whose earnings resiliency is less valued relative to the overall market risk. Should the weakness on the LEI persists without validation by coincident indicators, defensive exposure should dampen the impact on volatility. Should any reversal happen among leading constituents, an early re-rating opportunity may befall those discounted cyclical sectors.
Manufacturer Confidence Conflicts With Weakness
The August 2025 Philadelphia Fed Manufacturing Index shows an intriguing gap: the current new orders dropped into contractionary levels when the six months forward forecast jumped to 39.2. The bizarre gap hides producers’ near-term optimism that the economy will recover quickly despite near-term softness. Optimism is most likely generated by hopes that interest rates someday will decline to stimulate demand for manufactures. As experience would dictate, forward-looking indexes over-shoot when uncertain times are down the pike and should be viewed skeptically.
The order weakness over the last few months again suggests current headwinds due to spotty demand across the world, supply chain congestion, and credit restraint. Forecast strength on the other hand suggests firms hope to see relief from the same pressures in the next few months. Cycles impose unrealistic optimism given the same improvements in the labour utilisation or the supply chains would fall sharply. Forecasters need to weigh the forward strength of the sentiment indicators by the chilly realities of poor current activity.
Evident undervaluation is most apparent in diversified industrials with international exposures where the stock prices themselves already incorporate greater despair than the fundamentals justify. The analysts will do well to watch closely whether the better times in the logistics business, commodity prices, and hiring materialize to justify the better future. If the margin still to be covered between the current weakness and the better prospects continues without confirmation, it should increase volatility within the cyclical groups, although the contrarian wager is selectively on industrial names.
Upcoming Economic Events
German ifo Business Climate, U.S. New Home Sales
During the course of the week when we move ahead in trading, two indicators will be on the top of investors minds: the German ifo Business Climate and U.S. New Home Sales. Both reports hold immense significance when it comes to shaping perceptions on growth prospects in Europe as well as the U.S., both will be watched closely for data on business sentiment and consumer demand. Results compared to expectations will decide whether the market moves towards risk appetite or defensive position.
German ifo Business climate
Germany’s ifo index is one of the most closely observed business sentiment indicators across the eurozone.
- A beat on the actual would affirm German corporates were focusing beyond near-term softness within the factory sector to stabilise versus global headwinds. This outcome would offer tailwind relief to European equity markets, strengthen the euro currency unit, and release pressure on bond yields as growth prospects solidify.
- A soft print below estimates would otherwise affirm stagnation concerns, soften the cyclical names a notch down, depreciate the euro currency unit, and trigger safe-haven buying into the bunds and Swiss currency assets. Sub-indices should similarly be observed closely by the analysts, especially the manufacturing and the expectation sub-indices, given the fact that these tend to offer early signs on the overall European momentum.
U.S. New Home Sales
The American property market is still an important gauge of household well-being and important channel of monetary policy transmission.
- The better-than-forecast print would confirm consumer resilience in the face of increased borrowing costs, overall positive homebuilders’ sentiment and benign sectors like building construction. Strong demand would, however, lead the Fed to slow the pace of rate cutting, placing an upside pressure on the Treasury yields to moderate rate-sensitive optimism on technology.
- Sales below forecasts would emphasize affordability issues and declining household confidence, weighing on equities related to household spending while safe-haven bonds and defensives.
Stock Market Performance
Indexes bounce back from April lows but weak breadth indicates caution once again
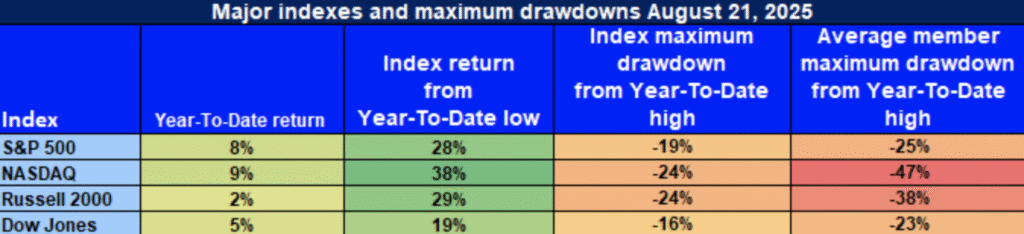
American shares rebounded strongly off the April 8 trough, with major indexes posting strong double-digit increases from the lows. But beneath the headline advances is the evidence of continued volatility. Year-to-date action remains rough, and large pullbacks from 2025 levels illustrate the effects of volatility on the market. The difference between index-level action and the average constituent decline illustrates thin leadership, where advances are being supported by a narrow roster of large names and the rest of the market is held in check.
Here is our complete summary of current action on the major indexes:
S&P 500: Advances Led by Large-Caps
YTD: 8% | -28% below April low | -19% below YTD high | Avg. member: -25%
The S&P 500 had an 8% year-to-date result and 28% recovery from April lows, a reflection on the strength of its larger members. However the index had dropped 19% peak to trough, average member decline 25%. That supports the opinion breadth continues to be thin, mega-cap names once again covering up underlying frailties across the wider market. There is danger inherent even amongst the strongest-at-the-board performers that come with the hefty tag price for trackers, but opportunity may lie amongst the under-rated defensive pieces to the jigsaw.
🚀 NASDAQ: Growth Heavy, Fragile Depth
YTD: +9% | +38% below April low | -24% from YTD peak | Avg. member: -47%
The NASDAQ faces a 9% year-to-date rise and 38% rally off April lows on the part of technology and growth leaders. However, the index plummeted 24% precipitously from peaks meanwhile the average constituent off 47%. This differential is a indication of extreme risk should sentiment change. That the rise is concentrated within the tight group of leaders is an indication of extreme risk should sentiment reverse.
📊 Russell 2000: Small-Cap Rally Still Thin
YTD: 2% | 29% below April low | 24% down from YTD high | Avg. member: -38% The Russell 2000 is 29% above its level since April but only 2% year to date, reflecting subdued confidence in the small-cap universe. 24% YTD fall from the recent top and 38% average-member losses confirm the sector is still being constrained by increasing cost of funds and susceptibility to U.S. demand. This group is considered both risk and opportunity by investors: although the valuations have reduced considerably, the scope for the upside is tied to the accelerating economic growth rate and enhancing credit.
Dow Jones: Defensive Bias Provides Cushioning
YTD: +5% | -19% from April low | -16% from YTD high | Avg. member: -23% Defense-biased Dow Jones was 5% higher year to date and recovered 19% from April lows. Its small 16% drop is a testament to its relative strength, but average member declines of 23% are a testament to weaknesses even in improved stable value names. There is sector demand into the defensive exposures due to the need for stability, but the drawdowns are a testament there isn’t any part of the market that is totally immune from volatility.
We at Zaye Capital Markets observe that while April lows’ rally has been inspiring optimism, the absence of participation on a widespread scale renders the markets susceptible to sudden reversals. We are cautious and prefer well-quality stocks with sound balance sheets, good cash flows, and defensive earnings streams. So long as breadth does not keep up and average member performance is not at near-index level advances, the rally is best greeted with controlled positioning and not with risk-taking on an overall basis.
The Strongest Sector in All These Indices
Communication Services Leads Year-To-Date
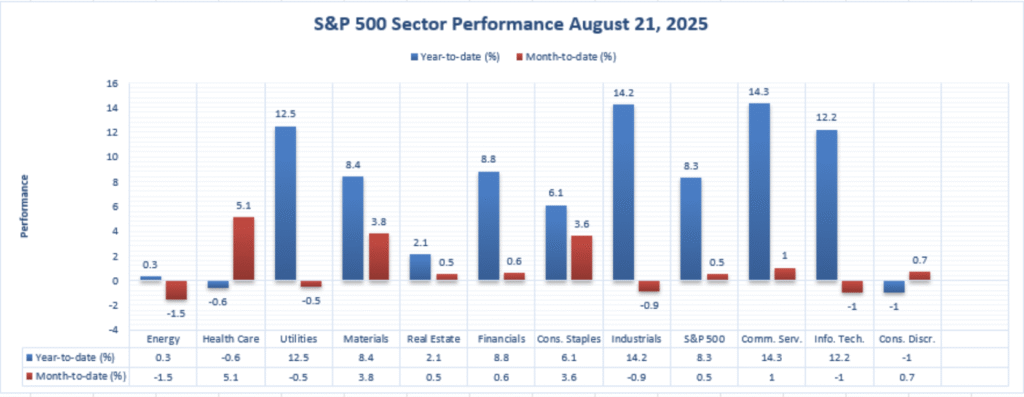
Year to date (YTD), the Communication Services sector takes the top spot by gaining 14.3%, bettered by Industrials by 14.2%. Utilities fall just behind by 12.5%, and Information Technology by 12.2%, both two of the biggest contributors YTD to the S&P 500’s YTD 8.3% advance. Nine sectors continue to be positive, led by Consumer Discretionary down 1.0% and Health Care down 0.6% behind the others since the start of the year.
Health Care Leads Month-to-Date
Differing from the year-to-date snapshot, Health Care led on a month-to-date basis by rising +5.1%. Materials (+3.8%) and Consumer Staples (+3.6%) were the leaders for the month of August, whereas Communication Services (+1.0%), Consumer Discretionary (+0.7%), Financials (+0.6%), and Real Estate (+0.5%) experienced poorer appreciation. The S&P 500 overall is higher by +0.5% month-to-date, a testament to this broader but rotational strength.
Change in Leadership Marks Market Shift
Month- to- year- to- date leadership rankings demonstrate continued sector rotation. As growth sectors like Communication Services and Industrials top the year- to- date lists, defensives like Health Care and Consumer Staples reigned supreme in August. Softness persists in the Energy (−1.5% MTD, 0.3% YTD), Information Technology (−1.0% MTD, 12.2% YTD), and Industrials (−0.9% MTD, 14.2% YTD) sectors, showing the recent volatility pummeled the cyclical names even though their health was good.
Earnings
Yesterday – August 22, 2025
- Didi Global Inc. DR
No new earnings were released on August 22, 2025. Company filings and press channels carried no quarterly updates, leaving investors with little fresh information to gauge operational performance. The absence of new data kept focus on recent price moves rather than fundamentals.
- Ubiquiti Inc.
Ubiquiti delivered a strong set of fourth-quarter results, with revenue of $759.2 million and GAAP diluted EPS of $4.41, up sharply from $1.72 a year earlier. Adjusted EPS of $3.57 highlighted significant profitability, while gross margins expanded to around 45.1%. Management complemented results with a $500 million buyback program and a dividend hike to $0.80 per share. These shareholder-friendly moves, alongside strong earnings momentum, sent the stock surging more than 20% on the day.
- BJ’s Wholesale Club Holdings, Inc.
BJ’s posted adjusted EPS of $1.14, ahead of consensus near $1.10, but revenue of $5.38 billion fell short of expectations. Comparable-club sales ex-fuel rose 2.3%, below forecasts, weighing on sentiment. Despite raising full-year EPS guidance to $4.20–$4.35 from $4.10–$4.30, the stock declined around 8% as investors focused on softer top-line growth and cautious consumer spending signals.
- Buckle, Inc. (The)
The Buckle reported fiscal second-quarter net income of $45.0 million, or $0.90 per share, on revenue of roughly $305.7 million. Strength in private labels and digital channels supported performance, with margin expansion underpinning steady profitability. The results underscored the company’s ability to navigate consumer headwinds while leveraging its differentiated product mix.
Today – August 25, 2025
- PDD Holdings Inc. DR
PDD is set to announce second-quarter earnings before market open today, with a call scheduled for 7:30 AM ET. While no detailed previews were released, investors will focus on transaction volume growth, user expansion, and whether aggressive pricing strategies are sustaining margins.
- HEICO Corporation
HEICO is expected to post third-quarter fiscal 2025 results after the close, with consensus around $1.12–$1.13 EPS on $1.11 billion in revenue. Analysts will be watching its Flight Support and Electronic Technologies units, where recent demand trends have supported margin expansion. A follow-up call is planned for August 26, offering more clarity on growth drivers.
- Semtech Corporation
Semtech will report second-quarter fiscal 2026 results after market close, with Street estimates pointing to EPS of $0.40 and revenue near $256 million. The 4:30 PM ET call will be closely watched for commentary on semiconductor demand, AI-related opportunities, and supply chain normalization.
Stock Market Report – Monday, 25 August 2025
The U.S. stock market opened cautiously this week after last Friday’s record rally on the dovish hints from the Federal Reserve at Jackson Hole. Prices pulled back modestly this morning, yet investors remain aware of the central bank policy, earnings, and the mega-cap technology leadership health.
Stock Prices
Economic Trend and Geopolitical Developments
Markets weigh hope for a September rate cut—where futures imply 85% probability—against fear of overextended tech valuations. The results this week from Nvidia remain the gauge to follow for tech-heavy growth stock-fueled AI-driven growth story. Policy debate over tariffs and consumer sentiment readings are closely followed for their capacity to turn around assumptions over money ease pace.
Latest Stock Updates
Following are the top 15 growth performers of the year until 2025, reflecting investors’ appetite for high-beta shares despite volatility:
- $MP +335%
- $PGY +263%
- $OKLO +232%
- $OPEN +213%
- $HOOD +193%
- $OUST +151%
- $NBIS +149%
- $CRWV +141%
- $TEM +139%
- $CELH +134%
- $ASTS +123%
- $PLTR +110%
- $JMIA +106%
- $RBLX +103%
These massive returns are normal where sentiment was focused—mostly on tech, the energy transition, and fintech names even though valuations in most now are rich.
The Magnificent Seven and the S&P 500
The “Magnificent Seven” — Apple, Microsoft, Nvidia, Amazon, Meta, Alphabet, and Tesla — remain dictating the tone to the market, yet already the weariness is palpable. The group has come down an average 18% from recent peaks, worst-hit being Tesla and Meta. This re-balancing is an indication that the hopes that investors have had on AI and growth possibly getting ahead of the fundamentals, and the S&P 500 remains fragile unless the leadership is diversified into industrials and defensives.
Main Index Performance on Monday, 25 August 2025
- S&P 500: 6,464, down 0.05%
- Nasdaq Composite: 21,500, 1.9% higher
- Dow Jones Industrial Average: 45,632, +1.9% (new record close)
- Russell 2000: 2,362, +3.9% (new YTD high)
We see at Zaye Capital Markets that despite stable indexes, narrow leadership does signal weakness. A more resilient rally would need to expand past the Magnificent Seven, the question now being whether solid earnings and sector rotations will support stretched valuations through Q3.
Gold Price
Through Monday, Aug. 25, 2025, spot gold is trading at about $3,364 an ounce, lower from a two-week high after the stronger dollar briefly stretched the metal. ETF flows, headed by stable SPDR Gold Shares at $310.58, indicate the investors’ demand into the asset is still intact despite the pullback. Consolidation did not come as a surprise following the dramatic gain in gold over recent weeks on market pricing of nearly an 87% chance of Federal Reserve interest rate cut this September. Lower interest rates mean that there is less opportunity cost of holding non-yielding assets such as gold and is hence most attractive under the circumstances. So long as gold is still well above the $3,300 mark, the metal is indicating the overall market continues to think there is still more risk to growth and financial stability.
Political opinion and economic data are also guiding sentiment. President Trump’s blanket statements on Ukraine and geopolitics generally were accentuating gold’s safe-haven demand, with investors speculating on risk hedging amidst uncertainty over global energy demand and diplomatic normalcy. In other news, today’s release of the German ifo Business Climate and the U.S. New Home Sales is important. Better-than-expected prints would maintain gold’s rally in check by temporarily lifting risk assets, but poor results would consolidate the defensive argument. Yesterday’s weaker macro prints already indicated softening demand and nervous business sentiment, fueling optimism on policy easing. In our opinion at Zaye Capital Markets, gold’s resilience indicates a market turn on the back of dovish monetary prospects and geopolitical risk. The near-term dip seems tactical, the structural gold argument comfortably maintained, with investors buying the dip on the back of ongoing global uncertainties.
Oil Prices
As on Monday, 25 August 2025, Brent is trading close to $67.80 per barrel and WTI close to $63.75 on the back of renewed geopolitical concerns and hopes of rate relief. Supply disruption concerns remain on the rise following Ukraine air attacks on Russian oil infrastructure facilities, specifically Ust-Luga terminal and Novoshakhtinsk refinery, which jointly dominate large export volumes. This news has tightened the supply outlook short term, although optimism that the U.S. Federal Reserve would cut the interest rate towards the end of the month in September has supported the demand forecast by weakening the dollar and raising hopes on international demand.
President Trump’s frank comments on Ukraine and criticism of attacks on pipelines brought a level of geopolitical risk premium to the oil market, pointing to the market’s bid to defend against times of uncertainty. His overall position relative to Russia and security guarantees keeps the risk of escalation on energy flows that keeps the traders on their feet. Yesterday’s soft business and housing confidence data, though, fulfilled dovish money hopes, aiding demand by an order of magnitude despite the concerns on global growth. In the near term, the U.S. New Home Sales and German ifo Business Climate due today will be the triggers: strong readings would indicate persistent economic activity that will take the market further forward, whereas softer prints will dampen demand sentiment and shift the flows into safe-haven proxies such as gold.
Bitcoin Prices
As on Monday, 25 August 2025, the bitcoin rate stands near $113,400 after reversing from a recent high above $124,000. This is a stabilisation mode facilitated by firm institutional inflows despite short-term 2,400 BTC ETF outflows last week. Market cap stands significantly above the level of $2.28 trillion, marking the institutional maturity of bitcoin increasingly as a traditional store of value. Bernstein analysts remain upbeat, viewing the run possibly stretching into 2027 at levels of $150,000–$200,000 on the back of excess liquidity and strategic take-up among flagship institutions. There is, however, restraint on the part of analysts referring to past crypto cycles being shorter, fueling debate on the run being qualitatively different.
Trump recent remarks on Ukraine and geopolitical risk are stoking the safe-haven story of Bitcoin fueling its hedging role amid uncertainty. Cumulative indicators towards the establishment of an upcoming U.S. Strategic Bitcoin Reserve—one linked to gold revaluation offers to purchase one million BTC—are further solidifying long-run optimism quasi-sovereign-izing Bitcoin. Softer U.S. business sentiment yesterday on the flipside reinforced the risk of money ease making funds less expensive and contributing towards speculative demand. Prominent data release today comes from the German ifo Business Climate and U.S. New Home Sales dataprints: stronger reads risk imposing temporarily downwards pressures on BTC shifting risk appetite towards equity assets yet again, though softer prints would solidify the role of Bitcoin both as a recession hedge and liquidity-driven currency. From our Zaye Capital Markets observation, the pullback on Bitcoin is strategic, rather than structural—one supported by the overall ecosystem by institutional adoption, strategic talk on reserves, and dovish policy hopes toward its long-run course.
ETH Prices
On Monday, Aug. 25, 2025, Ethereum (ETH) trades near $4,741 after dipping back slightly from an intra-day peak of near $4,951. The pullback aside, sentiment remains solidly bullish on the argument that spot ETF holdings now collectively possess 6.42 million ETH after capturing nearly $7.9 billion July-August inflows. This demand-side structural shock has tightened circulating supply, driving ETH to fresher all-time highs in early August and making it the second-largest market-cap token.
On-chain movements validate this strength, with the whales and “sharks” cumulatively added approximately 4.9 million ETH on corrections, and a large holder maintained a $1.11 billion leveraged long position, demonstrating keen conviction towards upside potential in the future. This cohort of ETF inflows, whale purchases, and leveraged positions forms a bullish situation on the price direction of Ethereum. But leverage of this nature introduces short-term volatility risks if a sentiment shift materializes in haste. In our view at Zaye Capital Markets, Ethereum is underpinned fundamentally by institutional demand and absence of supply on the other side, the troughs becoming magnets for yet more accumulation building the long-term growth opportunity further.
