Where Are Markets Today?
European and United States stock futures are modestly higher today as the investment community looks for upcoming releases of earnings reports from Nvidia providing glimpses of the health of the AI space and overall trends of the markets. United States Dow Jones Industrial futures rose 29 points, or 0.06%, and S&P futures rose 0.7%, with Nasdaq 100 futures gaining 0.1%. Large indexes for Europe are also modestly higher, with Euro Stoxx 50 futures gaining 0.17%, as a sign of cautiously bullish attitudes waiting on key releases of economic data and corporate earnings reports.
Optimistic trend on futures markets is driven by a set of factors. First of all, recent performances of tech giants such as MongoDB and Okta have surpassed expectations due to robust demand for AI platforms. That has led to a preference of tech stocks among investors. Secondly, expectations of Nvidia earnings are inducing optimism since the company itself is a representative of the AI industry, and its performance greatly influences market sentiment. Thirdly, European markets are having a breather from recent political unrest in France as investors are waiting for stabilization and transparent policies of the regional economy. Still, markets are hesitant due to the existing geopolitical risks and economic unknowns. In the United States, recent moves made by President Trump, such as the removal of Federal Reserve Governor Lisa Cook, called many questions regarding the independence of the Federal Reserve and its jurisdiction on monetary policy. That made the markets hesitant again, as investors cautiously re-evaluated. The implications of future rate decisions are again on investors’ minds, causing another level of hesitance.
In coming months, market players will watch for Nvidia earnings as it gives more guidance for the technology sector and for the overall market mood. Besides the earnings releases, economic indicators reports, such as consumer confidence and durable goods order, will keep eyes glued for a glimpse of health for the economy and possible effects on Federal Reserve policy direction. The futures are already pointing in the right direction, but investors are waiting and watching, weighing hope against concern as they are hunting for new insight.
Major Index Performance on Wednesday, August 27, 2025
- S&P 500: At 5,841.52, down 0.4% on the day.
- Nasdaq Composite: Down at 18,220.78, -0.6%, due to pressure from weakness among
- Dow Jones Industrial Average: +0.2% at 41,182.34, with advances for defense sectors
- Russell 2000: Down at 2,147.63, owing to the rate sensitivity of the small cap.
The Magnificent Seven and the S&P 500
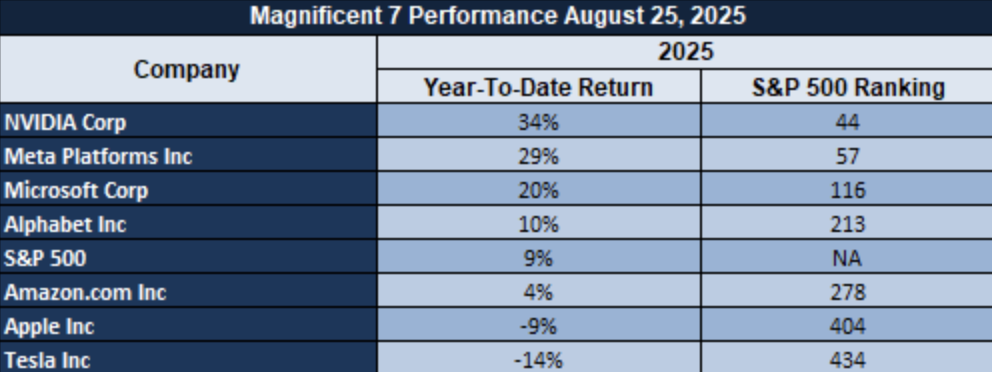
Apple, Microsoft, Nvidia, Amazon, Meta, Alphabet, and Tesla’s so-called “Magnificent Seven” are never before under such stress, with these blue-chip giants suffering greater-than-18% drawdowns from recent highs. Tesla and Meta are pacesetters of the declines, symptomatic of the valuation correction running ahead of its fundamentals. Nvidia, still a point of contention given its leadership status with AI, remains an investor fixation ahead of its upcoming earnings report. As these names appear played out, the S&P 500 becomes ever more dependent on the thin roster of mega-cap names and due for correction if these leaders do not turn around.
Drivers Behind the Market Move
Global futures are making marginal gains this morning as market participants are waiting to see Nvidia’s upcoming earnings call for indications of the well-being of the AI space and overall market direction. Futures for the US Dow Jones Industrial Average increased 29 points, or 0.06%, S&P futures increased 0.7%, and Nasdaq 100 futures increased 0.1%. Major European benchmarks are also making marginal gains and are higher with Euro Stoxx 50 futures increasing 0.17%, indicative of cautiously optimistic sentiment ahead of key economic data releases and corporate earnings reports.
1. Nvidia’s Earnings Report Expectation
The upbeat mood of the futures market has quite a few reasons to thank for. One, recent earnings announcements by MongoDB and Okta have surpassed estimates due to very strong demand for AI platforms, which has lifted investor sentiment for tech stocks. Two, there are strong hopes for the earnings announcement of Nvidia as the latter is a bellwether of the AI space and the news might have big implications for the mood of the market. Three, the Euro markets are enjoying respite from recent political upheaval in France and are looking for stabilization and predictability of the continent’s economic policies.
2. Geopolitical Tensions and Independence of U.S. Federal Reserve
In spite of the bullish climate, markets are cautious because of increasing geopolitical risk as well as economic uncertainty. Recently, in the United States, news from President Trump, such as the ouster of Federal Reserve Governor Lisa Cook on charges of mortgage fraud, has raised issues of Federal Reserve independence as well as monetary policy intentions. All these have raised some degree of concern in the markets, and investors have been approaching the situation cautiously. Political risk of interference during the working of the central banks is contributing its share towards advancing a defense strategy of the markets.
3. Future Economic Data Releases
Throughout the weeks coming up, market participants will keep a close eye on releases of upcoming economic reports, such as durable goods orders and consumer confidence, due later this week. The reports will give clarity on the state of the economy and have the capability of altering upcoming monetary policy expectations. Investors are especially on edge if there are any preliminary signs of economic slowdown, as this kind of data has the capability of informing Federal Reserve rate parameters. Geopolitical concerns and upcoming economic data releases have the investor community on their toes, swinging between hope and caution as they wait for new data.
Overall futures markets are bullish in mood on the strength of strong earnings reports and hopes for Nvidia performance, but at the same time investors are nervous because of central banks independence issues and upcoming releases of economic data. Interaction of these forces is governing market mood and forming cautiously bullish expectations for the next trading day.
Digesting Economic Data
The Trump Tweets and Its Implications
Recent pronouncements by President Trump have evoked vitriolic market responses, most definitely from the political and financial sectors, which will definitely find subsequent implications on market prices and mood. One of Trump’s possibly most acrid remarks, demanding the return of the old Cracker Barrel logo following public protest, reflects his modus operandi in addressing cultural and corporate policies that may have implications on future market development. As mundane as this remark is to the general market, it once again reflects Trump’s still-strong grip on public opinion and corporate policies, especially with him still on the political landscape.
Additionally, Trump’s statements of encouragement for oil prices of around $60/barrel have energy implications, as his explicit encouragement of stable energy pricing is likely to boost investor expectations of oil holdings. Trump’s policy on energy and encouragement of oil can also have implications on oil trade flows worldwide. Specifically, his recent moves on tariffs and the American position on prohibiting importation of Russian oil are responsible for the creation of supply chain disruptions with possible implications for the energy market as a whole, with implications for price trends as well as increased volatility for oil markets around the world. As investors consider the impact of his statements, oil-themed stock and ETFs can become more volatile, with possible revisions for energy demand projections.
While in his legal fight, Trump’s removal of Federal Reserve Governor Lisa Cook on the basis of alleged mortgage fraud and implicit threats of further meddling with the operations of the Fed represents a watershed. Such action has the likelihood of undermining investor confidence in the independence of the United States central bank, introducing volatility within the financial realms. Trump’s open statements of taking Cook to court and potentially using Washington D.C.’s National Guard represent another aspect of political risk that is likely to induce a hawkish market response. This is likely to induce a flight to safety, with instruments like government paper and gold witnessing increased demand due to hedging of perceived risks of financing.
Finally, Trump’s remarks regarding the Russia-Ukraine war, which state that “it is very hard, if not impossible, to win a war without attacking an invader’s country,” are part of his overall geopolitical outlook that can influence world markets. Statements of this nature have the potential of increasing tensions and affecting market mood, especially on defense and energy markets, as geopolitical risks normally increase safe-haven demand. Investors will continue to keep an eye on how Trump policies and remarks on foreign affairs and especially on Russia will influence the overall global economy and certain markets and cause price movements for commodities, defense shares, and energy assets. Independently, President Trump statements and opinions have market impacts, particularly for energy, defense, and financial markets. Oil perspectives, Fed controversies, and perspectives on foreign skirmishes are capable of initiating market volatility, with market impacts on asset prices, investor attitudes, and market stability. Since the political landscape will remain variable, market participants will have to keep their eyes widely open, as their perspectives will have to change to meet the dynamic environment instigated by Trump perspectives and actions.
U.S. Economic Growth Outlook: Divergence In GDP Estimates Signals Underlying Risks
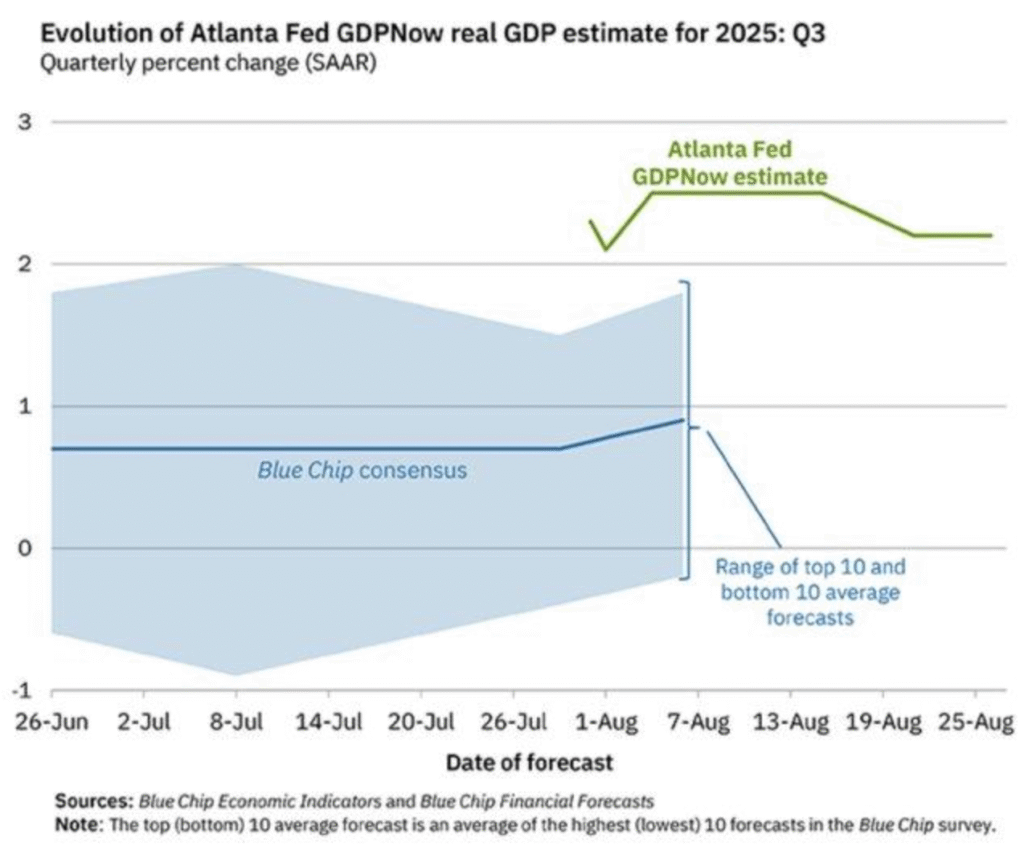
In its newly released GDPNow prediction, the Atlanta Fed forecast a 2.2% Q3 2025 expansion of the real GDP based on its model combining 13 of its subcomponents with the Bureau of Economic Analysis chain-weighting system. Residential investment and net exports are, however, weighing this expansion down, and this has been highlighted with concern in an Atlanta Fed working paper of 2021 concerning the accuracy of the model as a predictive system. The prediction is substantially higher than the Blue Chip consensus at 1%, and this still points to any impending economic strain on the horizon.
This gap between the Fed forecast and consensus expectations from the market might imply additional vulnerabilities, and especially considering recent policies of tariffs. Investopedia analysis indicates that investment will most likely get hurt due to tariffs, consistent with negative net exports experience and increasing risk of stagflation. Existing literature for the economy of the 1970s, and the oil shock as well, suggests that recurring negative net exports and low residential investment tend to precede stagflation, which follows as long as inflation pressures are beyond 3%.
Peering ahead to the latter portion of 2025, the observers must monitor the trends of these indicators closely. With inflationary pressures increasing and estimates of economic growth diverging, the shares such as those of Nvidia (NVDA) and AMD (AMD) could remain undervalued amid growing demand for AI infrastructure against the background of macroeconomic pressures. Investors must be vigilant and search for cues from trends of residential investment and net export numbers as potential leading indicators of overall economic slowdowns.
U.S. Manufacturing Shows Signs Of Stabilization Amid Economic Uncertainty
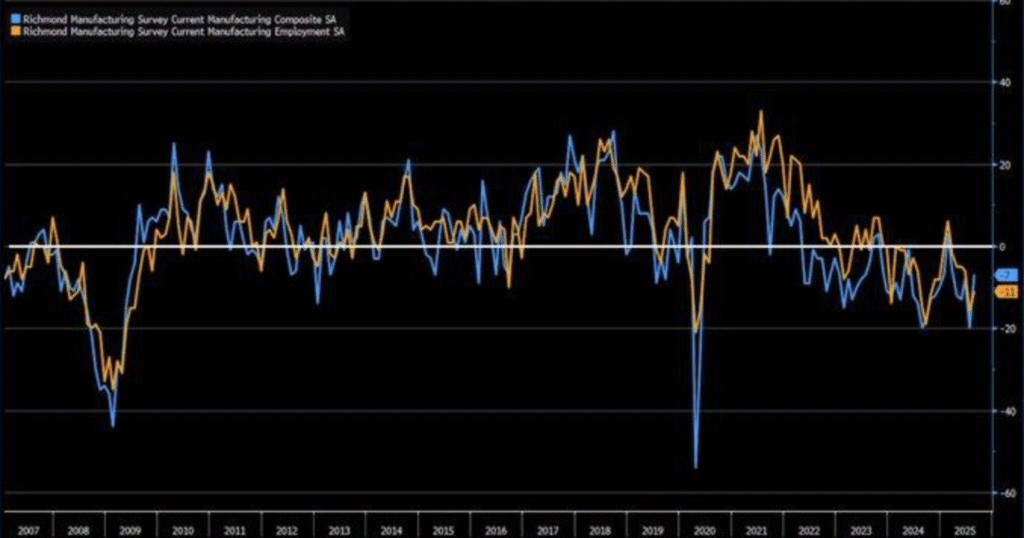
The Richmond Fed Manufacturing Index rose in August 2025 to -7 from the prior -20. Both this rise here and the rise in new orders to -6 from -25 are indications of possible stabilization in U.S. manufacturing even amid overall economic uncertainty. That a number over zero is a growth number and that a negative number indicates contraction is a distinction to remember, and that this rise could be an early signal of a turnaround.
This return follows from Journal of Economic Perspectives coverage of 2019 of why there is a correlation of 0.3 between GDP growth and manufacturing indexes and therefore, if there has been an uptrend seen for manufacturing, this can reflect economic growth. Cautiousness is, however, needed in the sense that the capex falling from -16 to -23 indicates that companies are still conservative with regard to the future of the economy. A slowdown of the economy follows most of these drop-offs of capex as seen from a 2023 NBER working paper and as such, are showing companies choosing caution with the uncertainty.
In the mixed signals of manufacturing, analysts will have new order and also capital expenditure data under close observation. Semiconductor stocks such as Tesla (TSLA) and AMB (AMD) are potentially under-priced on AI-led growth but manufacturing conservatism will have blowback impacts on supply chains and investment. In the very short term, manufacturing and indeed capital expenditure trends will remain key for highlighting any near-term risks of the economic estimate.
Consumer Confidence Decline Signals Increased Economic Uncertainty
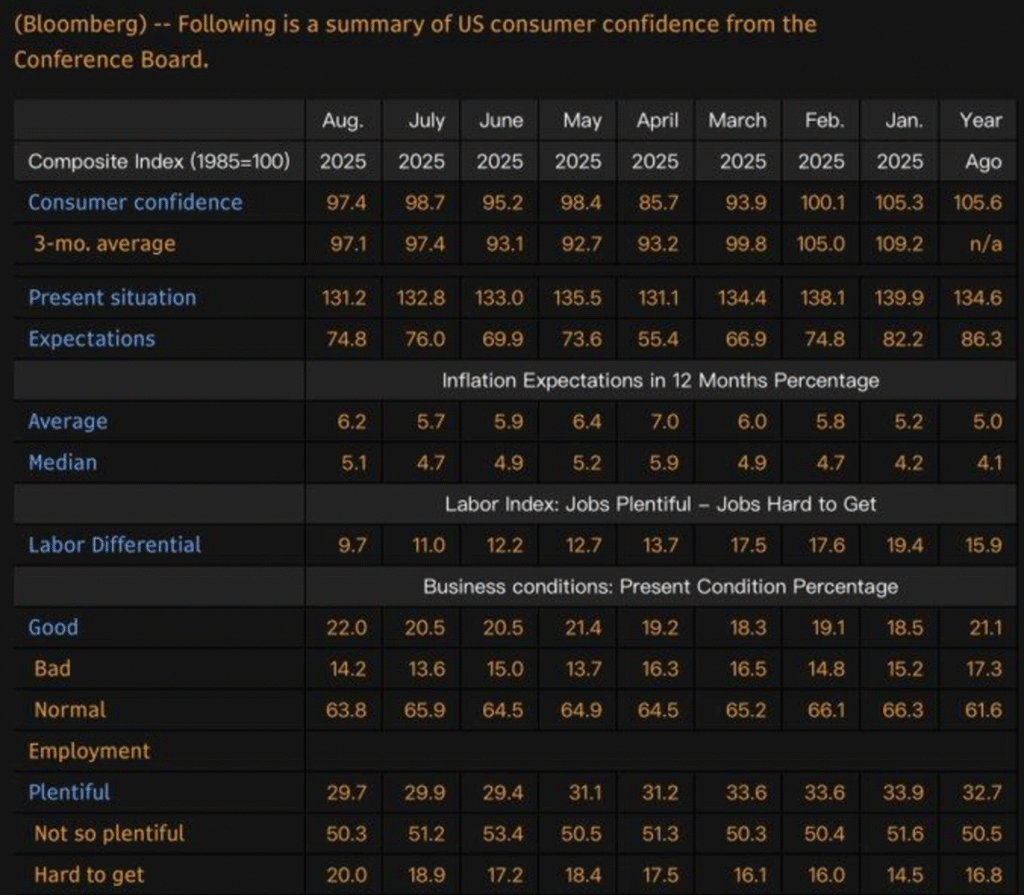
August 2025 Consumer Confidence Index dipped to 97.4 from 98.7, indicating growing concerns for American consumers. The decline was chiefly brought about by the decline of the Expectations Index to 74.8, a level that is typically considered to indicate recessions are probable as it is below the 80 mark. A National Bureau of Economic Research article printed in peer review confirms that such decreases in consumer confidence have preceded economic slumps 6 to 12 months prior, and indicates pointing towards less favorable economic conditions in the future.
This undermined confidence comes in the wake of the July 2025 jobs report posting a disappointing gain of just 73,000 jobs, well short of the forecasted 115,000. Also, newly imposed tariffs under the tenure of President Trump have driven inflation to 6.2%, from earlier optimism in 2025 to growing economic pessimism. While the Bureau of Labor Statistics reports a weakening labor market, this will continue to fuel consumer pessimism and bring about the overall economic slowdown.
Globally, the divergence of central bank policies adds further complexity. While the European Central Bank has cut rates at 2.00%, the Federal Reserve maintains a higher rate of 4.33%. As hinted at in the context of a 2023 IMF report, the type of monetary policies issued asynchronously has the potential for higher volatility and challenging the thesis of American economic exceptionalism. As such, analysts will need to examine critically consumer sentiment, inflationary trends, and labor statistics, since all will be pivotal in the context of becoming determinants of economic forecasts in the future. Shares of the kind of 3M (MMM) and Boeing (BA) that are AI infrastructural growth driven will most likely come to be undervalued as worries of the overall economy will hold back optimism in the market.
Strong Recovery In U.S. Business Investment During Uniform Economic Recovery
Core capital goods orders also climbed 1.1% month-to-month in July 2025, much higher than expected for 0.2% and making good on a faster-than-estimated gain for the United States business investment. That increase also rode the biggest monthly jump since April of 2023 for an increase of 0.7% for shipbuilding, as seen from data at the U.S. Census Bureau. Those readings show core resiliency, but sharply deviate from the overall durable goods order dropping 2.8%, largely on the heels of a steep decline for spending on transport sectors. That divergence indicates the patchy state of recovery for the economy now.
Despite the comforting rise in capital goods, tariff-induced cost pressures are indeed a concern. Reuters from 2025, August 26 stated that pressures remain due to the fact that margins are lower for the firms with higher input costs, i.e., tariffs, and thereby limiting scope for gains from expansions. Referring to historical trends of 2024, one can see core capital goods order has also shown its volatility as always the case with front-loading of tariffs. Once again, this reinforces that the recent peak need not necessarily always be interpreted as only a sign of sustainable growth.
Due to volatility of data with respect to capital goods, the analysts do not need to take the growth at face value. Reuters commented for its 2024 report that inflation in prices and not growth in volumes increases these figures and thus there is a need for analysis of underlying trends to determine the health of business investment. When it comes to undervaluation, companies like Caterpillar (CAT), Lockheed Martin (LMT), and 3M (MMM) can avail advantages of industrial dominance, whereas Nvidia (NVDA) and AMD (AMB) are star performers of the technology space because of AI and infra spends reliance. Tracking the Sustainability of these trends will prove to be critical in determining the future direction of the economic course of the U.S. nation.
Mixed Durable Goods Orders Signal Stabilization, But Risks Remain

July 2025 U.S. durable goods decreased 2.8%, less than predicted decreases of 3.8%. On top of this general decline, however, was the unexpected surprise of the 1.1% rise for core orders excluding transportation, which is found registering stability at the core of the manufacturing industries regardless of overall economic uncertainty. As the Census Bureau of the United States explained on August 26, the rise for core orders has in it possibilities of stability at the manufacturing sector level and provides reasons for optimism with current market volatility. In contrast, the transport segment declining sharply by 9.7% again has grave challenges ahead. Weakness in transport can be a symptom of continuing supply chain issues and prudence on the effects of tariffs, and this message has been reinforced according to Deloitte’s 2025 Manufacturing Outlook. The report explained that uncertainty related to trade for manufactures increased by 34.3%, which could guide company plans and preparations for future investment.
This aggregate data suggests that, as central sectors show resilience, overall risks persist. This rate decision for this coming September of 2025 might be affected via these trends, as Federal Reserve Chairman Jerome Powell, via recent remarks at the Jackson Hole Symposium, signaled the possibility for an interest rate cut if labor market risks were considered to outweigh those of inflation. These comments are consistent with the Fed taking a safe side as it monitors slower-than-forecast recovery for certain areas of the economy despite the United States Bureau of Economic Analysis observing 3.0% GDP growth rate for Q2 2025. This kind of rate decision would prove influential for trends for the future, as it potentially marks the start of further policies for supporting economic growth. Most underappreciated stock amongst analysts has been that of Caterpillar (CAT) with these developments. As the industrial behemoth, Caterpillar will continue reaping advantages of robust demand for manufacture, infrastructures, and constructions, all falling under the purview of durable goods order recovery. In spite of problems of the transport space, its level of diversifying towards application on an industrial scale and the long-term focus on infrastructural projects render it a safe bet for growth. Tracking the changing dynamics of the durable goods segment, especially transport and supply chains, and the next move of the Federal Reserve on its policies will remain key for defining lasting stability and its growth potential for the overall space economy.
Strong Equity Inflows Signal Confidence Amid Economic Uncertainty
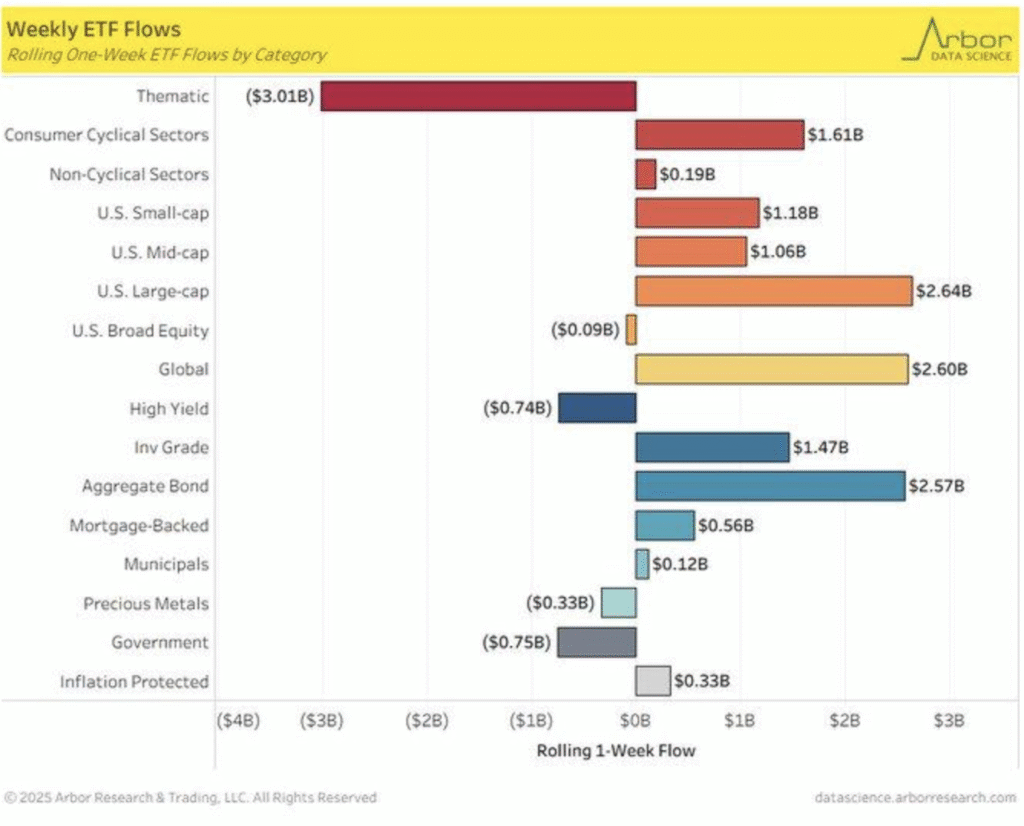
Current statistics report record $2.6 billion inflow into U.S. large-cap stocks for the last week, mirroring a broader trend of $31.6 billion of U.S. equity flows as it was reported on July 4, 2025, by Reuters. Although U.S. stock has remained mixed this year with $38 billion of redemptions, such flows are symptomatic of robust investor confidence. Rotation into large-cap shares can be a wager on stability in turbulent market conditions with stock market players opting for the perceived safety of established giants. The trend is a testament to the continuing faith for long-term destinies of U.S. stocks with prevailing pessimism about economic growth.
On the other hand, bond markets also registered bullish flows, with $1.78 billion flowing into aggregate bonds, which found support from the Bloomberg Aggregate Bond Index of more than $50 trillion of securities. Historical analyses, as the Journal of Finance article of 2023 has also found, have also concluded that such inflows have tended to come on so-called “flight to safety” when economic uncertainty has been the theme of the times, and that with sentiment weak due to worries regarding global trade tensions and other risks, funds are taking refuge in less risky assets. These thematic funds, nevertheless, saw maximum outflows as $3.18 billion exiting these niche funds. This exit from thematic funds might have been prompted by waning investor interest in specialized equity funds, especially with increasing global trade tensions observed in preliminary analyses of the markets for 2025. Analysts will therefore have to keep watch on large-caps and bond markets as very best leading indicators of investor mood for now. Johnson & Johnson (JNJ) presents as potentially under-priced stock with its secure market leadership position in healthcare as likely safe haven during uncertainty. Tracking these inflows and outflows will become necessary for establishing future direction of market confidence.
Consumer Buying Habits Reflect Largest Spending Preference During Economic Uncertainty
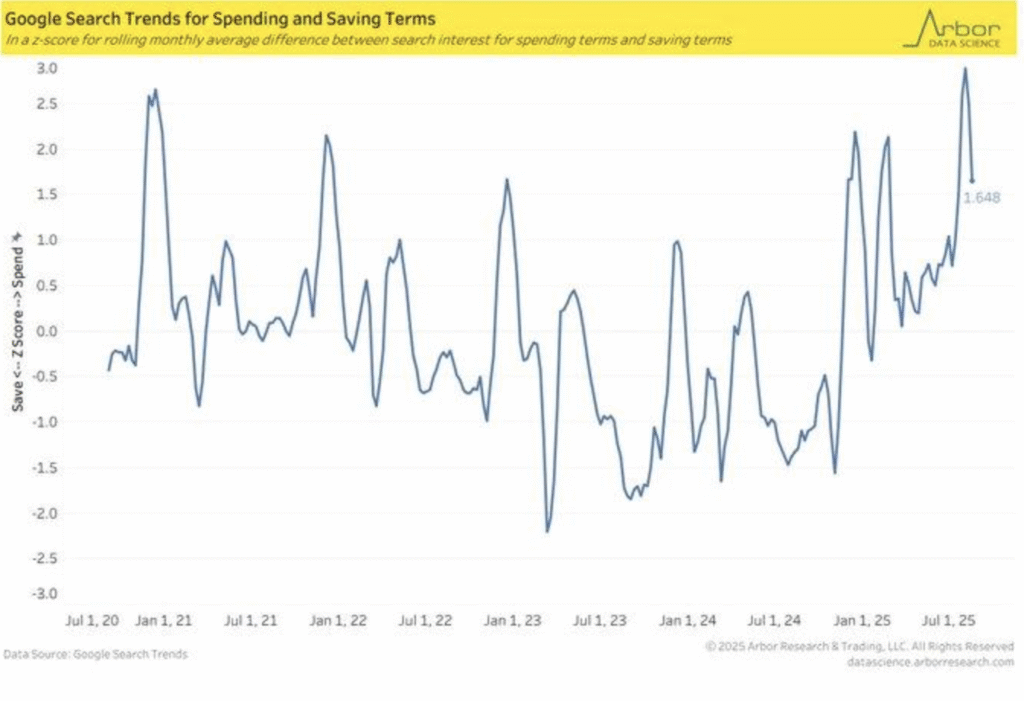
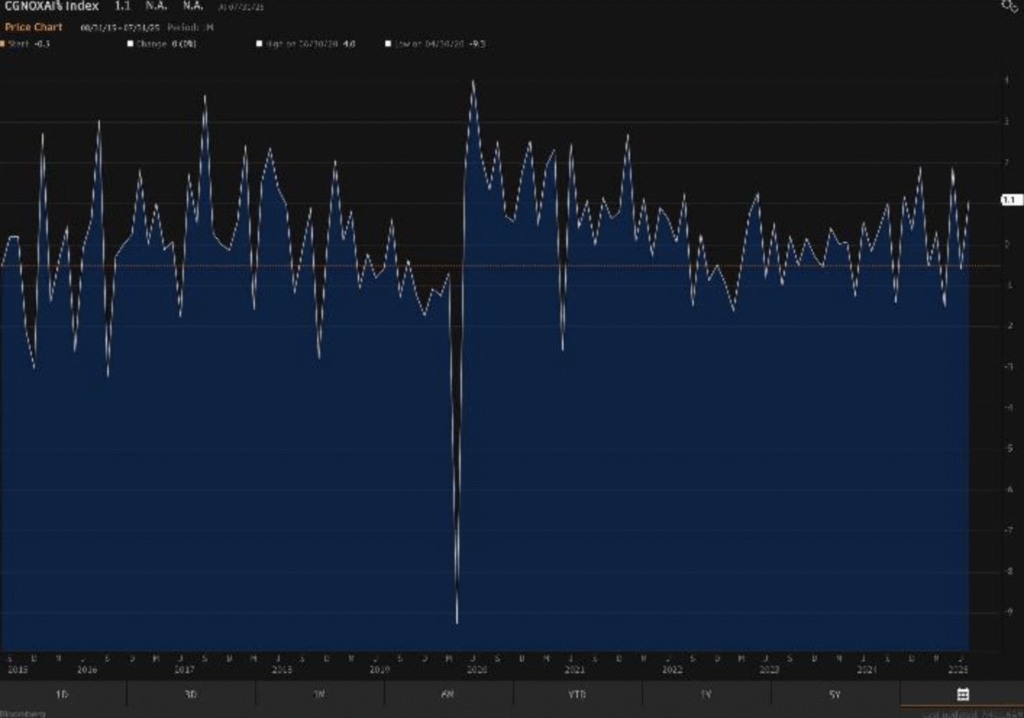
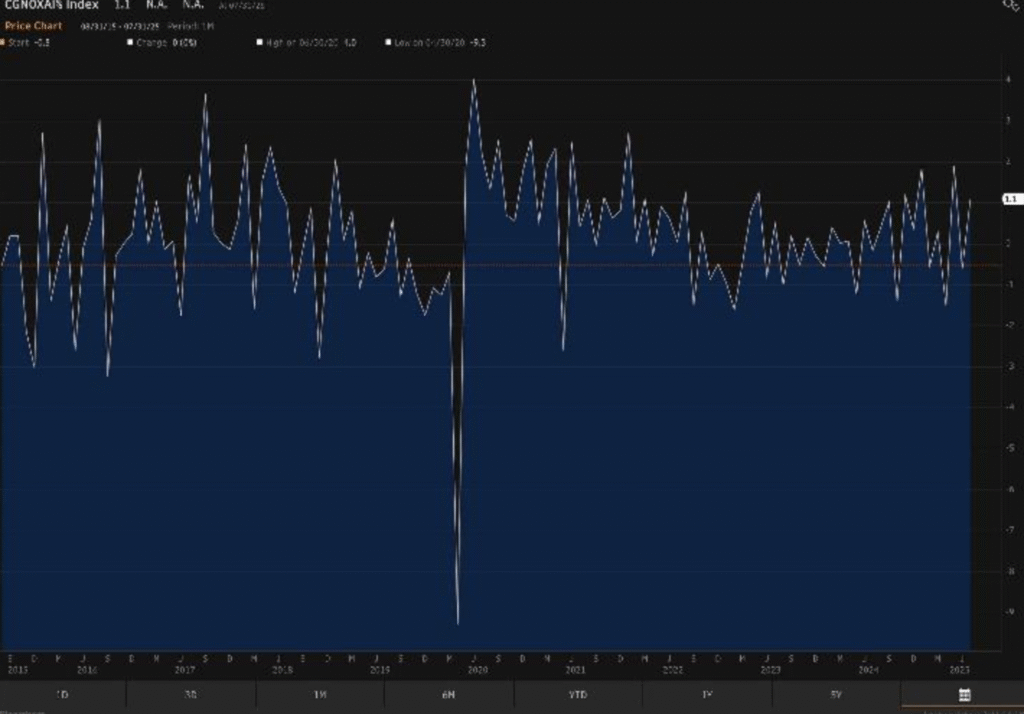
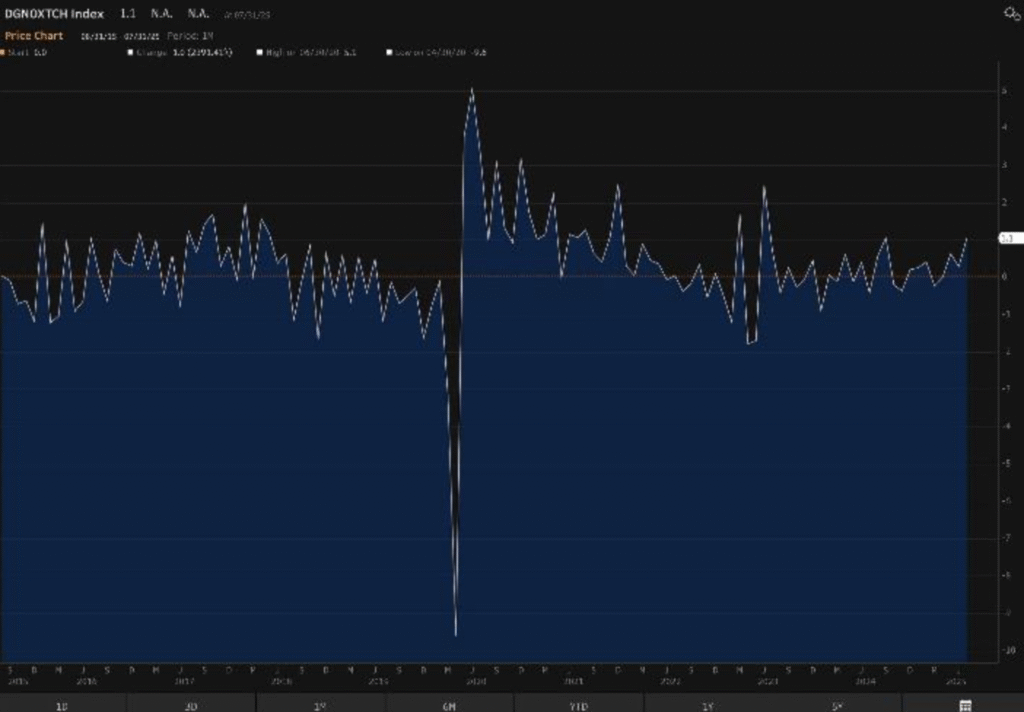
Recent data highlights a notable trend in consumer behavior, with a consistent preference for spending over saving since mid-2021, as evidenced by the positive spread in search interest for spending-related terms. This trend reflects a broader shift towards consumer expenditure, particularly among younger generations, with reports showing that their spending growth has outpaced previous generations by a significant margin, fueled by higher average household incomes at an early age. While these patterns suggest a robust spending-driven economic environment, they stand in stark contrast to the broader economic uncertainty that continues to surround the global market. The ongoing preference for spending, despite the looming risks, indicates a potential resilience in consumer-driven growth, which could sustain economic momentum in the near term.
But this sort of spending inclination contradicts general economic pessimism since search behavior is able to capture shifts of sentiment across the market. Arbor Data Science analysis suggests that such divergences in expenditure and savings wording can be an indicator of consumer confidence. A Journal of Economic Behaviour & Organisation 2023 study did, however, find that consumer savings interest trails spending interest by between 6-12 months in times of recession, and this could represent a timing lag of consumer caution even in times of weak economic performance. Although information from Google Trends provides an informative and new measurement for gauging consumer sentiment, the relationship between it and actual consumer behavior is moderate, as quoted from a 2021 peer-reviewed journal of the International Journal of Market Research (r=0.65). This caveat is that although the trend may be a sign of consumer jollity, it is not a point-to-point economic result for the future. Within these dynamics, Procter & Gamble (PG) is an undervalued stock based on consumer staple demand and its fortunate resiliency in the midst of volatility for discretionary expenditure. Analysts must take these mixed signals into account when forecasting future trends for markets.
Housing Market Cools As Price Decline Signals Shift In Demand And Supply Pressures
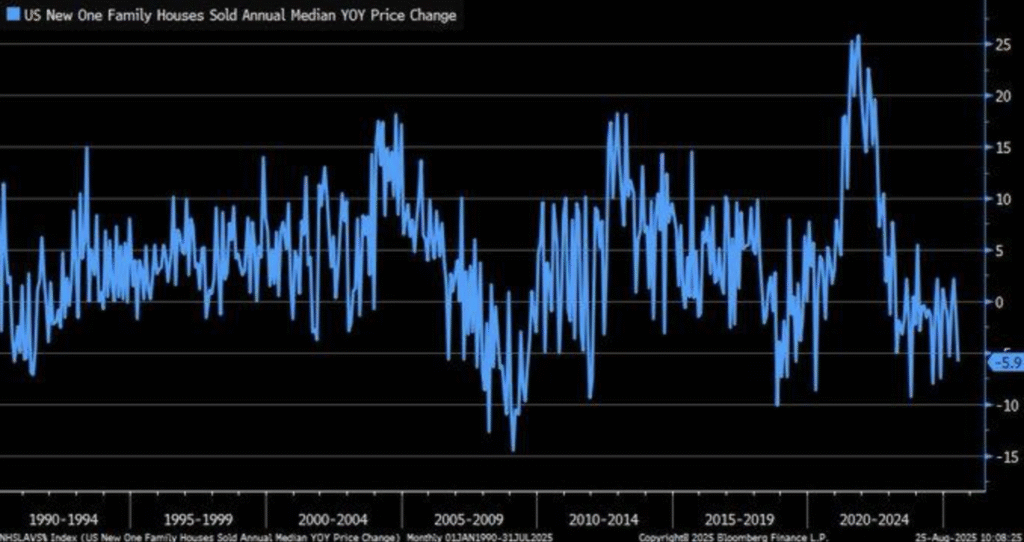
Most recent statistics show that new single-family residences suffered July 2025 median value drop year-over-year by 5.9%, followed by sales drop of 0.6%, for a total of 652,000 units. This is a cooling market for housing with a record inventory supply of 9.2 months, according to the United States Census Bureau. The simultaneous occurrence of falling prices and weaker sales is the fallout from surging mortgage rates that have put the lid on demand. This cooling contrasts sharply from the post-pandemic housing bubble, with low mortgage rates below 3% for the years of 2020 and 2021, which saw house prices surge up 48% from 2019.
This recent slowdown in housing sales and prices has subsequently been caused by mortgage rates of greater than 6.75%, which have decreased buying power and slowed housing market activity. A paper written for the Federal Reserve in 2023 agrees, writing that increases simply mean less housing market activity. As homebuyers’ mortgage expenses keep on climbing, many have chosen not to buy, which has been another cause of the slowdown. This trend also indicates the increasing challenge many customers face with affordability on the existing housing market, which mirrors overall economic stress. Regional variations also reflect patchy recovery of markets as sales improve in the Northeast and drop in the West. Regional variations are an indication of affordability pressures which might turn into further economic slowdown. Inventory level has marked an all-time high since 2020 as reflected from the National Association of Realtors, and this indicates that the supply-demand mismatch will not wither away any time soon. To analysts, patchy data indicates the likelihood of long-term slowdown as tighter mortgage rates and lack of affordability are driving the turn of housing dynamics. Tracking this cooling of the market and its implications for the broader economy will prove essential when it comes to making predictions regarding further trends of economic activity.
Decline In Housing Permits Signals Weakness in U.S. Market Amid Regional Disparities
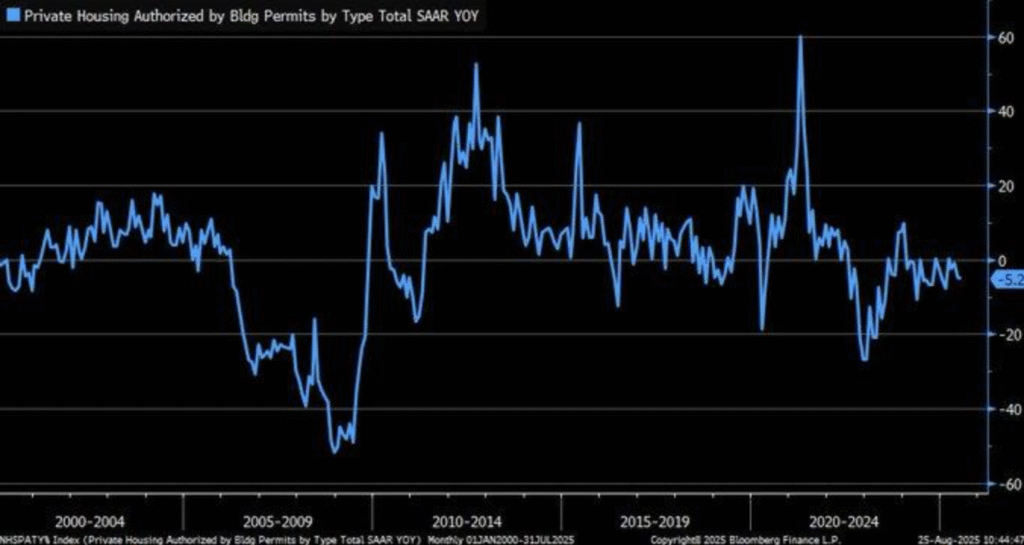
July 2025 figures indicate merely a 5.2% year-to-year drop in private housing permits and are indicative of United States housing market weakness. While the drop itself is cause for concern — housing permits are a forward-looking indicator of economic activity — and on average, as determined by the National Bureau of Economic Research, would lead overall economic downturns 6-12 months prior, it is consistent with broader trends seen in United States Census Bureau housing data and indicates recent cooling of the housing market may foretell an early warning sign of economic difficulty on the horizon.
This US building permit fall is contrary to better trends elsewhere, like the 1.3% UK house price rise reported by Zoopla in July 2025. Regional economic disparity between the US and the UK may be due to various monetary policies, like the US Federal Reserve keeping interest rates steady for the fifth time in a row during July 2025, under political pressure. Whereas prices have risen in the UK, the US market provides cooling situation due to rising mortgage costs and a fall in demand. Lag effects of lower housing permits on GDP, as estimated by the National Bureau of Economic Research, imply that slowdown of the United States housing market has the potential of converting into overall economic slowdown unless corrected. Because housing permits are always signifying future constructions of buildings as well as economic cheer, lower permits have the potential of signaling slowed economic performance ahead as the leading indicator. Analysts must watch this trend as the risk of slowdown has very serious implications on the overall economy and requires policies for correction of declines ahead.
Upcoming Economic Events
Leading up to the next few days, there is no doubt that the next batch of economic reports would be crucial in assessing the path the United States economy is headed. There is nothing significant on the economic docket for today, and everyone will look immediately to the reports next day, which will better reflect the markets’ mood and could possibly impact upcoming policy measures. Look ahead to tomorrow’s releases with the market looking for cues on top data releases.
Stock Market Performance
Indexes Make More Notable Moves Above April Lows, But Underlying Weakness Persists
U.S. shares have recorded significant advances since the low point of the market on April 8th, with blue-chip benchmarks recording strong gains. But underlying the strong tops are patchy market breadth, and recent declines still are uncovering hidden weaknesses. Although headline benchmarks are robust, looking at the detail reveals ongoing volatility, concentration risks, and patchy sectoral participation.
Below are additional information regarding present performance of major indexes:
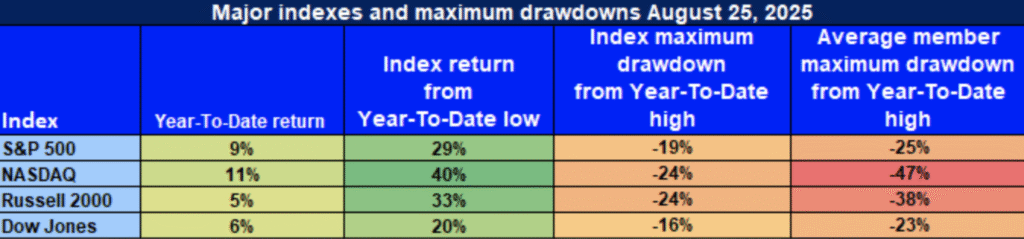
S&P 500: Strong Rebound, Narrow Participation
YTD: +9% | +29% below April low | -19% below YTD high | Avg. member: -25%
It is up 9% year to date and risen 29% since April lows, indicative of good headline recovery. Its strength is not broadly founded with the index falling 19% from its year-to-date highs. Because its mean constituent also fell 25%, S&P 500’s strength to date still lies in select large caps and thus still bodes risk of low participation and cautions outside of leaders.
NASDAQ: Tech-Heavy Index Conceals Member Weakness Beneath
YTD: +11% | -40% below April’s low | -24% below YTD’s high | Ave. member: -47%
NASDAQ has led the rally, up 40% from April lows and 11% year to date. Even with those top-line figures, the index has retreated from its YTD high down 24%, and the constituent mean has fallen 47%. That indicates there has been widespread divergent performance between top tech leaders and overall participation and, therefore, underlying weakness in growth areas.
Russell 2000: Small Caps Demonstrate Strength, Optimism Narrows
YTD: +5% | -33% below April low | -24% below YTD high | Member average: -38% Small-cap shares have increased by 33% since April but their year-to-date performance is somewhat subdued at +5%. Falls of 24% from highs and median member declines of 38% suggest that sentiment remains cautious, with smaller risk-sensitive stocks suffering brutal headwinds and poor liquidity. This suggests there is still fragile confidence in the small-cap universe, even after a strong rebound in April.
Dow Jones: Defensive Positioning Provides Cover
YTD: +6% | +20% below April low | -16% below YTD high | Avg. member: -23% Best performer of the year has been the Dow Jones, with a year-to-date return of 6% and 20% since its April lows. Its defensive makeup has blunted the impact of volatility in the market, having declined by a less harsh 16% from highs. Nevertheless, its average constituent has lost 23%, as the defensive tilt of the index has not been adequate to protect it from overall pressure.
At Zaye Capital Markets, we continue to be disciplined as an investor—preferencing strong balance sheets, defensive earning profiles, and prudent risk-taking from outperforming areas. While the recent rally is gratifying, the one-sided market breadth reminds us that we have to be choosy and keep our eyes on key indicators as we determine the sustainability of the rally and seek evidence of a stronger, broad-based expansion. The environment calls for caution and continued vigilance on risk management as we navigate the subtleties of the market.
The Strongest Sector In All These Indices
Communication Services Leads, Industrials and Tech Follow Closely
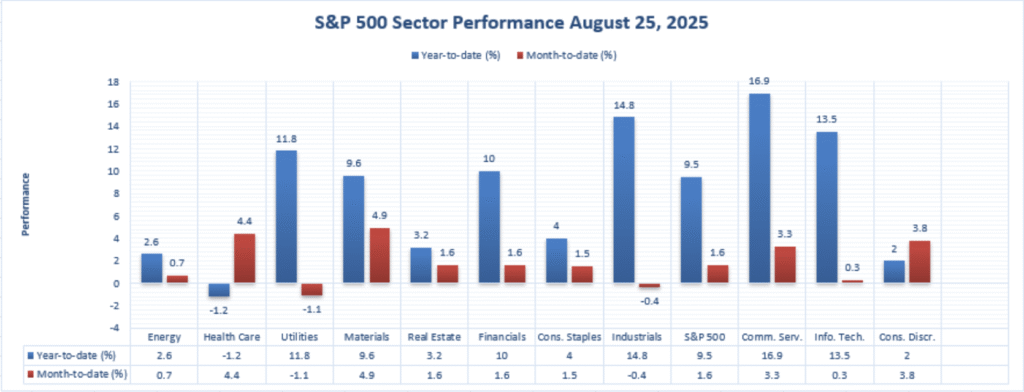
Industry trends for the year 2025 have witnessed sharp divergences with leadership resting heavily on individual corners of the market. Communication Services has continued leading the S&P 500 horizon on year-to-date basis as have double-digit return rates for Industrials and Information Technology. Leadership has also changed on month-to-month basis with surprising strength in Health Care and Materials.
Here are the particulars of best-performing industries as on recent performance:
Year-to-Date Leaders
- Communication Services: +16.9% — This year’s top sector, which has been boosted on the back of media and platforms resilience.
- Industrials: +14.8% — Closely followed, benefiting from cycle momentum and increasing demands for capital goods.
- Information Technology: +13.5% — Technology has been a prime growth contributor, with double-digit YTD performance amidst overall volatility.
MTD Leaders
- Materials: +4.9% — Focusing on commodity-related momentum, Materials has done well during August.
- Health Care: +4.4% — A strong recovery this month, the highest of any of the sectors with stronger investor demand for defensive growth.
- Consumer Discretionary: +3.8% — Advances due to consistent demand from consumers with pressures from increasing costs.
By and large, Communication Services has been the year-to-date top performer at +16.9%, while the biggest month-on-month gainers are the Health Care and Materials sectors. At Zaye Capital Markets, we note that this divergent performance reflects selective leadership—through tactically rotating stock selection as growth-led sectors are offset by defensives with prevailing macro uncertainty.
Earnings
Earnings Recap: August 26, 2025
- MongoDB, Inc. (MDB)
MongoDB reported a remarkable quarter with an adjusted EPS of $1.00, a significant reversal from a loss in the previous year. The company posted $303 million in revenue, marking a 24% year-over-year increase. MongoDB also raised its full-year revenue outlook, now expecting between $1.17 billion and $1.18 billion, signaling strong growth momentum. Despite this positive performance, shares surged over 30% in after-hours trading, reflecting investor optimism, particularly driven by the demand for its database services in AI and cloud computing. The company’s guidance further indicates robust demand ahead, particularly for its Atlas service.
- Okta, Inc. (OKTA)
Okta delivered strong results with an adjusted EPS of $0.91, beating the consensus estimate of $0.84. Revenue came in at $728 million, a 13% increase year-over-year. The company raised its full-year revenue forecast to $2.875–$2.885 billion, signaling confidence in its identity management solutions. The ongoing demand for secure identity solutions in the face of growing cybersecurity challenges, particularly with AI advancements, helped drive growth. Investors remain focused on Okta’s ability to maintain strong customer acquisition and retention rates, as the company continues to benefit from the ongoing digital transformation across industries.
- Atour Lifestyle Holdings Limited (ATAT)
Atour Lifestyle posted $345 million in revenue, a 37.4% increase from the previous year, signaling strong growth. The company reported a net income of $2.5 million, a significant improvement from the prior year’s loss. This performance was driven by expanding hotel and retail operations, along with increased technology investments to enhance customer experience. The company raised its full-year revenue growth forecast to 30%, reflecting confidence in its growth strategy despite ongoing market challenges. Atour’s performance highlights resilience in the face of economic uncertainty, particularly in the retail and hospitality sectors.
- Box, Inc. (BOX)
Box reported a GAAP EPS of $0.05, down from $0.10 in the same period last year. However, the company’s revenue for the quarter came in at $295 million, a 6.45% increase year-over-year. Box’s non-GAAP operating margin improved to 28.6%, reflecting efficient cost management. The company also raised its full-year revenue outlook, now projecting between $1.17 billion and $1.18 billion. Despite the decline in GAAP earnings, the company’s consistent revenue growth and margin expansion were seen as positive signals, especially in the context of the growing demand for cloud-based collaboration and document management solutions.
Upcoming Earnings: August 27, 2025
- NVIDIA Corporation (NVDA)
NVIDIA is set to report earnings, and investors will be closely watching its performance in light of the growing demand for AI chips, particularly its Blackwell architecture. As a leader in the semiconductor industry, NVIDIA’s earnings are seen as a key indicator of broader trends in AI and technology. The company’s outlook will be crucial, particularly given recent concerns over U.S. export restrictions to China, which could impact its sales. If the company exceeds revenue expectations, it could further fuel optimism about the AI boom and its leading position in the sector. Conversely, weaker-than-expected earnings may raise concerns about the impact of geopolitical tensions and regulatory challenges on growth.
- CrowdStrike Holdings, Inc. (CRWD)
CrowdStrike is expected to report approximately $1.15 billion in revenue, marking a 19.2% year-over-year increase. The company’s Annual Recurring Revenue (ARR) is projected to reach $4.64 billion, up from $3.86 billion in the previous year. Investors will be focused on CrowdStrike’s ability to sustain its growth in the cybersecurity space, particularly with its leadership in endpoint protection and identity security. A strong performance could reaffirm its position as a leader in the cybersecurity space, while any signs of slowing growth may prompt concerns about the competitive landscape.
- Snowflake Inc. (SNOW)
Snowflake is anticipated to report $1.0 billion in revenue, reflecting a 26% year-over-year increase. The company’s product revenue is expected to reach $996.8 million, marking similar growth. Snowflake’s performance will likely be driven by strong customer retention and expansion, with the company expected to report a net revenue retention rate of 124%. The market will be looking for signs of continued strength in its cloud data warehousing business, and any upside in revenue could further solidify its growth story in the cloud computing space.
- Veeva Systems Inc. (VEEV)
Veeva Systems is projected to report approximately $805 million in revenue for Q2 FY2026, reflecting solid growth. The company’s performance has been strong, with shares rising nearly 45% over the past year. Investors will be focusing on Veeva’s continued momentum in the cloud-based software market, particularly its position within the life sciences sector. Despite a relatively high valuation, analysts remain positive on the company’s long-term prospects. Any signs of continued strong demand for its products, along with an update on its expanding product suite, will likely reinforce confidence in its growth trajectory.
As these companies report their earnings, investors should keep a close eye on the revenue growth, guidance, and any updates on market trends that could provide insights into the broader economic landscape. Each of these earnings reports will offer valuable insights into sectors that are critical for economic recovery and growth.
Stock Market Recap – Wednesday, August 27, 2025
US shares opened the day on a subdued note as market players took lead from economic metrics, geopolitical developments, and weakness in the technology sector. S&P 500 and Nasdaq Composite dropped as they were muted by across-the-board declines for large-cap technology shares, while Dow Jones Industrial Average was resolute following gains in defensive sectors like healthcare and utilities. The Russell 2000 also dropped as traders were cautious on the small-cap space, which has been under pressure on account of rising interest rates and economic fears.
Stock Prices
Economic Indicators and Geopolitical Developments
Today’s market risk-off mood is a result of economic uncertainty and international tensions in politics. There are no major announcements on today’s economic calendar apart from investors waiting impatiently for future releases of data, including GDP growth and inflation levels. President Trump’s agenda on trade and tariffs is also creating market volatility. Escalating uncertainty on China relations and increasing regulatory attention on the tech sector is fueling the risk-off mood, especially in growth-sensitive stocks.
Latest Stock News
- $UNH Criminal Investigation Spills Over Into Non-Medic
UnitedHealth Group ($UNH) is facing broadening criminal investigations that are spreading outside of its Medicare operations. There are regulatory risk implications for the company from news of the investigations and ones that have wider repercussions for healthcare as a whole. That has compelled the stock lower for the day, consistent with investor concerns about legal risks and regulatory attention.
- $GOOGL Unveils New AI Learning and Communication Features
Alphabet ($GOOGL) has made new AI-driven products that will boost learning and communications. The products consist of AI-driven personal learning features and real-time language practice, and they are expected to put pressure on competitors such as Duolingo ($DUOL) as the fight for the AI-driven education and language learning market increases. The stock market watches with keen interest as the products will have an impact on Alphabet’s presence in the expanding AI and education technology marketplace.
- PolyMarket Forecasts 50% Chance Ethereum Reaches $6K This Year
PolyMarket has forecast Ethereum ($ETH) with 50% probability of reaching $6,000 at year-end 2025, and this has stirred up the crypto space. A development of this nature for Ethereum will take associated assets such as Bitman (BMNR) beyond $100, which will register strong acceleration momentum developing for crypto assets. Ethereum has drawn interested observation from investors with its massive implications for the crypto and blockchain space as a whole with its conduct.
- $AEHR Emerges as the Newest Multi-Bagger in the Small-Cap Portfolio
Aehr Test Systems ($AEHR) has now joined the new darlings of the small-cap world as its stock has jumped as much as 150% in recent times. Long-term growth potential, especially for semiconductor test for AI use, has been attracting investor interest. As the semiconductor AI space keeps moving its relentless upward trajectory, Aehr’s recent rally has drawn the attention of the small-cap investment community as many are expecting space for further rise.
The Magnificent Seven and the S&P 500
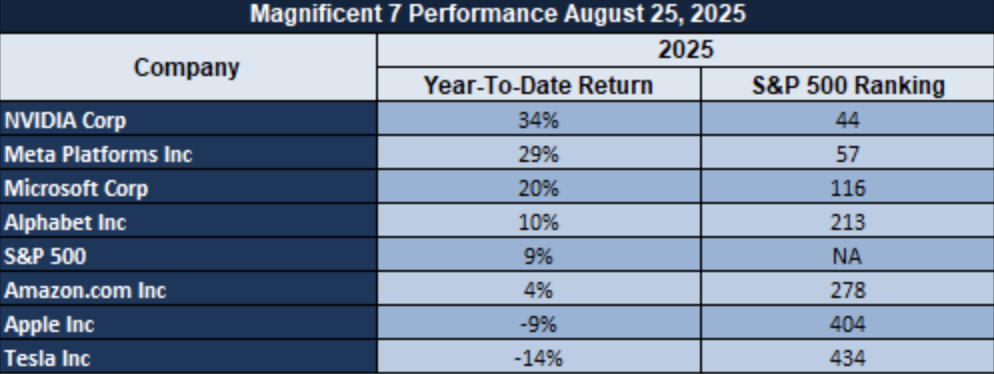
Apple, Microsoft, Nvidia, Amazon, Meta, Alphabet, and Tesla’s so-called “Magnificent Seven” are never before under such stress, with these blue-chip giants suffering greater-than-18% drawdowns from recent highs. Tesla and Meta are pacesetters of the declines, symptomatic of the valuation correction running ahead of its fundamentals. Nvidia, still a point of contention given its leadership status with AI, remains an investor fixation ahead of its upcoming earnings report. As these names appear played out, the S&P 500 becomes ever more dependent on the thin roster of mega-cap names and due for correction if these leaders do not turn around.
Major Index Performance on Wednesday, August 27, 2025
- S&P 500: At 5,841.52, down 0.4% on the day.
- Nasdaq Composite: Down at 18,220.78, -0.6%, due to pressure from weakness among
- Dow Jones Industrial Average: +0.2% at 41,182.34, with advances for defense sectors
- Russell 2000: Down at 2,147.63, owing to the rate sensitivity of the small cap.
We are also still selective and conservative in our stock selection and risk management at Zaye Capital Markets. Additional rotation out of the growth stocks and potential volatility in the large-cap tech names call for caution. We remain vigilant for sector rotation and a shift in the dynamics of the small-cap and tech markets as we move towards September.
Gold Price – Wednesday, August 27, 2025
Gold price sits at approximately $3,389.41 an ounce and higher compared to the previous close by 0.70%. Numerous factors are at its heels, with the surging investor appetite for safe-havens leading the list. Political instability, of which United States President Trump’s recent removal of Federal Reserve Governor Lisa Cook has been central, has rocked the markets. These have fanned loss of control of the Federal Reserve and its future direction concerns, with consequent overall volatility of the markets. As such, now investors are becoming increasingly willing again to turn to gold as the stable store of value now that risk-off appetite quickens. Besides, hopes are gaining ground on the likelihood of the Fed reducing interest rates at the next scheduled meet due for the month of September. With good likelihood of up to 0.25% rate reduction, gold will have fewer opportunity costs and hence enhance its appeal as a non-yielding asset. Technically, gold is now testing key resistance areas around $3,400. If gold can manage to get through that and hold its ground, it will set the stage for further upside, potentially new highs around $3,450. That said, if the momentum actually reverses, this will have prices coming back lower down towards support areas at $3,370 to $3,350. Geopolitical tensions still remaining elevated and economic uncertainties still building momentum see gold set up for increasing focus. The environment of potential monetary easing and continued global stress points further to the growth of gold as a safe-haven asset, which will provide robust support for the price. Investors will need to remain closely focused on these key drivers, as they will play an extremely influential role for the price action of gold in the weeks ahead.
Oil Prices – Wednesday, August 27, 2025
Today, oil prices have fallen slightly with Brent crude at $67.19 and WTI at $63.22 a barrel, showing the oil market’s intricate nature globally. President Trump’s recent comments favoring oil prices of $60 per barrel have affected sentiment with support of stable energy costs but geopolitical risks have gone up, especially with Trump announcing a tariff of 50% on Indian goods, which has the capability of destabilizing the world oil trade and hitting India’s consumption of cheaper Russian crude especially. The International Energy Agency (IEA) has gone ahead and bolstered its global oil supply outlook for 2025 with help from OPEC+ at the expense of production cuts and record increases by non-OPEC sellers but sluggish demand growth from key economies triggers risk of supply-demand mismatch and hence probability of prices coming down.
Geopolitical risk, and tensions specifically in the region of the Strait of Hormuz, are ongoing in causing market unease. News regarding U.S.-China trade and Trump’s hardening energy policy only serve to further muddy the market backdrop. Market analysts are also keeping a close eye on releases of economic data, with upcoming GDP growth and inflation data scheduled to affect estimates of oil demand. Although there could potentially be supply glut, market analysts are also scanning for any movement of monetary policy, specifically potential Fed rate cuts, that could affect oil prices. Overall, oil prices are exposed on both the supply side and wider global economic change, and caution will have to be used as geopolitical and economic risk continues to evolve.
Bitcoin Prices – Wednesday, August 27, 2025
Bitcoin is currently trading at approximately $111,140.50, reflecting a slight recovery of 0.40% from the previous day’s close. This comes after a significant drop earlier in the week, which saw Bitcoin fall below $110,000, triggered by a large-scale sale of 24,000 BTC by a whale. This move caused a sharp price decline and triggered liquidations across the market, highlighting the fragility of Bitcoin’s current price action. The volatility is compounded by recent political tensions, including President Trump’s dismissal of Federal Reserve Governor Lisa Cook, which has added uncertainty to the broader financial markets. However, the Trump administration’s pro-crypto stance, reflected in the launch of a new crypto venture with Crypto.com, may offer longer-term support for Bitcoin’s ecosystem, particularly if it leads to more favorable regulatory frameworks.
Yesterday’s economic data gave a mixed prognosis with some data looking strong and others suggesting potential slowing and thus risk-averse sentiment in the market. Such risk aversion is pushing investors towards seeking Bitcoin as an economic risk hedge. In the short term, today’s economic data, such as GDP growth and inflation, will be watched with keen interest. Better-than-expected figures will likely result in a risk-on sentiment, and this will cause Bitcoin’s price to surge, and worse-than-expected figures will result in flight to safety, which can expose Bitcoin to bearish forces. The market reacts very sensitively both to economic data and geopolitical news headlines, and this will continue to regulate Bitcoin’s price action in the short term.
Ethereum Prices – Wednesday, August 27, 2025
Price of Ethereum (ETH) at $4,576.31, up by 3.82% from previous close. This is consistent with the overall narrative of a whale and institutional investment-driven trend. Ethereum has dipped as low as $4,397.23 and as high as $4,629.92 in recent days, indicating immense market volatility. The rise of Ethereum price has come along with heightened institutional demand as evidenced through Ethereum ETFs. BlackRock Ethereum ETF, for instance, witnessed a net inflow of 67,899 ETH (about $314.9 million) on August 25, indicating robust institutional conviction in Ethereum as an asset class.
Apart from ETF inflows, also of high significance in terms of influencing Ethereum price action have been whale trades. Interestingly, BitMine Immersion Technologies, one of the bigger players in the cryptocurrencies, acquired more than 190,000 ETH as part of its weekly holdings, and that is more than 1.7 million ETH. That kind of accumulation is indicative of long-term strategic investment by larger players and can very much be indicative of bullish expectation of Ethereum price in the near term. Convergence between increasing institutional demand through Ethereum’s ETFs and whale trades indicates strong demand for Ethereum and hence the bullish sentiment and rise in its price.
