Where Are Markets Today?
European and U.S. stock futures are showing mixed signals as markets digest recent economic data and geopolitical developments. U.S. stock futures were little changed on Wednesday night, following Alphabet’s rally, which lifted the S&P 500 and Nasdaq Composite, even as growing fears around the economy weighed on equities. Dow Jones Industrial Average futures fell by 60 points, or 0.13%, while S&P 500 futures were unchanged, and Nasdaq 100 futures dropped 0.01%. Wall Street ended the session with a mixed performance. The S&P 500 and the Nasdaq Composite, both largely tech-heavy indices, gained 0.51% and 1.03%, respectively, buoyed by Alphabet and Apple shares. However, the Dow, with greater exposure to the real economy, dipped 0.05%.
The dual-pronged performance is an indication that technology stock gains in the wake of overall market weakness have been strong. Alphabet’s surge, after it won the reprieve on not being split up in an antitrust case, was welcome news for the technology sector. But these advances were dampened by disappointing labor market data. In its latest data on job openings released on Wednesday, the listings fell to lows which are not often seen even during the height of the pandemic, sparking fears of hiring slowdown as also overall economic activity. Stock futures advanced in Europe amid a subdued lead by Asian stock indexes, with investors maintaining tight attention on U.S. jobs market data and tariff news. The dollar dipped to a five-week low on the basket of currencies after market traders turned cautious ahead of major jobs data shedding further light on the health of the U.S. economy. Geopolitics, including perennial concerns over trade policies and oil prices, keeps adding further uncertainty in the markets. Investors maintain close vigil on how the developments in the U.S. and Europe would affect world economic trends, especially with the prospect of a U.S. rate cut or continuing tariff stress staying at the top.
The mixed performance in both European and U.S. futures reflects a balancing act between optimism in the technology sector and concerns over economic indicators and geopolitical tensions. As markets await further economic data, particularly labor market reports like ADP Non-Farm Employment Change, Unemployment Claims, and ISM Services PMI, investors remain cautious. The potential for economic slowdown is at the forefront of investor minds, and any negative surprises in upcoming reports could dampen risk sentiment and lead to volatility in both equity and currency markets.
Major Index Performance through Thursday, September 4, 2025
- S&P 500: Trading at 6,448.26, up 0.51% on the day.
- Nasdaq Composite: Currently at 21,497.73, up 1.02%, driven by tech gains.
- Dow Jones Industrial Average: Rose 0.05% to 45,271.23, led by the energy sector and the financial.
- Russell 2000: Relatively flat at 2,147.63, lagging on the back of rate sensitivity among.
The Magnificent Seven and the S&P 500
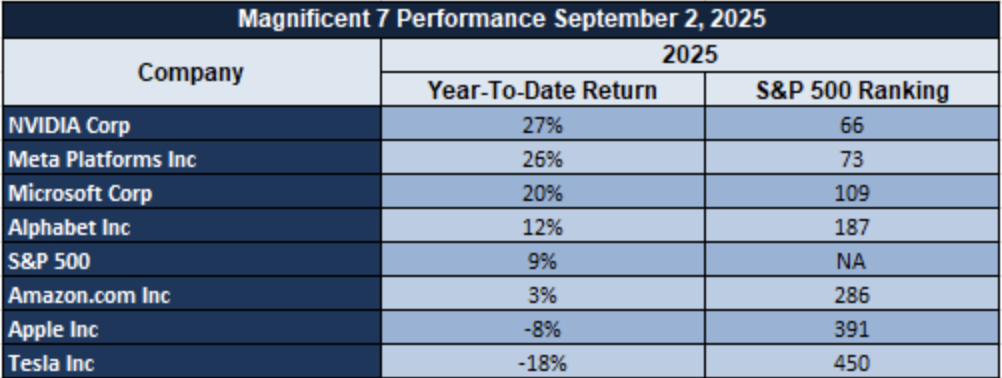
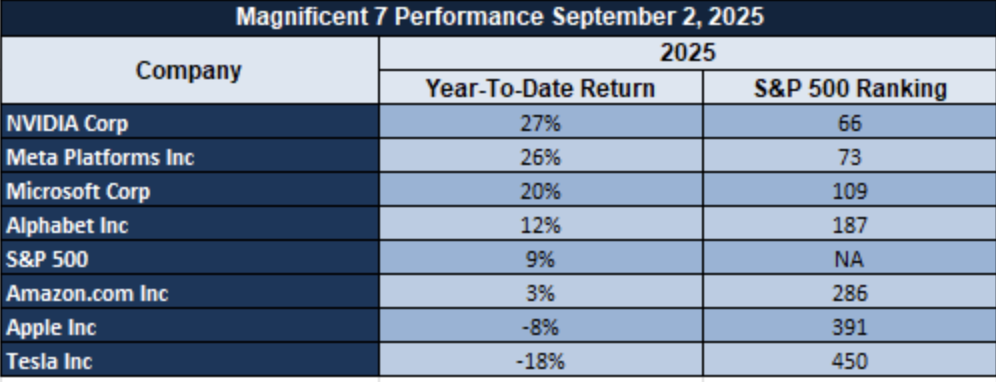
The “Magnificent Seven”—Apple, Microsoft, Nvidia, Amazon, Meta, Alphabet, and Tesla—are showing signs of fatigue. A recent sector breakdown shows the group averaging a drawdown of over 18% from their recent highs, with Tesla and Meta leading the decline. This signals a valuation recalibration, especially in AI-driven growth stories that have run ahead of fundamentals. The S&P 500 remains under pressure as tech leadership wavers. While energy and industrials are offering some support, the index is unlikely to rally sustainably without renewed participation from its core mega-cap drivers.
Drivers Behind the Market Move – Thursday, September 4, 2025
U.S. and European markets are showing mixed outlook today due to a combination of the data on the economy, geopolitics, as well as corporate earnings. With investors on high alert, these are the determinants resulting in the volatility in stock futures and market attitude. Economic data, including the less-than-anticipated job vacancies statistics, accompanied by geopolitics emanating from the utterings by President Trump, are making markets nervous. Let’s delve deeper on the major determinants affecting market performance:
1. Economic Data and Labor Market Concerns
The most influential factor on market sentiment these days is the weak labor market data. Recent job openings data drastically fell, dropping to the lowest level since the pandemic peak. This has led to worries about the health of the overall labor market, particularly when considering other economic indicators are easing down. The lower demand for employees might indicate a slowdown economy, prompting investors to tread cautiously. This has seen markets register uncertainty, with investors retreating on riskier assets pending the release of more comprehensive labor market data in future releases. Release of the ADP Non-Farm Employment Change as well as the ISM Services PMI, due for release, might also cement or ease these worries, determining the rest of the week’s sentiment.
2. Geopolitical Developments and U.S. Foreign Policy
Geopolitical tensions are also playing a significant role in shaping market sentiment today. President Trump’s recent comments regarding potential troop withdrawals from various countries, including his remarks about the U.S.-China relationship, have raised concerns about the future of global trade and stability. Trump’s hint at evaluating U.S. foreign military commitments has prompted questions about the stability of regions reliant on U.S. military presence. These statements add uncertainty to market outlooks, especially regarding global oil supply security and trade policies with China. His words suggest a potential shift in U.S. foreign policy, which could lead to more risk-off sentiment, especially in sectors sensitive to geopolitical tensions, such as energy, defense, and global supply chains.
3. Sectoral Earnings and Industry performance
Earnings reports are also driving market direction with mixed sectoral results. Technology stocks, especially names such as Alphabet and Apple, have recorded impressive performances following the win by Alphabet to avoid an antitrust breakup. Those tech gains have propelled the S&P 500 and Nasdaq, providing some cushioning for the overall market performance. However, industrials and consumer discretionary sectors are demonstrating slower growth. The split performance reflects the investor demand for growth stocks in areas such as technology, with other areas struggling due to input price increases and shortages of labour. With investors considering corporate earnings results, the concern will relate to how the businesses across the many sectors are addressing the current economic challenge and whether the growth is sustainable.
Finally, with market performance today driven by weak economic data, geopolitical risks, and mixed earnings for corporate companies, the next few days will decide whether the market worries will diminish or escalate. Markets are set for cautious trading with worries over the labour market as well as geopolitical risks with investors revising their forecasts.
Digesting Economic Data
The TRUMP Tweets and Its Implications
President Trump’s recent comments have once again stirred the political and economic landscape, with several key statements having broader implications for global markets and the U.S. economy. His remarks on the potential removal of U.S. troops from various countries signal a possible shift in foreign policy, which could impact geopolitical stability, particularly in regions with U.S. military presence. His suggestion of pulling back forces could lead to shifts in global alliances and affect defense and energy markets, particularly oil, where any perceived reduction in military commitment may trigger supply-side concerns and influence oil prices.
Trump’s focus on U.S.-China relations also carries significant weight for market sentiment. His comments about the Chinese military parade and his expectation to gauge the state of U.S.-China relations in the coming weeks could have implications for trade policies and the broader geopolitical environment. Any escalation in U.S.-China tensions could lead to renewed tariffs or trade restrictions, particularly affecting the tech and commodities sectors. On the other hand, a diplomatic breakthrough could ease market volatility, especially in the Asia-Pacific region, which is a critical hub for global trade and manufacturing. The continued focus on Russia, particularly regarding oil sanctions, also plays into the broader market dynamics. Trump’s comments about potentially entering the “second and third phases” of Russian oil sanctions hint at further tightening of global oil supply, which could send oil prices higher. This statement, paired with his support for U.S. troops remaining in Poland, could further strain U.S.-Russia relations and exacerbate existing tensions in Eastern Europe, raising concerns over energy security. Additionally, Trump’s remarks about Venezuela being a “bad actor” could signal a continuation of U.S. pressure on oil-producing nations, which may lead to geopolitical risk premiums embedded in commodity prices.
In total, the comments by Trump have generated an intriguing combination of risk and potential by world markets. Prospects for shifts in foreign policy, particularly military involvement, oil sanctions, and trade policies, may impact investor confidence, resulting in volatility in world markets. Investors will need to pay close attention to these, as they may have an impact on everything from the price of oil to stock market performance, specifically among markets that are exposed to world defense and world trade.
U.S. Manufacturing Orders Show Strong Resilience Amidst Global Supply Chain Shifts
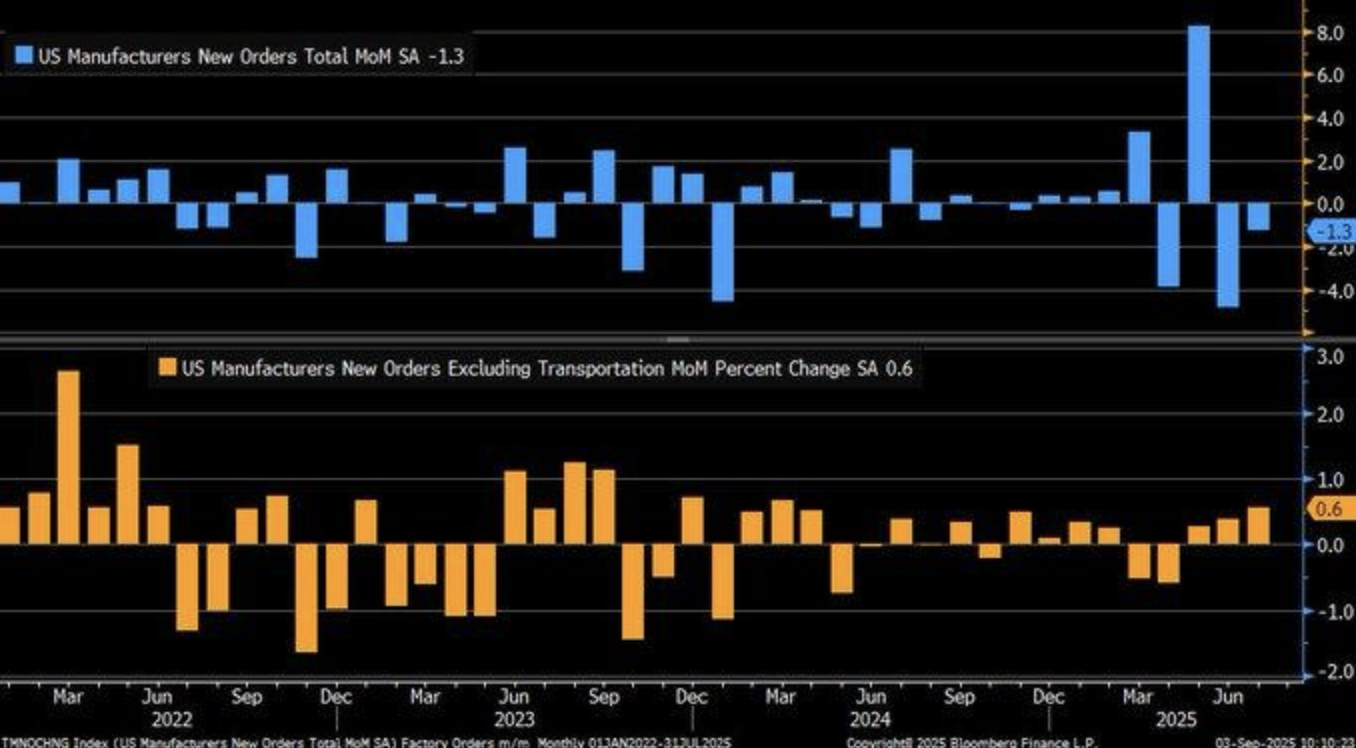
U.S. factory orders saw a -1.3% decline in July 2025, aligning with market expectations. However, the more significant takeaway was the +0.6% rise in orders excluding transportation, signaling robust resilience within core manufacturing sectors. This uptick reflects a broader trend in industrial stability, corroborated by a 2023 National Bureau of Economic Research study linking non-transportation orders to ongoing manufacturing health. The shift points to a recovery, particularly in tech and industrial goods, amidst the global supply chain recovery post-2024 disruptions.
In spite of the precipitous -4.8% June 2025 decline, the July data shows a remarkable reversal. Non-transportation order growth, recovering from the June +0.4% level, breaks the current story of generalized slowdown in manufacturing. This rebound hints at demand recovering, particularly in the tech sector as well as the energy sector, as shown by the data released by Bloomberg Finance that volatility has been present since 2023. Surprising July increase may indicate new demand for hi-tech and industrial goods, particularly by sectors relating to AI, energy infrastructure, as well as industrial technology, which have enjoyed expanding market conditions. It’s also key for analysts to home in on the technology and industrials sectors where these demand changes are most relevant. Nvidia (NVDA), with its market leadership in the industrial and artificial intelligence markets, benefits from the uptick in manufacturing orders. Tesla (TSLA), playing on both its energy segment as well as its manufacturing units, benefits the most. Investors need to see further non-transportation order growth, which would signal sustained economic growth particularly as the supply chain stabilizes across the world and adds to demand across these key sectors. This’s why technology stocks, along with energy stocks, are so attractive now.
U.S. Job Market Stability Hides Underlying Tensions in Key Sectors
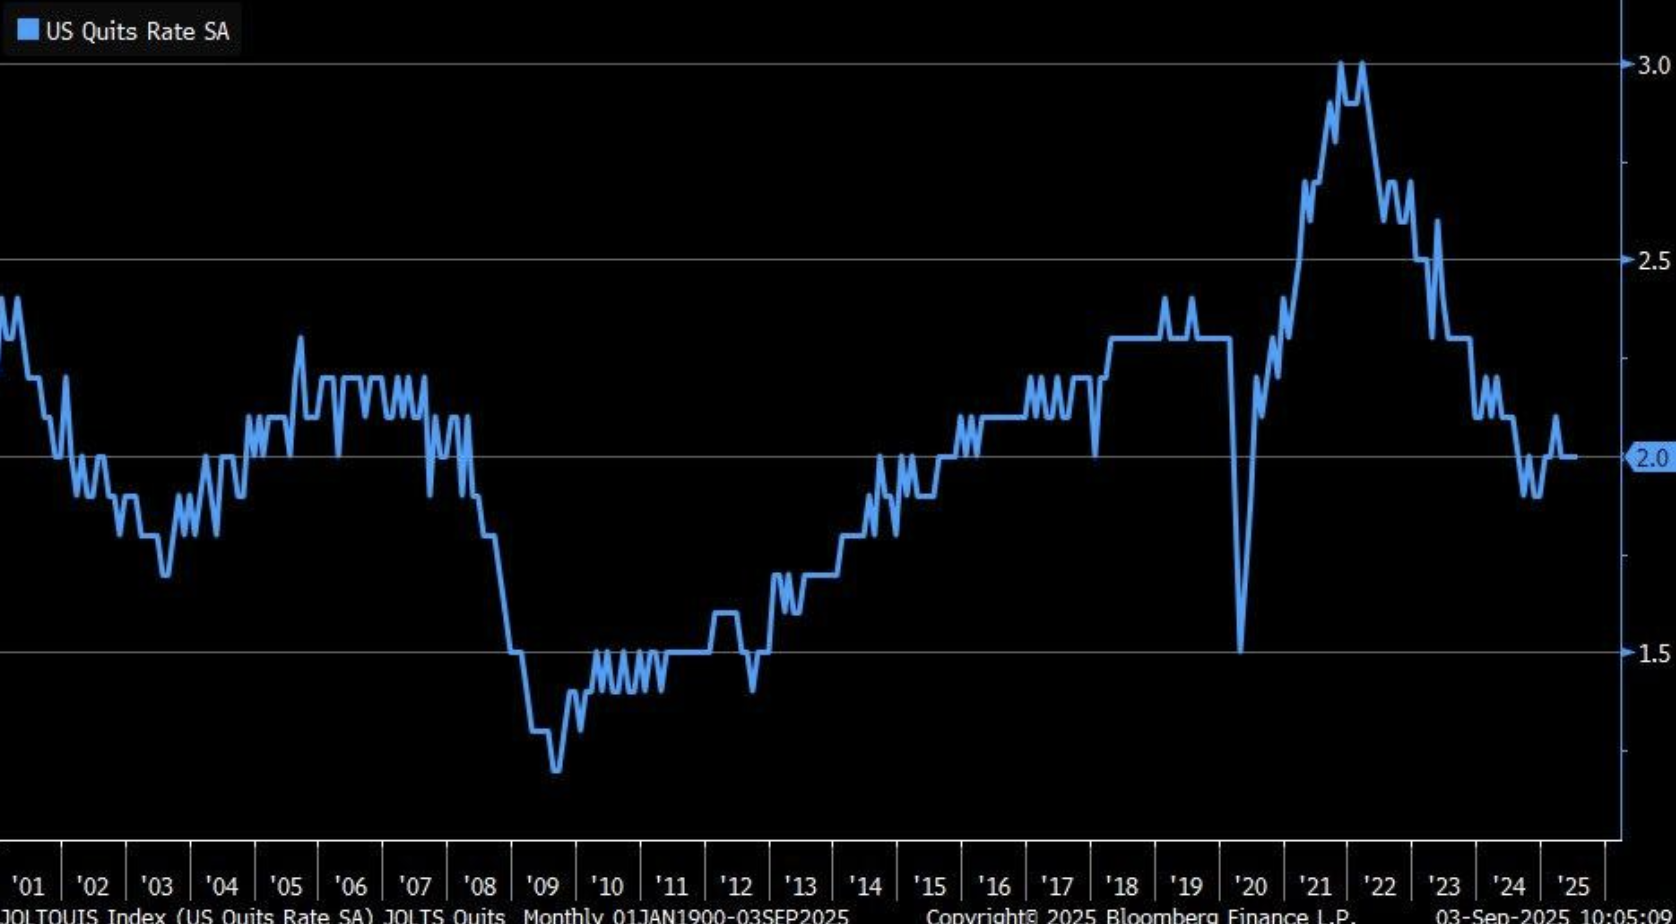
The JOLTS (Job Openings and Labor Turnover Survey) quits rate remained unchanged at 2% in July 2025, signaling a stable labor market amidst broader economic uncertainty. Bureau of Labor Statistics data revealed that both hires and separations stayed steady at 5.3 million, which provides confidence that the labor market is balancing itself despite earlier volatility. This consistency suggests a period of relative calm after the post-pandemic turbulence, where businesses are adjusting to ongoing shifts in employment and labor demand across various industries.
However, the flat quits rate may be obscuring deeper shifts in specific sectors, particularly in technology, where tensions surrounding remote work policies are intensifying. The 2023 National Bureau of Economic Research study underscores that while a stable quits rate may appear reassuring, it can sometimes mask underlying strains in key sectors. In tech, where debates about hybrid work models versus in-office demands have become a focal point, a stable overall rate may not fully reflect the pressures on employee satisfaction and retention in these industries. These tensions could potentially lead to higher churn or shifts in labor patterns in the coming months.
For investors and analysts, these dynamics offer key insights. Companies in the tech and remote work-driven sectors, such as Meta (META), Microsoft (MSFT), and other major players, may face unique challenges as they navigate evolving work structures and employee preferences. A seemingly stable quits rate could point to hidden labor market disruptions in these critical sectors, which may experience higher volatility than the broader economy suggests. As these trends unfold, analysts should stay attuned to shifts in labor market behaviors, particularly within the tech sector, where worker retention and satisfaction could drive future performance and market movements.
Growing Wage Divergence Signals Shifting Labor Market Dynamics
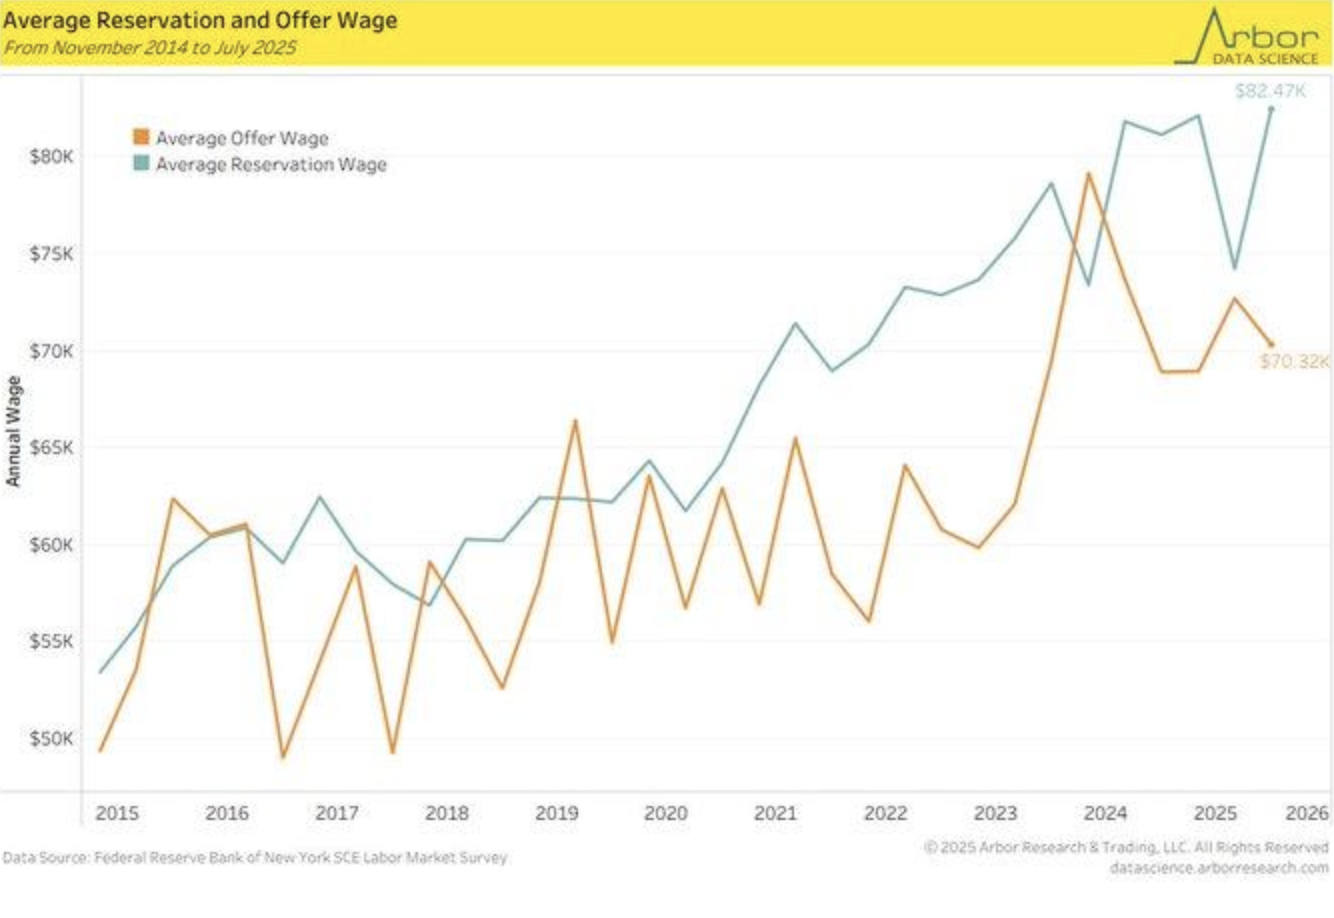
The New York Fed’s July 2025 consumer survey reveals a growing gap between the average reservation wage (what workers are willing to accept) and the average offer wage, which has recently peaked. This divergence highlights rising worker expectations amid persistent inflation pressures. A 2023 National Bureau of Economic Research study links this trend to increasing cost-of-living demands, suggesting that workers are adjusting their expectations in line with higher living costs, while employers remain hesitant to raise offer wages at the same pace.
This widening wage gap, observed since 2014, reflects a shift in labor market dynamics, influenced by the economic recovery and rising housing costs. For example, forecasts suggest a 3.7% growth in housing prices by June 2026, further exacerbating the cost of living. This trend challenges the idea of a swift return to pre-pandemic wage norms, signaling that workers may continue to demand higher wages, while employers struggle to meet these rising expectations, leading to potential labor market inflexibility.
From an investment perspective, this wage divergence could have significant implications for industries reliant on labor costs. Companies that are heavily exposed to rising wages, such as those in retail and tech, may face increased operating expenses. Analysts should focus on companies that might struggle with this wage gap, as rising labor costs could strain margins and profitability. These developments highlight the ongoing shifts in the labor market, warranting close attention from investors as they track sectoral performance amidst these evolving dynamics.
U.S. Construction Spending Faces Uncertainty Amid Stabilization Signs
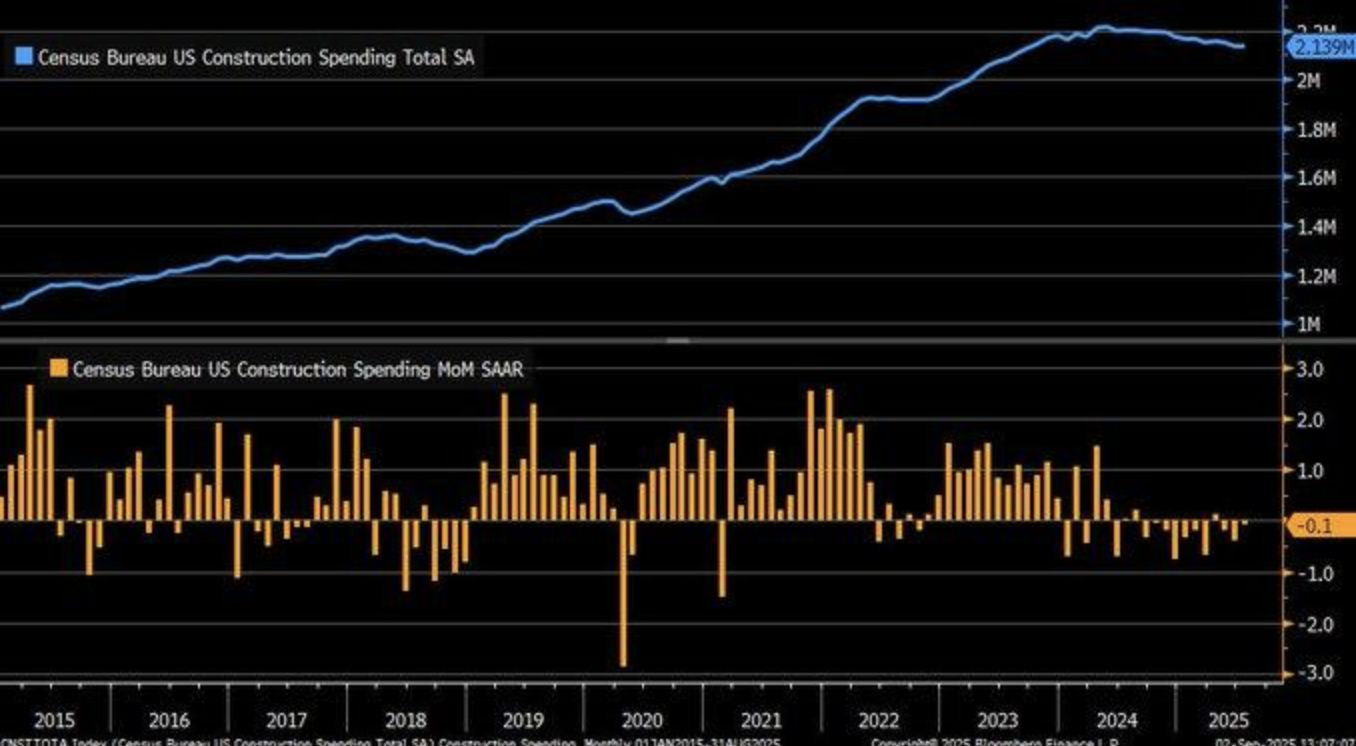
U.S. construction spending declined by 0.1% in July 2025, a smaller drop than the 0.4% decrease in June. This suggests a potential stabilization within the sector amidst broader economic uncertainty. Census Bureau data projects a robust $2.2 trillion in annual construction output for 2024, highlighting the sector’s enduring importance. While the July decrease is modest, the volatility seen in recent months underscores underlying challenges, including potential supply chain issues or labor shortages that are still affecting the sector.
The July decline contrasts with a 2023 study in the Journal of Construction Engineering and Management, which found that construction spending often correlates with interest rate changes. Given recent discussions surrounding Federal Reserve rate cuts, the sector could see a shift in growth trends if the Fed moves toward easing. Despite three consecutive months of declines, the sector’s reaction to future monetary policies may indicate a shift in momentum, although the current month-to-month fluctuations point to lingering uncertainty in construction activity.
With construction accounting for 4.5% of U.S. GDP and providing 8.2 million jobs in 2024, the sector’s performance is critical for broader economic health. Analysts should focus on companies in construction and infrastructure, such as Caterpillar (CAT), that are poised to weather these fluctuations. The ongoing labor shortages and supply chain disruptions highlight the need for companies to adapt to these market realities. Monitoring policy changes, such as potential Federal Reserve rate cuts, will be essential to understanding the future trajectory of the construction sector, particularly in how it impacts growth in construction-related industries.
Rising Raw Material Costs Signal Ongoing Inflation Pressures
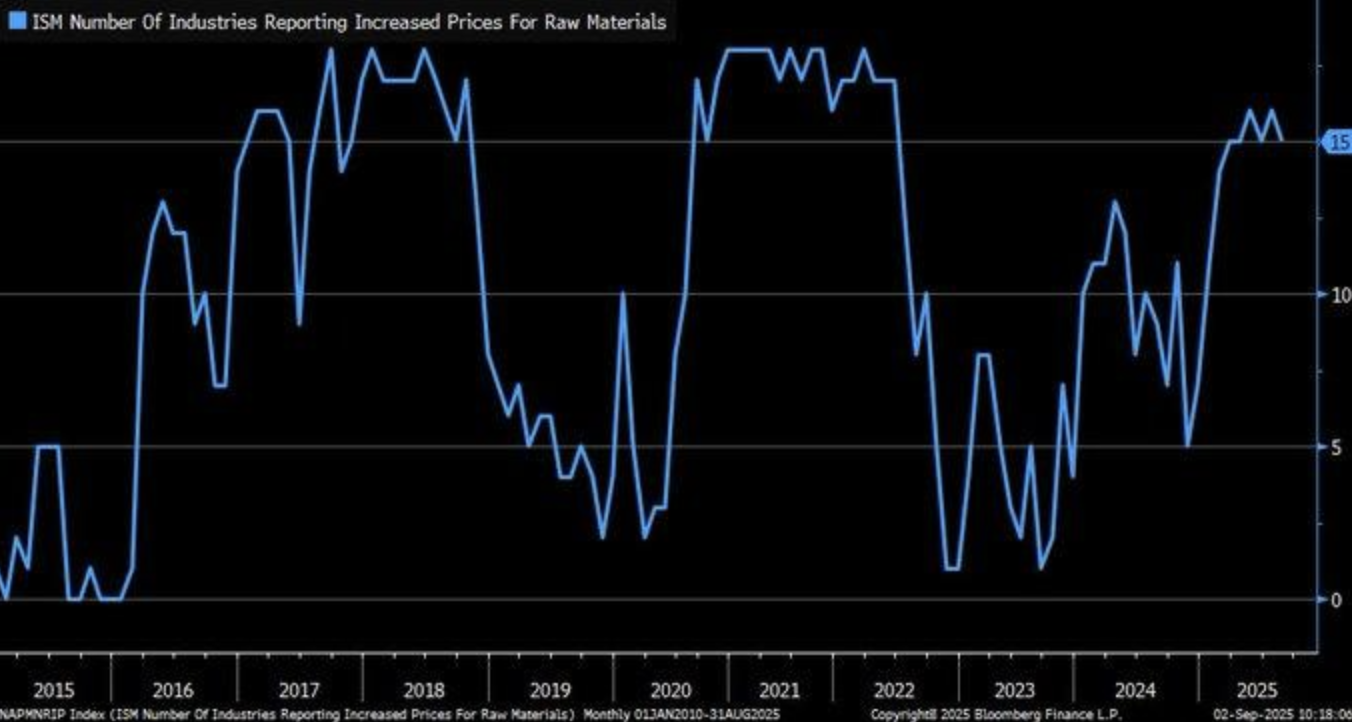
The ISM Prices Paid Index for August 2025 reveals a concerning trend, with 15 industries reporting rising raw material costs, pointing to persistent inflation pressures despite a broader economic slowdown. The ISM’s August report highlights a Prices Index of 63.7%, which reflects a significant increase in the cost of raw materials across multiple sectors. This uptick suggests that inflation remains a key challenge for businesses, even as overall economic activity shows signs of deceleration. Analysts should watch for further indications of inflationary trends that could signal longer-term cost pressures.
This increase in raw material prices is further supported by a 2025 Federal Reserve Bank of Boston study, which estimates that new tariffs, effective since February 2025, could contribute at least 0.5% to core PCE inflation. This suggests that recent trade policies, including tariffs, are exacerbating price increases in raw materials, pushing inflation beyond typical supply-demand dynamics. The surge in costs is not just a result of global supply chain constraints but is being actively influenced by geopolitical factors, as well as changes in trade policy.
Raw material price volatility has often been linked to geopolitical tensions or adverse weather events, as seen with the 2023 droughts that reduced agricultural commodity supplies. The current rise in prices may reflect these ongoing global disruptions. As these inflationary pressures persist, companies in sectors like manufacturing and energy, such as ExxonMobil (XOM) and Caterpillar (CAT), could face higher input costs that may erode profit margins. Analysts should closely monitor this trend, as it could affect the pricing strategies and bottom-line performance of businesses across industries that rely on raw materials.
Upcoming Economic Events
As we approach another crucial week of data releases, the markets are poised for significant movement based on key economic indicators. With the ADP Non-Farm Employment Change, Unemployment Claims, and the ISM Services PMI all set to be unveiled, investor sentiment will be closely influenced by how these reports align with expectations. Each of these data points has the potential to reshape market behavior, with implications for economic growth, inflation, and the Federal Reserve’s next move. Here’s a deeper look at what to expect and how each piece of data could impact the market:
ADP Non-Farm Payroll Change
The ADP Non-Farm Employment Change report offers a crucial preview of the upcoming official payroll data. As one of the first major employment reports, it can be a market-moving event, providing insight into the strength of the labor market outside of the agricultural sector.
- If the actual number comes in higher than the forecast, it will signal stronger-than-expected job growth, which could bolster investor confidence in the overall economic resilience. Strong job creation typically supports consumer spending, which in turn can help fuel growth in cyclical sectors such as consumer goods, technology, and industrials. Furthermore, a robust labor market may prompt the Fed to reconsider their current stance on interest rates, potentially leading to a hawkish shift in policy.
- On the flip side, a lower-than-expected result could raise concerns about the economy’s ability to generate jobs, signaling potential weakness in demand and consumer confidence. This would likely spark a pullback in equities, particularly in growth sectors, while investors may flock to the safety of government bonds, which tend to benefit in risk-off environments.
Unemployment Claims
Weekly unemployment claims are a highly scrutinized indicator of the health of the labor market and overall economic stability.
- A lower-than-expected reading on claims would be a strong signal of ongoing labor market tightness, with fewer workers filing for unemployment benefits, pointing to a resilient job market. This would likely drive optimism, particularly in cyclical sectors, as the labor market is a key driver of consumer spending. A positive claims figure would support the narrative of a stable economy, which could result in a rise in equities, particularly those in consumer-oriented sectors. However, a lower reading might also raise concerns over persistent inflationary pressures, as a tight labor market can lead to wage inflation, potentially prompting the Federal Reserve to maintain or even tighten its current monetary policy.
- On the other hand, if unemployment claims come in higher than anticipated, it would signal potential strain in the labor market, with an increase in job losses that could undermine consumer spending. A surprise rise in claims would likely prompt a shift to risk-off sentiment, with defensive sectors such as healthcare and utilities attracting investment. Additionally, it may lead to safe-haven flows into Treasury bonds, pushing yields lower.
ISM Services PMI
The The ISM Services PMI is also one key indicator for gauging the health of the US economy, with the services sector accounting for a major part of total GDP.
- If the ISM Services PMI comes in above expectations, this would mean that the services sector continues to be strong, which would help alleviate fears of recession. If the services PMI comes in strong, this would indicate robust growth in consumer-orientated sectors such as retail, pharmaceuticals, or finance, potentially propelling equities on the back of the consumer sector. If the outcome is positive here, it would also help allay fears regarding economic slowdown but would instead indicate the US economy is on sound growth trends despite external uncertainties.
- If the outcome is lower than expected, then this will act as a concern indicator that suggests demand in the services sector is losing steam. This could imply that the economy is broader cooling, especially the consumer-driven sectors, and would trigger a flight to safe assets. Investors would turn to the safe haven sectors until the weakness passes, with utilities, for example, or the consumer staples sector. Equities would also see the market retreat. If the number comes in lower, then inflation concerns would also increase as growth slowdown in services would indicate the weakness in demand fundamentals.
As these major data points develop, market participants need to be ready for volatility. Pareto Economic Partners will pay close attention to the ADP Non-Farm Employment Change, the Unemployment Claims, and the ISM Services PMI releases as all three will help set the course for Federal Reserve policy over the next few months. Better-than-anticipated data will pressure the Fed to tighten policy again, whereas softer data will encourage the Fed to adopt a dovish stance, among broader trends for inflation and jobs. Paying close attention to these releases will help investors manage the changing macroeconomic environment and change their positions as needed.
Stock Market Performance
Indexes Extend Gains from April Lows, But Broad Weakness Remains
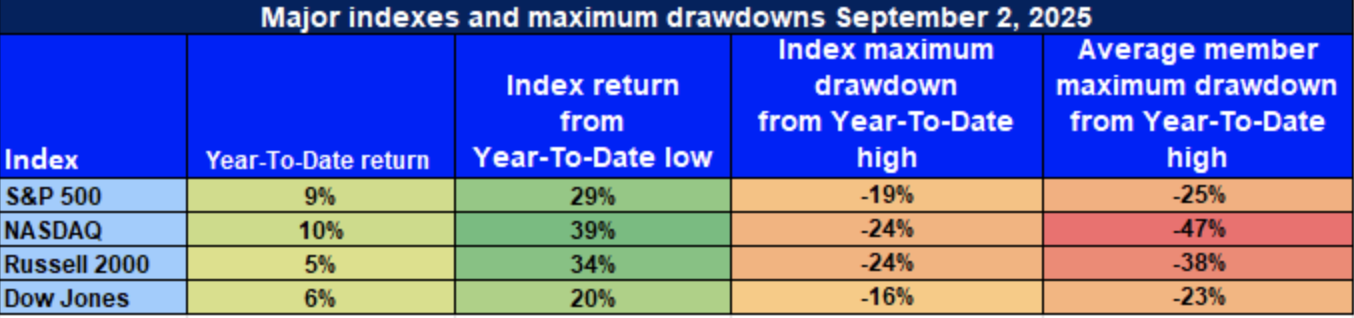
Equity markets have made notable gains since the lows observed on April 8th, with major indices posting improved headline returns. However, beneath the surface, the rally remains narrow, with continued drawdowns and significant losses among a large portion of market constituents. While momentum is still visible, the overall market structure remains fragile, highlighting that the rebound is concentrated in a select few stocks, leaving many areas of the market in distress.
Here’s an updated look at the performance across key U.S. benchmarks:
📈 S&P 500: Resilient on the Surface, But Leadership Still Narrow
YTD: +9 | +29 off April low | -19 from YTD high | Avg. member: -25
The S&P 500 has posted a solid 9% year-to-date gain and surged 29% from its April low. However, the index is still 19% below its year-to-date high, and the average member has seen a 25% decline, reflecting significant weakness in the majority of the index’s stocks. This performance underscores a key issue: despite the index’s overall strength, the gains are concentrated in a small number of large-cap stocks, particularly those in sectors like technology and energy, with much of the broader market underperforming.
🚀 NASDAQ: Leadership in Growth, But Deep Member Pain
YTD: +10 | +39 off April low | -24 from YTD high | Avg. member: -47
The NASDAQ has been the standout performer with a 10% gain year-to-date and an impressive 39% rally from the April lows. However, a deeper look reveals the index is 24% off its peak, with average member losses an alarming 47%. This stark contrast between headline performance and the struggles of many individual stocks suggests that while growth names are leading the rally, broader investor sentiment remains fragile. Many tech-heavy stocks have experienced significant losses, highlighting the ongoing volatility and uncertainty within the sector.
📊 Russell 2000: Small-Cap Bounce Still Lacks Conviction
YTD: +5 | +34 off April low | -24 from YTD high | Avg. member: -38
The Russell 2000 has seen a 34% rally from its April lows, but it has only managed a 5% gain year-to-date. The small-cap index continues to struggle with a 24% drop from its high and an average member loss of 38%. This signals weak investor confidence in small-cap and economically sensitive stocks, with many companies within the Russell 2000 still battling significant headwinds. Despite the rally, the lack of sustained conviction in small-cap stocks reflects broader economic uncertainty, particularly as investors remain cautious about future growth prospects.
🏛 Dow Jones: Defensive Bias Offers Relative Stability
YTD: +6 | +20 off April low | -16 from YTD high | Avg. member: -23
The Dow Jones has exhibited moderate resilience, rising 6% year-to-date and 20% from its April lows. The index’s defensive bias, with a heavier weighting in sectors like utilities, healthcare, and consumer staples, has provided relative stability. The Dow’s 16% drop from its YTD high is the shallowest among the major indices, reflecting its more stable composition. However, the average member loss of 23% suggests that even in this more defensive sector, there are still significant stresses, indicating that the broader market continues to face challenges.
At Zaye Capital Markets, we continue to advocate a selective approach to investing. We recommend focusing on quality companies with sustainable earnings, conservative balance sheets, and strong market positioning. While the broader market shows signs of recovery, the lack of breadth in the rally signals that caution remains warranted. Until the market shows stronger participation across sectors, it’s prudent to maintain a disciplined and defensive strategy, concentrating on businesses that can weather economic turbulence and provide consistent long-term growth.
The Strongest Sector In All These Indices
Communication Services Leads the Pack Amid Broader Sector Divergence
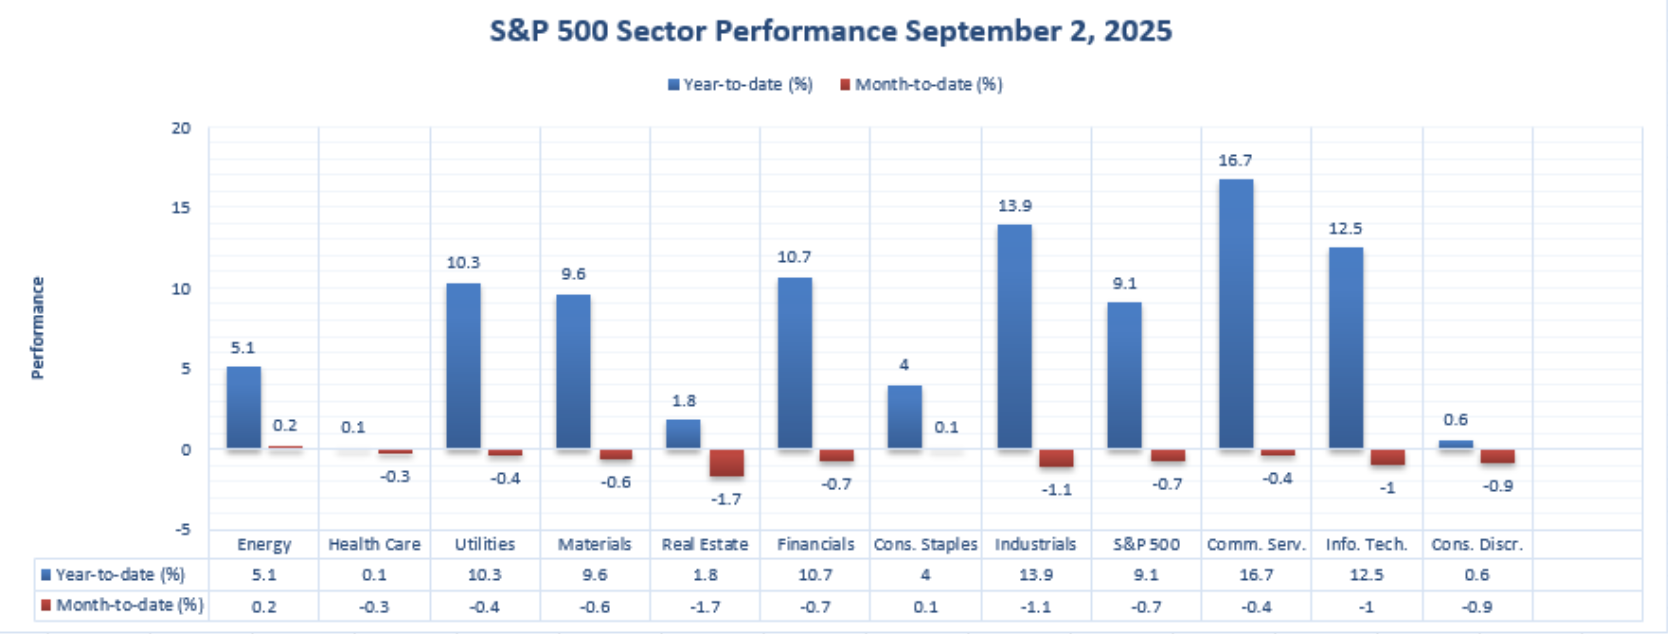
In a year marked by sector divergence, Communication Services has firmly established itself as the strongest sector across the S&P 500 in 2025. While other sectors are beginning to show signs of fatigue, particularly in the face of recent volatility, Communication Services continues to outperform with both strong momentum and impressive year-to-date gains. Its leadership is a testament to the sector’s resilience, benefiting from strong earnings and growth drivers, even as broader economic uncertainty lingers.
Communication Services: Dominant Leadership
YTD: +16.7% | MTD: -0.4%
With a 16.7% year-to-date gain, Communication Services stands as the top-performing sector within the S&P 500. Despite a minor 0.4% pullback month-to-date, this sector has remained robust throughout the year. Several key factors are driving this performance, including solid earnings from top players, consistent consumer demand, and a strong rebound in digital advertising and streaming revenues. These tailwinds have positioned Communication Services as a defensive growth leader, outpacing other sectors during a time when investors are particularly focused on earnings durability and long-term growth potential.
Other Strong Performers:
Information Technology holds the second spot with a 12.5% YTD gain, although the sector has faced a -1.0% decline recently, reflecting cautious sentiment toward high-valuation growth stocks. Despite this, Information Technology remains a core driver of innovation and digital transformation, with strong demand for tech solutions continuing to fuel its performance.
Industrials and Financials follow closely with 13.9% and 10.7% YTD gains, respectively. However, both sectors have also seen month-to-date declines of -1.1% and -0.7%, respectively, indicating that while they’ve benefited from strong economic recovery trends, they are susceptible to short-term volatility.
While the broader market faces volatility, Communication Services has maintained its outperformance, with its mix of growth potential, margin expansion, and digital transformation making it an attractive sector for investors seeking resilience in the current environment.
At Zaye Capital Markets, we continue to recommend a tactical overweight approach to sectors that demonstrate both earnings durability and relative strength. Communication Services remains a compelling choice due to its growth potential and resilience, offering a balanced opportunity for investors looking to position themselves in an uncertain market.
Earnings
Earnings Overview: September 3, 2025
- Salesforce Inc. (CRM)
Salesforce reported a strong Q2 FY26 with revenue of $10.24 billion, a 10% year-over-year increase. Subscription and support revenue grew by 11%, reflecting the company’s solid performance in the cloud space. However, the company’s stock fell by over 5% in after-hours trading following a weaker-than-expected Q3 revenue forecast. Additionally, Salesforce announced the elimination of 4,000 customer support roles, driven by AI efficiency gains. This move, while promising long-term cost savings, raised concerns about job cuts in customer-facing roles, affecting investor sentiment.
- Hewlett Packard Enterprise Co. (HPE)
Hewlett Packard Enterprise reported Q3 FY25 revenue of $9.14 billion, an 18.5% increase year-over-year. Non-GAAP EPS came in at $0.44, surpassing analyst expectations. The company raised its full-year revenue growth forecast to 14–16%, largely driven by strong demand for AI servers and networking solutions. However, concerns about narrowing profit margins in the coming quarters were flagged, indicating that while HPE is benefiting from strong demand, its profit margins could face pressure from rising costs and competition in the AI space.
- Figma Inc.
Figma saw a 41% year-over-year revenue increase in Q2 2025, reaching $249.6 million. The company introduced new AI-powered features designed to improve the user experience. Despite these positive figures, Figma’s stock dropped 14% in after-hours trading, possibly due to concerns over increased investments in AI, employee stock lock-up expirations, and market uncertainties surrounding its future growth trajectory. The market seemed uncertain about whether these AI investments would drive sufficient returns in the short term.
- Dollar Tree Inc. (DLTR)
Dollar Tree reported a slight revenue increase for Q2 2025, but the company faced challenges from rising tariffs and inflation, which squeezed margins. Despite these pressures, the company maintained its full-year guidance, focusing on cost control and strategies to drive long-term growth. Investors are keenly watching how Dollar Tree will manage its cost pressures while continuing to expand its footprint and adapt to changing consumer habits amidst ongoing macroeconomic challenges.
Earnings Preview: September 4, 2025
- Broadcom Inc. (AVGO)
Broadcom is set to report its Q3 FY25 earnings today. Analysts are expecting EPS of $9.50 on revenue of $9.1 billion. Investors will be looking for updates on AI-related demand, particularly in semiconductor components, as the company continues to capitalize on the AI and cloud infrastructure boom. Additionally, any commentary on the company’s ability to navigate global supply chain issues and geopolitical tensions will be closely watched, as these factors could impact future earnings projections.
- Copart Inc. (CPRT)
Copart is scheduled to release its Q4 FY25 results today, with analysts expecting EPS of $0.37 on revenue of $1.14 billion. Investors will focus on vehicle auction volume trends, particularly the company’s ability to expand in international markets and the performance of its VB3® online platform. As the car auction business increasingly moves online, how Copart adapts to this shift, along with its ability to grow in key regions, will be critical for future growth.
- Lululemon Athletica Inc. (LULU)
Lululemon is set to report its Q2 FY25 earnings today. The company is expected to post EPS of $2.86 on revenue of $2.55 billion. Investors will be watching same-store sales growth, as well as the impact of recent marketing initiatives aimed at diversifying its customer base. Additionally, Lululemon’s international expansion efforts will be a key focal point, particularly in Asia, where demand for premium athletic wear continues to grow.
- Samsara Inc. (IOT)
Samsara will announce its Q2 FY26 earnings today, with analysts expecting EPS of $0.06 on revenue of $1.02 billion. Key metrics to watch include annual recurring revenue (ARR) growth, customer acquisition trends, and the scalability of its connected operations platform. As more companies look to digitize and automate their operations, Samsara’s performance in expanding its customer base and increasing its product adoption will be crucial for its continued growth.
At Zaye Capital Markets, we remain focused on these earnings releases, which provide critical insight into sector-specific trends and broader market dynamics. Investors should pay attention to guidance, margin trends, and strategic initiatives as they reflect the companies’ positions in an evolving economic environment.
Stock Market Overview – Thursday, Sept. 4, 2025
U.S. stocks rallied on Wednesday due to the gain in technology shares and decelerating Treasury yields. Fears of weak jobs data and the effect on economic growth by the tariffs, however, kept the investors on guard. S&P 500 and Nasdaq Composite settled in the positive territory, but the Dow Jones Industrial Average limited its gain. The Russell 2000 also struggled with the economic uncertainties.
Stock Prices
Economic Indicators and Geopolitical Trends
The market’s cautious tone is attributed to a combination of factors. The U.S. economy added only 73,000 jobs in July, significantly below expectations, raising concerns about labor market strength. Additionally, President Trump’s recent imposition of tariffs on imports from several countries has heightened trade tensions, contributing to market volatility. These developments have led to increased risk aversion among investors, impacting market performance.
Current Stock Updates
- $AMZN: AWS is building over 1.3GW data centre capacity for Anthropic, to support nearly 1 million Trainium2 chips. Anthropic has now a $5B run-rate (5x YoY), with AWS as lead training partner, with inference also largely taking place on Cloud TPUs of $GOOGL. This deal illustrates AWS’s key role in facilitating the revolution in AI.
- $GOOGL: Despite the company having more net income to its name than $AAPL, $MSFT, or $NVDA, the $GOOGL exchange-trades at the lowest multiple among the group. Such valuation gap creates an attractive long-term growth investment proposition, especially with the accelerating profits due to the need for AI as well as cloud computing.
- $AAPL: Apple will add AI search to Siri in the next year, with its $GOOGL Gemini program considered for inclusion. This will enhance the functionality for Siri and comes as part of the direct counter to growing competition in the voice assistant and AI space, particularly the advanced abilities of $GOOGL.
- Polymarket: Polymarket has indeed secured approval to enter the U.S. This news comes as an important addition to the growing prediction market space with the potential for Polymarket to emerge as an early major player in the burgeoning space for digital prediction markets.
The Magnificent Seven and the S&P 500
The “Magnificent Seven”—Apple, Microsoft, Nvidia, Amazon, Meta, Alphabet, and Tesla—are showing signs of fatigue. A recent sector breakdown shows the group averaging a drawdown of over 18% from their recent highs, with Tesla and Meta leading the decline. This signals a valuation recalibration, especially in AI-driven growth stories that have run ahead of fundamentals. The S&P 500 remains under pressure as tech leadership wavers. While energy and industrials are offering some support, the index is unlikely to rally sustainably without renewed participation from its core mega-cap drivers.
Major Index Performance through Thursday, September 4, 2025
- S&P 500: Trading at 6,448.26, up 0.51% on the day.
- Nasdaq Composite: Currently at 21,497.73, up 1.02%, driven by tech gains.
- Dow Jones Industrial Average: Rose 0.05% to 45,271.23, led by the energy sector and the financial.
- Russell 2000: Relatively flat at 2,147.63, lagging on the back of rate sensitivity among.
Still, at Zaye Capital Markets, sector rotation and-positioning strategies remain top of mind as earnings season unfolds. Whether or not top companies hold their ground on earnings growth with tightened policy will set the course for broader equity markets for the rest of Q3
Gold Price – Thursday, September 4, 2025
Gold prices have seen a slight pullback today, trading at around $3,541.80 per ounce, down 0.49% from the previous day’s high. This dip comes after a record-breaking rise earlier in the week when gold hit $3,578.50 per ounce. Despite the short-term correction, the overall trend remains bullish, with gold continuing to benefit from a combination of factors including heightened geopolitical uncertainty and expectations of potential interest rate cuts by the Federal Reserve. Geopolitical comments from President Trump, such as contemplating the removal of U.S. troops from overseas and raising concerns over U.S.-China relations, have added to global market volatility, pushing investors towards gold as a safe-haven asset. The combination of these tensions, alongside soft economic data, continues to support the demand for gold as a store of value.
Looking ahead, today’s economic data releases—namely the ADP Non-Farm Employment Change, Unemployment Claims, and the ISM Services PMI—will be crucial in shaping market sentiment. If the economic data comes in weaker than expected, it could fuel speculation that the Federal Reserve might pursue a more dovish monetary policy, which would likely boost gold further. A surprise decline in employment could intensify expectations of a rate cut, benefiting gold prices even more. As the market closely watches these reports, the growing risk from geopolitical issues and potential policy shifts ensure that gold remains an attractive option for investors seeking stability amidst economic and political uncertainties.
Oil Prices – Thursday, September 4, 2025
Oil prices have been somewhat volatile, with West Texas Intermediate (WTI) crude oil trading at approximately $63.62 per barrel, down slightly. Market conditions have been weakened by an increase in U.S. crude oil inventories by 622,000 barrels, contrary to market forecasts for a drawdown. Market worries over the possibility of an OPEC+ decision to ramp up production in the month of October are also taking their toll on the price, with the possibility that the group would rather control market share rather than the price, which would add to the downwards pressure on oil prices. Geopolitics remain bearish on market conditions as well. President Trump’s recent statement regarding potentially withdrawing the U.S. military forces stationed in other nations sparked fears over supplying the world, which could be taking its toll on near-term price swings.
The International Energy Agency (IEA) has also updated its world oil supply growth estimate to 2.1 million barrels daily for 2025, due to rising supply by both non-OPEC+ and OPEC+ producers. Still, the IEA also forecast an oversupply possibility due to the weaker growth in demand, when compared with initial predictions. This has raised concerns regarding a swollen oil market balance by the close of the year, subsequently placing additional downward pressure on oil prices. With all these variables at play—supply trends, geopolitics, as well as economic information—there is nothing but uncertainty for the oil market, with prices set to vary according to the actions by OPEC+, as well as the change in geopolitics on the world stage.
Bitcoin Prices – Thursday, September 4, 2025
Bitcoin is trading at approximately $111,178, showing a slight recovery after briefly dipping below the $110,000 support level. This stability comes after a period of volatility, with analysts noting that Bitcoin’s price movement is being influenced by macroeconomic shifts, regulatory developments, and market sentiment. President Trump’s recent comments regarding the establishment of a Strategic Bitcoin Reserve have stirred both optimism and concern in the crypto market. His remarks have the potential to legitimize Bitcoin as a national reserve asset, yet some critics worry about market manipulation and the broader implications of government involvement in digital assets. These mixed reactions are adding volatility to Bitcoin’s price in the short term.
Along with these geopolitical changes, economic releases like the ADP Non-Farm Employment Change and ISM Services PMI are dictating the investment outlook. Downbeat-than-anticipated jobs data would increase the attractiveness of Bitcoin as a safe haven, buoying its price, but better-than-anticipated data would diminish demand for it as investors seek more mainstream investments. Economic data in the coming days would play a vital part in the price direction of Bitcoin as investors seek alternative assets with economic uncertainties. Evolving dynamics between Bitcoin and mainstream markets, as well as regulatory certainty, will also persist in dictating its place in the larger financial system.
Ethereum (ETH) Prices – Thursday, September 4, 2025
Ethereum (ETH) is currently trading at approximately $4,402.68, showing a 1.56% increase from the previous close. This price movement comes amid significant institutional interest, with Ethereum ETFs seeing nearly $500 million in inflows during August, surpassing Bitcoin ETFs. Ethereum’s strong performance is supported by factors such as its robust Layer 2 solutions, scaling potential, and growing institutional adoption. Additionally, Ethereum whale activity has increased, with a major Bitcoin whale transferring $4 billion into Ethereum, acquiring over 886,000 ETH. This reflects growing confidence in Ethereum’s long-term value, and the tightening supply, as Ethereum’s exchange reserves hit a three-year low, further fuels bullish sentiment in the market.
In terms of broader market dynamics, Ethereum’s price continues to benefit from reduced exchange reserves, with over 10.7 million ETH withdrawn since 2022, suggesting potential upward price pressure. The anticipated Fusaka upgrade, aimed at enhancing scalability and reducing gas fees, adds further optimism for the ecosystem’s future. These developments, combined with whale behavior and institutional demand, suggest that Ethereum’s price could continue its bullish trend, supported by fundamental improvements and increasing demand from both retail and institutional investors. As Ethereum evolves with these upgrades and growing use cases, its market position appears poised for continued growth.
