Where Are Markets Today?
Markets have opened fairly mixed today, taking a cue from the investors’ cautious outlook ahead of the highly anticipated U.S. nonfarm payrolls report. In the opening transactions of the day, U.S. futures stood unchanged: Dow Jones futures gained a mere 4 points (0.01%), S&P 500 futures gained around 0.09%, Nasdaq 100 futures gained 0.2%. European markets also opened on a similar note, with the futures of the Euro Stoxx 50 gaining around 0.1%, as regional investors reciprocated the cautious optimism seen during the U.S. pre-open market movements. With the stocks remaining around the historical high owing to the S&P 500’s newest closing high yesterday, traders clearly appear to be waiting for data confirmation ahead of opening the position further.
The first factor shaping sentiment is payrolls anticipation and its link to Federal Reserve policy. Yesterday’s ADP report showed weaker-than-expected private job growth, a sign of cooling in the labor market. While that softness raised hopes for monetary easing, investors recognize that the Labor Department’s nonfarm payrolls report carries more weight in the Fed’s calculus. Current futures trading points to a 97% probability of a rate cut at the September 17 policy meeting, according to CME FedWatch, leaving markets finely balanced between optimism on easing and caution over growth concerns.
The second driver is a more global theme of unified risk appetite, albeit moderated by uncertainty. European equities opened slightly higher as bond yields slipped, reflecting investor preference for a potential “Goldilocks” outcome—employment figures strong enough to reassure on growth but soft enough to justify rate cuts. Asian markets also rose earlier in the day, reinforcing the sense that investor positioning is broadly optimistic yet cautious. This cross-regional alignment underscores how closely Europe and the U.S. are moving in tandem, with both sets of futures flat to slightly higher ahead of the pivotal data release.
In Zaye Capital Markets’ assessment, today’s lackluster futures action is more of a pause than a direction- changing move. Investors are not wanting to drive equities substantially higher without reassurance from the labor data, especially with markets already at historic peaks. The nonfarm payrolls report due tomorrow will probably decide if the calm gives way to a new-rate-cut-boosted rally, or if disappointment triggers profit-taking as valuations adjust. In the meantime, both U.S. and European futures show the market is in pause mode, looking for resolution on the economic and policy path ahead.
Major Benchmark Performance on Friday, September 5, 2025
- S&P 500: Trading at 6,449.12, up approximately 0.8%.
- NASDAQ Composite: Trading at 21,497.73, up about 0.9%.
- Dow Jones Industrial Average: Closed at 45,621.29, up roughly 0.8%.
- Russell 2000: Trading at 2,365.70, up around 1.3%.
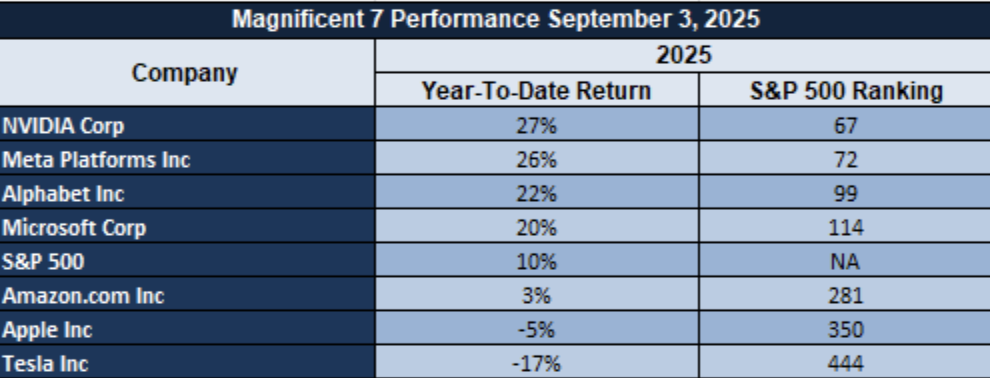
The Magnificent Seven and the S&P 500
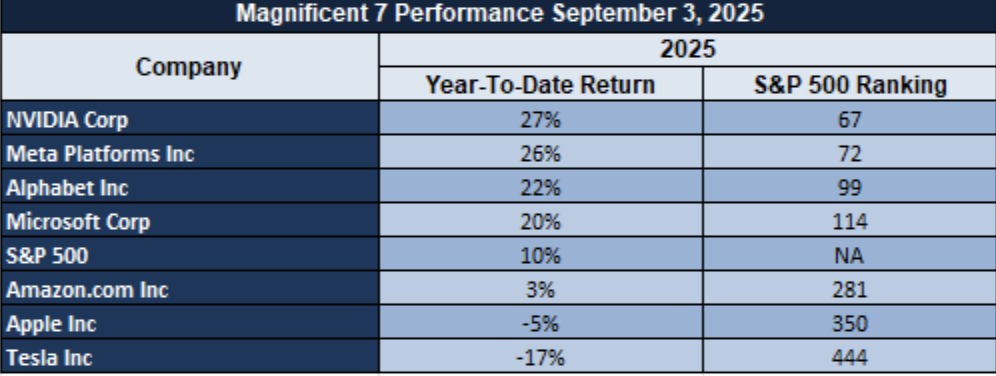
The “Magnificent Seven”—Apple, Microsoft, Nvidia, Amazon, Meta, Alphabet, and Tesla—remain pivotal to market direction. While today’s gains across indices reflect their continued leadership, broader market participation remains narrow. As these mega-caps pause or pull back, their influence—and fragility—becomes even more pronounced, with energy and industrial sectors unable to fully offset any weakness in tech leadership.
Drivers Behind the Market Move
At Zaye Capital Markets, we see both U.S. and European markets opening the day with a cautious tone, driven by a convergence of policy expectations, geopolitical positioning, and upcoming macroeconomic releases. While headline indices remain close to record highs, the underlying drivers are clear and distinct, each shaping investor sentiment in critical ways.
1. FED Policy Outlook and Soft Labor Report
Yesterday’s miss on ADP private payrolls – just 54,000 jobs were added by the private sector last month – has been the stimulus driving increasing belief that the Federal Reserve will head towards easing come September. Futures markets currently expect a 97% chance of a rate reduction, furthering the story of policy accommodation, which is supporting equities both sides of the Atlantic, as lower rates will relax funding conditions and decrease strain on valuations. From our point of view, it highlights that the softness of the labor market is no longer perceived as unconditionally negative, but rather as a variable that may be able to maintain equity traction come the near term.
2. Geopolitical pressure of Trump and Trade Position
President Trump’s remarks during the week have brought a further element of geopolitical risk. His demands of European allies to stop buying Russian oil and exert economic pressure on China complicate global energy and trade flows. Meanwhile, his threat to put import duties on semiconductors unless production is relocated to the U.S. is kindling speculations of supply chain bifurcation again. For markets, the combination is bittersweet: defense and energy industries profit on the basis of increased geopolitical premiums, and world growth-sensitive sectors confront increased caution again. We regard it as one of the drivers that investors will have to disregard—headlines of policy directly determining sectoral leadership and prices of commodities.
3. Anticipation of Today’s U.S. Economic Data
The spotlight now turns to today’s critical releases: Retail Sales, Average Hourly Earnings, Non-Farm Employment Change, and the Unemployment Rate. Market positioning reflects a clear expectation of a “Goldilocks” outcome—figures firm enough to show resilience but soft enough to justify easing. Stronger prints would risk pushing Treasury yields and the dollar higher, pressuring risk assets, while weaker results would lock in the dovish narrative and extend the rally.
As Zaye Capital, we emphasize that today’s readings will do more than provide the tone for the short-term equity moves, but also provide the anchor to cross-asset positioning globally to the September Fed decision.
Digesting Economic Data
The Tweets of TRUMP and Their Implications
Trump’s recent words and policy indications range widely, from domestic political squabbles to international security and trade reshufflings, providing a highly charged background against which markets and policy observers alike will respond. Domestically, he addressed the Epstein scandal as a “Democrat hoax” amidst litigation surrounding the use of Washington National Guard troops, evidencing a polarized political climate that may heighten volatility within the U.S. policy arena. Rebranding the Department of Defense as the “Department of War” further testifies to a move away from less combatant framing of U.S. national security, a development likely to stoke controversy surrounding the military and civil-military relations.
Globally, Trump has doubled down on efforts to get European allies to cease buying Russian oil and ramp up economic pressure on China for backing Russia’s war effort. His Ukraine call with Zelenskiy and demands on European cohesion show consistency in the hardline against Moscow while redoubling transatlantic tension. These have direct effects on global energy markets, where the prices of crude have become more subject to the risk of diminished Russian flows. Additionally, his tariff action—specifically the levying of duties on chip imports unless production moves to the U.S.—indicates continued shifting to industrial nationalism, the threat of increased input costs and supply chain restructuring.
Meanwhile, Trump has also drawn on influence over energy and tech storylines. Welcoming key tech executives to the White House, highlighting U.S.-based investment in artificial intelligence, and unveiling a $1 billion grid plan all reflect his efforts to combine energy security with tech superiority. Their efforts seek to spur AI adoption on both civilian and defense sides, and Melania Trump’s “Presidential AI Challenge” of U.S. schools adds a public component. As investors, these initiatives reflect a government-directed move into the world of AI, grid modernization, and chip reshoring—all sectors that have great capital market consequences.
Geopolitically, the talk of military action against the drug cartels, the alleged flyover of Venezuelan jets by a U.S. Navy vessel, and the insinuation of ending long-standing European security aid programs increases the risk premium of the defense and energy sectors. These actions constitute a confrontational doctrine and a policy of America-first, with secondary impacts on the prices of commodities, defense firms, and international alliances. For investors, the broader message is that of Trump’s continuous framing of risk sentiment where the correlation between political risk, commodity market moves, and the shifting of international investment flows is reaffirmed.
Services Sector Expansion Holds Despite Labor Market Strains
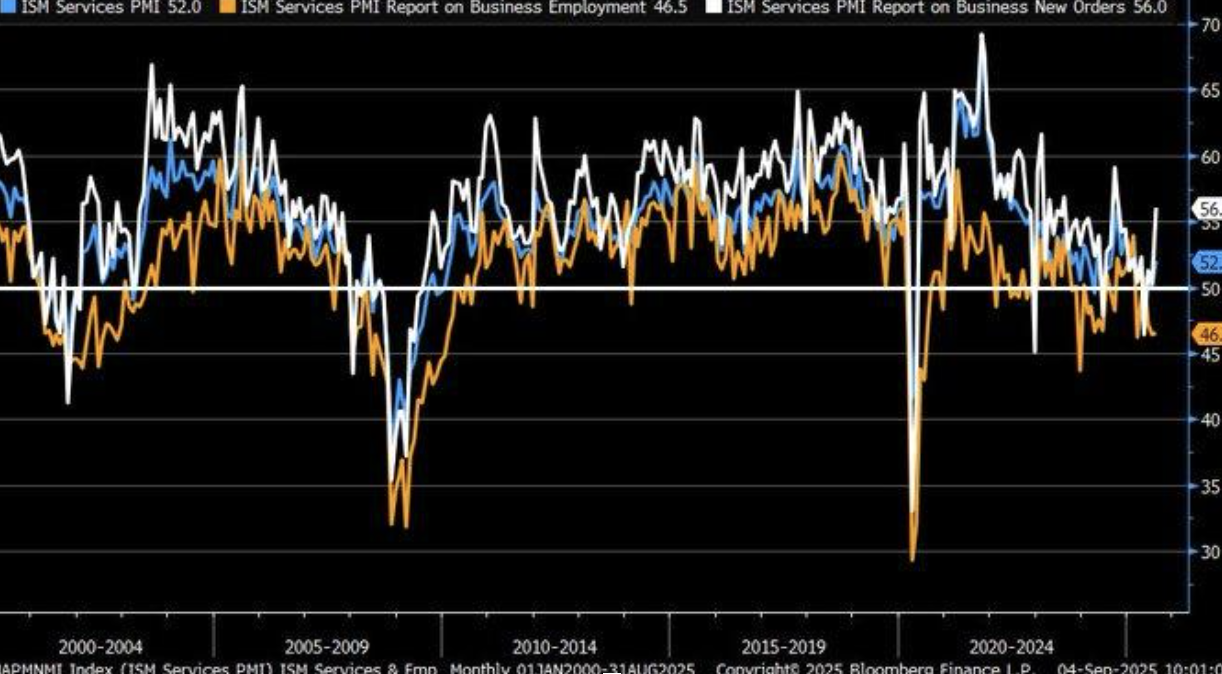
The August 2025 ISM Services PMI advanced to 52, surpassing both consensus expectations of 51 and July’s 50.1. This reading signals renewed momentum in the U.S. services economy, with new orders climbing to 56, highlighting robust demand. At the same time, the employment component fell to 46.5, remaining in contraction territory and underscoring persistent labor market challenges. Based on historical correlations, this composite level aligns with a 1.1% GDP growth trajectory, suggesting steady but not yet broad-based economic expansion.
Looking at the longer-term data, services PMI has exhibited a volatile but generally downward trend since 2005, with notable dislocations around 2020. Against this backdrop, the current stabilization in 2025 signals resilience, reflecting demand strength even in a maturing cycle. The divergence between strong order flows and weak labor conditions raises questions about sustainability. For analysts, the forward-looking signal lies in whether robust new orders can eventually translate into higher employment, or whether labor softness will weigh on broader services output in the quarters ahead.
The outlook is also muddled by risks surrounding trade policy. Economic modeling indicates contemplated tariffs might reduce the GDP by up to 8% and wages by 7%, essentially neutralizing PMI-driven euphoria if enacted. In such a backdrop, some consumer discretionary picks come across as cheap, especially those with globally diverse exposures and pricing abilities to overcome tariff headwinds. We think tariff news needs to be tracked closely by the Street, with specific focus on the employment facet of the services PMI that will be integral to determining the sustainability of the phase of expansion.
U.S. Trade Deficit Expands on Strong Imports and Poor Showing by Exports
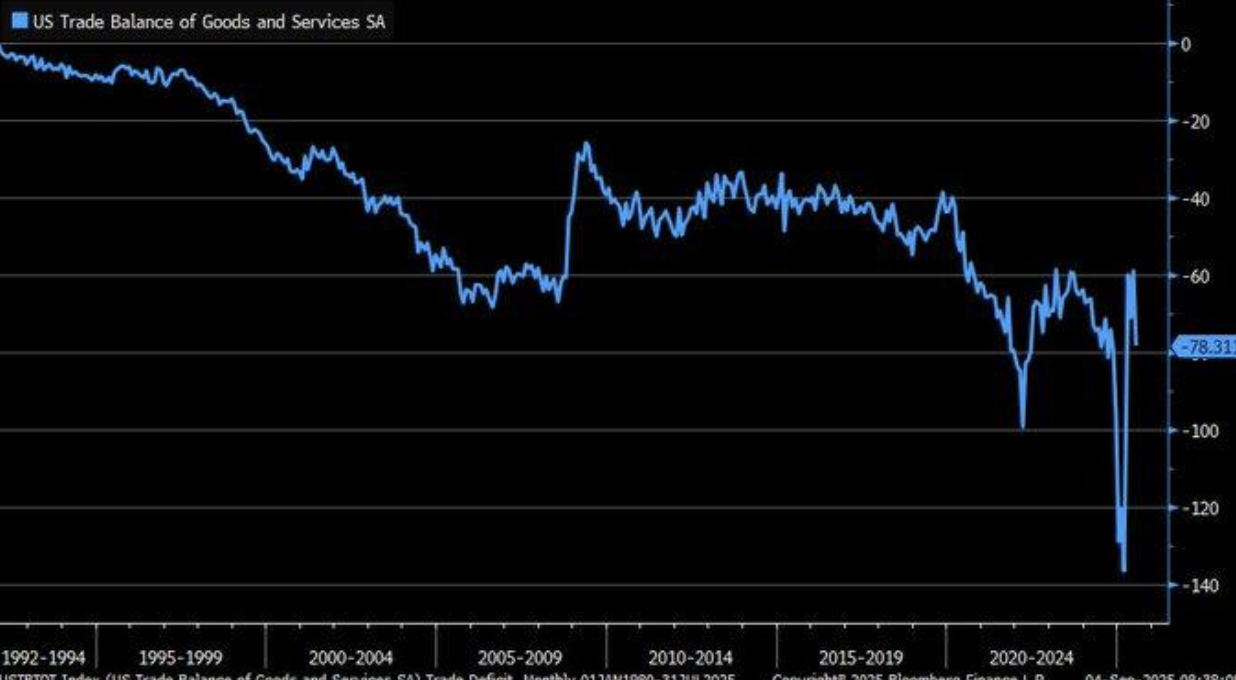
The U.S. trade balance took a sudden turn down sharply in August 2025 as the deficit increased to $78.3 billion. Imports gained 5.9% but exports managed just a 0.3% increase, ignoring estimates of a balanced post-pandemic recovery of the U.S. external account. The increasing gap indicates robust domestic demand exceeding U.S.-bound international demand for U.S. exports of goods and services along with persisting structural demands due to international trade redrawing. The imbalance further enforces a recurring theme: the American economy attracts foreign goods during booms, and the export expansion fails to match external headwinds along with foreign tariff strategies.
A prime motivator of the ongoing deficit is the strength of the U.S. dollar. Past data indicates that by virtue of being the world’s major reserve currency, the dollar maintains imports relatively cheap while at the same time making American exports costlier abroad at the same time. This process generates deficits of a structural nature that are hard to reverse, despite U.S. manufacturing and services competitiveness. The ongoing cycle reflects that fact, as local consumers and firms enjoy lower-cost imported goods at the same time that exporters sacrifice pricing edge abroad. Analysts need to be aware that currency strength both maintains the deficit and has an impact on the dynamics of inflation, where cheap imports place a ceiling on price pressure simultaneously as it undermines export competitiveness. Diversification of the global supply chain adds further complexity to the problem. Several of the world’s economies have diversified trade flows to decrease dependence on U.S. exporters, consistent with long-term trade diversion patterns. It will likely continue to keep the deficit high as geopolitical and tariff risk speeds supply chain segmentation. In the background, undervaluation exists in some U.S. industrials and logistics companies that are hedged against currency fluctuations on a strategic level and have diversified offshore operations. Traders should pay close attention to the negotiations of the trade policy and movements of the dollar index since these are both key indicators of the deficit either maintaining a steady position or further increasing.
Jobless Claims Edge Higher But Core Labor Market Remains Firm
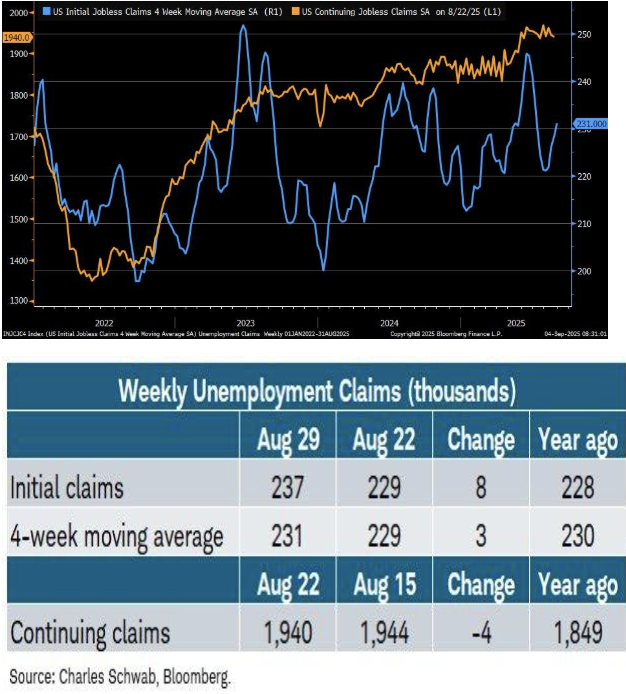
Initial job claims rose modestly to 237,000 in the week ended August 29, 2025, slightly above the 230,000 consensus, and continuing claims fell to 1.94 million. The discrepancy explains muddled labor market indicators where temporary filing action is incrementally climbing despite overall unemployment programs participation contracting. Seasonal adjustments traditionally have been the source of short-term increases rather than harbingers of frailty as past research has attributed the movements to holiday and reporting periods. Of note, the four-week moving average of 231,000 is little different versus the prior year’s 230,000, furthering reassurances of broader labor backdrop soundness.
Regional data underscores the uneven nature of the current labor market. Connecticut (+2.9k), New York (+1.8k), and Illinois (+1.4k) reported noticeable increases in new claims, signaling localized pressures possibly tied to sector-specific slowdowns. Meanwhile, Kentucky (-2.9k) and Florida (-601) saw declines, with the latter partly linked to post-hurricane rebuilding efforts that are spurring temporary labor demand. Such regional divergence suggests that while national-level metrics remain steady, certain states are experiencing sharper swings driven by weather-related disruptions, sector concentration, and infrastructure rebuilding cycles. For analysts, this split is a reminder to evaluate localized economic conditions as potential leading indicators for broader shifts.
In spite of hot spots of volatility, the resiliency within the four-week trend presents the picture of labor markets that endure even amidst external shocks. Continued claims trending down is a positive indicator of consumption strength supporting household demand into Q4. Risk is that regional weaknesses trickle into larger labor markets that could dampen confidence and spending. Against this background, undervaluation exists within select consumer discretionary and regional banking stocks, especially those that have exposure to those states that profit from rebuilding activity and consistent employment patterns. Analysts should monitor the dispersion within regional claims data against broader labor measures to assess if the resiliency persists or starts to fray in the months forward.
The ADP Report Shows Varied Labor Market Directions by Industry
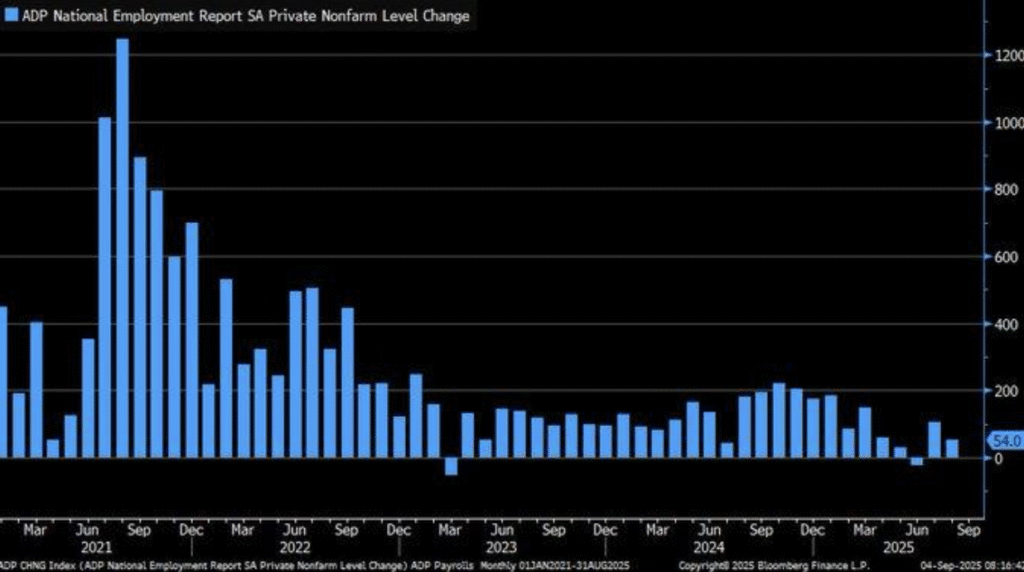
The August 2025 ADP National Employment Report showed private-sector increases of 54,000, falling short of predictions of 68,000, as the previous July estimate moved upward to 106,000. This headline slowing showcases the uneven hiring by firms adapting to shifting demand conditions. A 50,000 leisure/hospitality increase still showcases the services sector driving the recovery, with tourism/travel activity retaining steam. However, consumer-oriented services hiring softness shows the labor market adjusting to slower overall growth, consistent with the overall economic indicators showing fragile 1–1.5% GDP growth.
Manufacturing shed 7,000 jobs, reaffirming its structural reduction as automation and increased productivity displace jobs. Contrary to política focus on reshoring, the sector’s proportionate share of non-agricultural employment has declined over decades, reaching 8% by 2019 and declining further since then. This trend verifies that efficiencies driven by technology instead of trade continue to be the primary force redrawing industrial employment. However, construction gained 16,000 jobs, buoyed by investment in the infrastructure by the federal government and a 4.7% long-term growth forecast. Non-residential construction, in fact, continues to be buoyed by investment flows directed at energy grids, transportation facilities, and industial plants related to incentive-driven policy. For investors, the divergence is a call to selectivity.
Consumer services continue to be a bright area, where hospitality and travel-related companies remain cheap against their earnings recovery profile. Construction-associated shares—specifically, in the building materials, engineering, and industrial equipment spaces—also have upside since fiscal spending forms the basis of demand. Analysts need to monitor policy implementation under infrastructure plans as well as the spread of automation on the manfacturing jobs market since these will determine sector-level losers and winners. The bottom line: headline job addition slows down, sector-specific robustness provides selective value opportunities in leisure, construction, and industrial supply chains.
Homeownership Goes Down As Rising Rates Send Households Renting
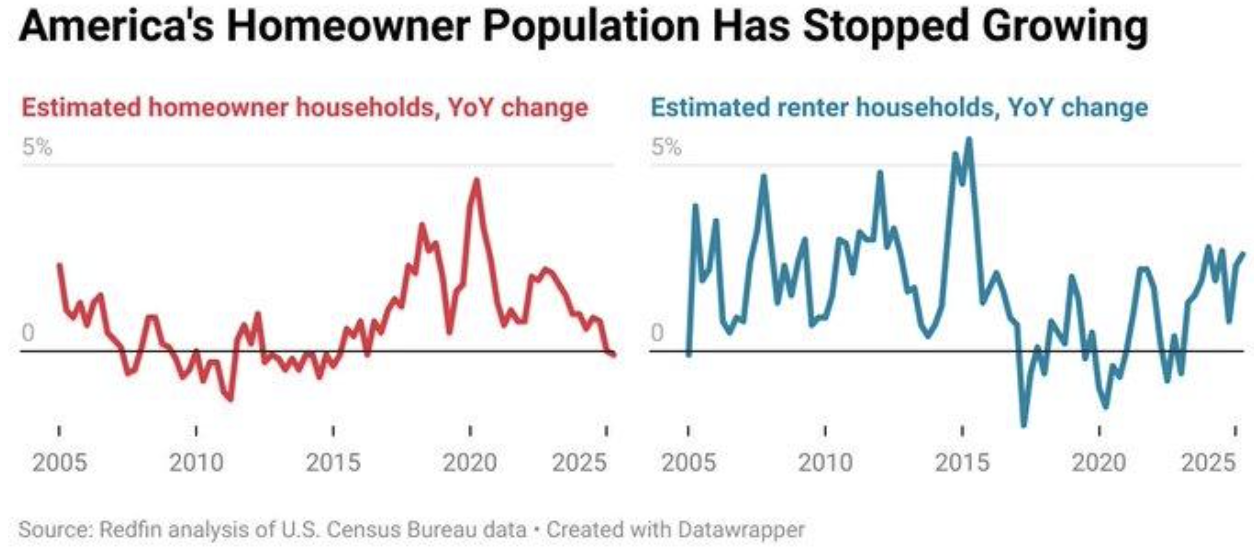
U.S. housing data for Q2 2025 revealed the first year-over-year decline in homeowner households since 2016, down 0.1%, while renter households continued to rise steadily. This reversal highlights the mounting affordability pressures tied to elevated mortgage rates, which have effectively priced out a portion of first-time buyers. The shift is reinforced by foreclosure activity, up 41% since 2020, and stagnant home sales volumes, suggesting a market undergoing structural adjustment rather than a temporary slowdown. These dynamics reflect a post-pandemic decline in household wealth effects, as borrowing costs eat into purchasing power and limit demand for ownership.
The trend reflects a bifurcated housing market. Homeownership is softening even as employment and incomes remain relatively steady, while rental demand increases as younger households value financial flexibility and portability. Higher rates widen the gap further, as monthly mortgage payments vastly outweigh symmetrically comparable rental payments across many metro regions. Meanwhile, investor interest in rental housing has increased, driving competition for rental stock and fueling the stability of rents even as homeownership weakens. These moves should be seen by analysts as tentative evidence of a secular movement by many key urban centers to a renter-centric market, particularly as mortgage markets remain dampened by global policy indecision and domestic budget constraints.
From an investment perspective, distress within the housing sector presents opportunity outside the conventional homebuilding sector. Multifamily builders, rental-oriented REITs, and companies with exposure to property management services look undervalued against the multi-year rental housing demand profile. Meanwhile, homebuilding stocks could be negatively impacted as affordability issues remain on the radar until the rates stabilize. Analysts will want to track mortgage rate action along with foreclosure activity and rental vacancy rates, as these will be the determinants of the pace and direction of housing market adjustments into 2026.
Orders in Manufacturing Reveal Vulnerability During Global Shifts of Supply Chains
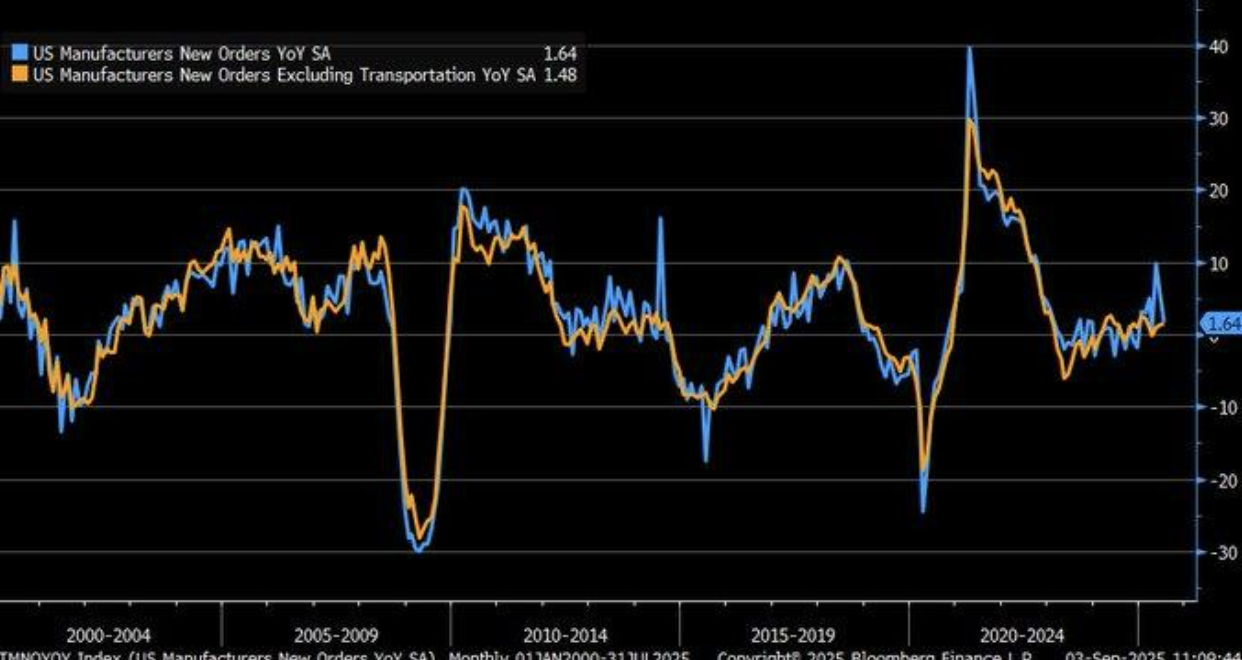
US orders to manufacturers remain in weak territory, with year-earlier advances of only 1.4% by September of 2024, well short of readings more indicative of robust expansion. Laggard momentum follows the June of 2025 Census Bureau report of a 4.8% decline of factory orders that places the focus on slowing industrial activity despite headline strength. Core orders ex-transportation provide some offset, the low level of increase by manufacturers, however, does reflect manufacturers’ lack of commensurate investment on a large scale basis. The sector is among the key gauges of overall economic conditions, the trend simply indicating an environment of stabilization with no discernable acceleration.
Overseas developments continue to be a determining influence on the path of U.S. production. Price inputs associated with the Ukraine conflict have raised input prices by approximately 15% since 2022, according to academic research, by shrinking profit margins and causing supply strategies to be reassessed by firms. Raw material prices such as those of metals and energy components hit small producers particularly severely, adding further to the fragility hinted at by the order data. Whilst larger-scale operators might absorb price volatility by virtue of pricing leverage and overseas diversification, repetitive bottlenecks suggest ongoing headwinds on the broader sector level.
Analysts need to appreciate that the international arena, not just U.S. demand, is a determining influence on the health of U.S. production. Policy changes further muddle the outlook. The elimination of the $800 de minimis tariff loophole, established to reduce low-value duty-free imports, comes in July 2025 and could redirect trade flows and change U.S. producer cost structures. Though the move bolsters U.S.-based production on paper, the short-term impact could be increased input prices and postponed supply adjustments. This adds further justification to defensive spending on the continent, where manufacturers weigh opportunity versus risk. We find undervaluation on a select basis of industrial technology and automation companies that facilitate cost savings and insulation versus supply disruptions. Analysts should watch policy-induced trade movements, raw materials prices, and core orders of manufacturing as the top indicators of the sector achieving continued growth versus falling back into decline.
Core Shipments of Capital Goods Indicate Business Investment Rebound
Core shipment of capital goods, not including aircraft and parts, increased at a 6.1% year-annual rate during the last three months up to July 2025, a quick acceleration after last year’s sluggishness. The measure is the primary business investment and GDP acceleration proxy, and the rate of growth appears different than the fourth-quarter 2024 declines of the overall durable goods orders series. Outside of transport fluctuations, the information conveys a more certain indication of industrial robustness as firms continue to resolutely invest in equipment and technological improvements notwithstanding a still conservative macro environment.
The upgrade indicates normalization of supply chains across the production sectors that had been hampered by international disruptions in the past years. Input and shipping bottlenecks are coming down, allowing firms to fulfill orders more regularly. The development highlights the increased confidence in spending on the industral side, albeit not quite “serious expansion territory” just yet. Firms are taking a cautious tone, matching allotments of the capital with increased geopolitical and trade policy risks. For the analysts, it indicates a slow-but-stable recovery of commitments on the manufacturing side instead of a quick comeback.
From an investment point of view, the recovery in capital goods shipments reaffirms opportunity in industrial automation and equipment suppliers. Emerson Electric (EMR) seems cheap vis-à-vis its global counterparts on the basis of strong free cash flow generation and process automation exposure. Diversified industrial tech portfolios-based companies will be the fastest to reap the rewards of both spending on efficiency and redesigned supply chains. Analysts will remain vigilant on the basis of core orders’ momentum, backlog status, and match of the capital expenditure with broader-based GDP patterns to test the sustainability of that recovery.
Mortgage Applications Stall Despite Lower Rates, Highlighting Affordability Pressures
The U.S. home loan application MBA Purchase Index has remained depressed throughout 2025, failing to recover despite the mortgage rate sliding to 6.2% during the mid-year period. Overall, lower borrowing rates typically spur demand, but housing application activity is slow, due to affordability concerns stemming from high residential prices and more stringent credit conditions. This lack of seasonality suggests that housing demand is more constrained by the pricing structure than by rates, which contributes to weakness in the housing recovery.
The muted reaction is typical of larger studies indicating affordability and pricing strength overcome the impact of mortgage rates when home prices appreciate more quickly than incomes. With the atmosphere sluggish, sellers remain reluctant to move, establishing a stalemate that puts the brakes on transactions and maintains purchasing activity weak. Global analogues support the point: parallel conditions seen across the UK underscore that sizable pent-up demand returned just as prices came down, not merely as mortgage rates declined. Analysts will need to factor the point that unless broader price adjustments or discounts take place, the U.S. housing market languishes even against a more supportive rate environment.
For investors, the current softening of buying activity bodes risk for conventional homebuilders but opportunity within rental-oriented niches. Multifamily REITs, rental management companies, and property tech platforms have advantage as household formation trends sway more conclusively toward renting than buying. We find undervaluation most notably within multifamily housing and rental infrastructure supply companies who will be the beneficiaries of activity shifting away from home ownership. Analysts will want to watch application data, home price concessions, and seller incentives closely as the key levers that will decide if the housing market stabilizes further into 2026 or deteriorates further.
Layoff Rates Hold Steady Despite Industry Headlines on Workforce Cuts
The U.S. layoff and discharge rate has remained stable at 1.1% through July 2025, holding firm despite highly publicized job cuts across major corporations. While announcements from large firms in sectors like retail and technology dominate headlines, aggregate data suggests the labor market is absorbing these adjustments without broad deterioration. This resilience reflects continued strength in services and construction hiring, offsetting selective downsizing in industries undergoing restructuring. The divergence highlights the importance of distinguishing between sector-specific stress and macro-level stability.
Regional and sector differences account for the difference between perceived disruption and reality. Technology- and media-exposed states are reporting steeper corrections, and infrastructure- and energy-investment-connected regions continue to grow payrolls. It reflects international survey information indicating that the adoption of AI and pressure of automation is not evenly spread but focused on knowledge-based sectors. Contrary to estimates that automation would lead to massive unemployment on the long-term agenda, U.S. statistics to date indicates employers are maintaining staff to secure capacity against steady demand and historically low unemployment, currently approaching 3.7%. For the analyst, the message is that technological disruption is occurring on a gradual basis, with adaptation more than sudden mass displacement.
From an investment point of view, the layoff rate stability bolsters consumer strength, supporting demand for discretionary items and services. We identify undervaluation of some consumer-oriented shares and state-exposure regional banks, where household balance sheets are sound. Meanwhile, tech companies that face restructuring may offer selective buying opportunities as they adjust operations to long-term dispositions of Artificial Intelligence integration. Analysts must track regional labor data and corporate restructuring patterns to determine if the layoff stability holds or if localized pressure starts to bleed into broader labor market conditions.
Speculative Stocks Outperform Fundamentals as Sentiment Drives Market Fervor
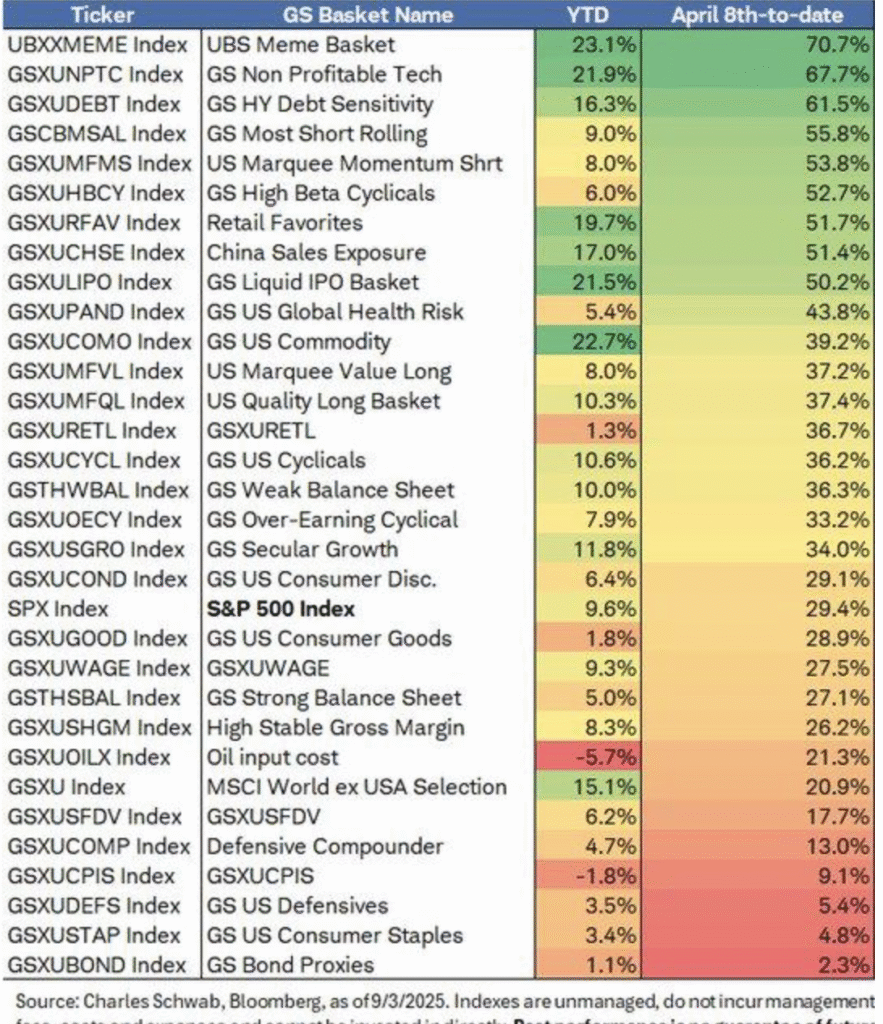
Recent market action exhibits the remarkable departure from old-fashioned fundamentals. Meme stock and non-earner tech indexes have gained 23.1% and 21.9%, respectively, since April 2025, well ahead of more established indexes. It is reminiscent of prior episodes where investor exuberance exceeded earnings strength, questioning the widely held belief that profitability ties long-term relative performance. The phenomenon mirrors speculative inflows fueled by retail activity and liquidity hotspots, reminiscent of late-2020-type rallies of comparable non-earner equity baskets.
Behavioral finance research highlights the role of overconfidence and herd behavior in fueling such moves. Historical data from prior cycles, including the dot-com boom, illustrate how speculative enthusiasm can propel valuations far beyond intrinsic value, only to reverse sharply when sentiment fades. Online communities and digital trading platforms amplify this effect, concentrating demand into narrow groups of stocks and magnifying volatility. While speculative rallies can generate outsized near-term gains, they often carry asymmetrical downside risks when fundamentals reassert themselves. For analysts, the key signal is the persistence of speculative flows relative to earnings trends, which will determine whether the rally extends or unwinds.
For investors, this environment creates both risk and opportunity. The speculative surge highlights vulnerability in segments of the market detached from earnings, while reinforcing the relative undervaluation of profitable, cash-generative firms. We see particular value in established technology and industrial leaders with strong balance sheets, which may be overlooked as capital temporarily chases momentum elsewhere. Analysts should monitor sentiment-driven indices, retail trading flows, and volatility measures as forward indicators of whether speculative strength evolves into a bubble or gradually converges back toward fundamentals.
Upcoming Economic Events
Retail Sales m/m, Average Hourly Earnings m/m, Change in Non-Farm Employment, Unemployment Rate
Given that the times ahead will be pivotal for markets, attention will center on a string of high-impact data releases that provide the cleanest streams on consumer appetite, payroll momentum, and the overall health of the labor market. All of these can potentially redefine investor sentiment, move the U.S. dollar, and influence the course the Fed takes into the fourth quarter of 2025. These are the datapoints to watch, and surprises against estimates can have a ripple effect across entire asset classes.
Retail Sales m/m
Retail sales are the most immediate barometer of consumer strength—the backbone of U.S. GDP.
- A stronger-than-forecast result would confirm that households remain resilient, keeping demand elevated in discretionary sectors, travel, and consumer services. Equity markets would likely respond with gains in retailers, restaurants, and leisure names, though bond markets may sell off as inflation expectations re-price higher.
- A weaker-than-expected print would paint a different picture: confirmation that high prices and borrowing costs are weighing on spending. In that case, defensive sectors like utilities and healthcare may outperform while Treasuries attract safe-haven flows, reinforcing expectations that the Fed could move toward more accommodative policy.
Average Hourly Earnings m/m
The wage data directly guides the story of inflation.
- A surprise positive print would be a sign of continued labor-led cost pressure, yielding Treasury prices lower and a stronger U.S. dollar as the market prices in a more hawkish Fed policy. Financials may be helped by the higher yields, but margin-sensitive sectors like retailing and industrials may be hurt.
- Should earnings growth be lower than anticipated, the opposite dynamic occurs: weaker wage pressure would be supportive of growth equities and rate-sensitive sectors like tech and real estate investment trusts, with bond yields possibly shifting down on lower risk of inflation. For analysts, the data point is one of the most important guides to determining if the Fed describes inflation as “sticky” or “moderating.”
Non-Farm Employment Change & Unemployment Rate
The employment report remains the anchor for labor market analysis.
- A robust upside surprise in payrolls combined with steady or lower unemployment would reaffirm U.S. economic resilience, potentially boosting cyclical and financial stocks while emboldening risk-on sentiment. However, such strength may also fuel expectations that inflationary pressures will persist, creating a tension that limits upside in bonds and adds volatility to growth-sensitive equities.
- A weaker-than-forecast payrolls gain, or a noticeable uptick in unemployment, would suggest the labor market is cooling more decisively. Markets would likely shift toward defensive equities, safe-haven Treasuries, and a softer U.S. dollar, as investors price in a faster pivot toward Fed accommodation. Analysts should track not only headline numbers but also labor force participation, as shifts here often drive the broader narrative.
STOCK MARKET PERFORMANCE
Indexes Rally from April Lows, But Fragile Breadth Signals Ongoing Caution
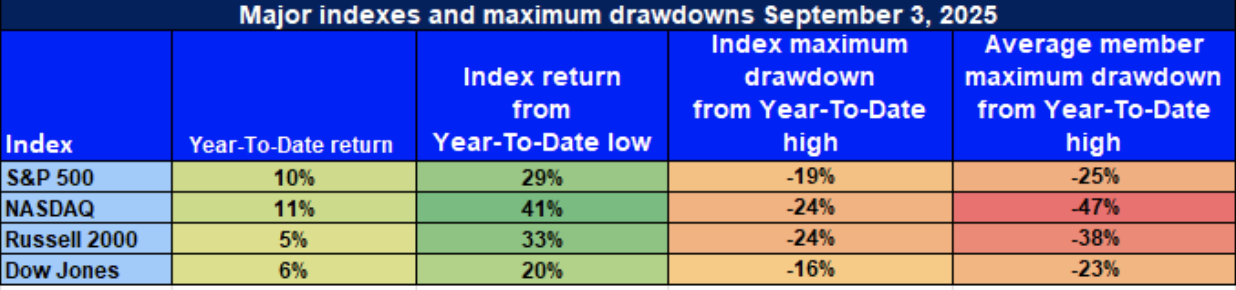
U.S. equity markets have staged a notable recovery since the April 8th trough, yet performance data continues to paint a picture of uneven strength. While index-level gains suggest resilience, the depth of participation remains shallow, and drawdowns highlight that volatility is still firmly embedded in market structure. Investors are finding themselves in an environment where headline rebounds mask underlying weakness, reinforcing the need for selective positioning.
Here’s our breakdown of the latest performance across key indexes:
S&P 500: Strong Rebound, But Breadth Still Thin
YTD: +10% | +29% off April low | -19% from YTD high | Avg. member: -25%
The S&P 500’s 10% gain so far in 2025 and a 29% rebound from the April low reflect the resilience of large-cap market leaders. However, a 19% pullback from year-to-date highs and an average member drawdown of 25% reveal that strength remains concentrated in select sectors. The lack of broader participation underscores caution, with market momentum heavily reliant on mega-cap performance.
NASDAQ: Growth Surge Faces Underlying Fragility
YTD: +11% | +41% off April low | -24% from YTD high | Avg. member: -47%
The NASDAQ has delivered the strongest rebound, gaining 11% this year and 41% from April lows. Yet, a 24% drawdown from highs and severe average member losses of 47% highlight fragility in the growth-heavy index. This dichotomy suggests speculative enthusiasm remains, but volatility risk is elevated, leaving tech investors exposed if sentiment reverses.
Russell 2000: Small-Cap Rally Masks Persistent Strain
YTD: +5% | +33% off April low | -24% from YTD high | Avg. member: -38%
The Russell 2000 reflects modest year-to-date progress of 5%, though its 33% rebound since April illustrates strong upside momentum in smaller names. Still, a 24% decline from highs and an average member loss of 38% show that economic sensitivity and liquidity constraints continue to weigh on broad small-cap participation. Investors remain selective, with confidence in sustained recovery still limited.
Dow Jones: Defensive Composition Provides Relative Shelter
YTD: +6% | +20% off April low | -16% from YTD high | Avg. member: -23%
The Dow Jones, with its defensive tilt, has posted a 6% gain in 2025 and a 20% lift since April lows. Its shallower 16% drawdown compared to peers highlights resilience in traditional value sectors, though average member losses of 23% still signal meaningful pockets of stress. The index offers relative stability but not immunity from volatility.
At Zaye Capital Markets, we view these dynamics as a reminder that headline strength alone does not equate to durable recovery. The uneven breadth across benchmarks underscores the need to favor quality balance sheets, consistent cash flows, and defensive earnings streams. Until broader participation improves, rallies should be treated with cautious optimism, with sector and stock selectivity remaining central to strategy.
Communication Services Leads the Way Among Broader Sector Dispersion
- The Strongest Sector in All These Indices
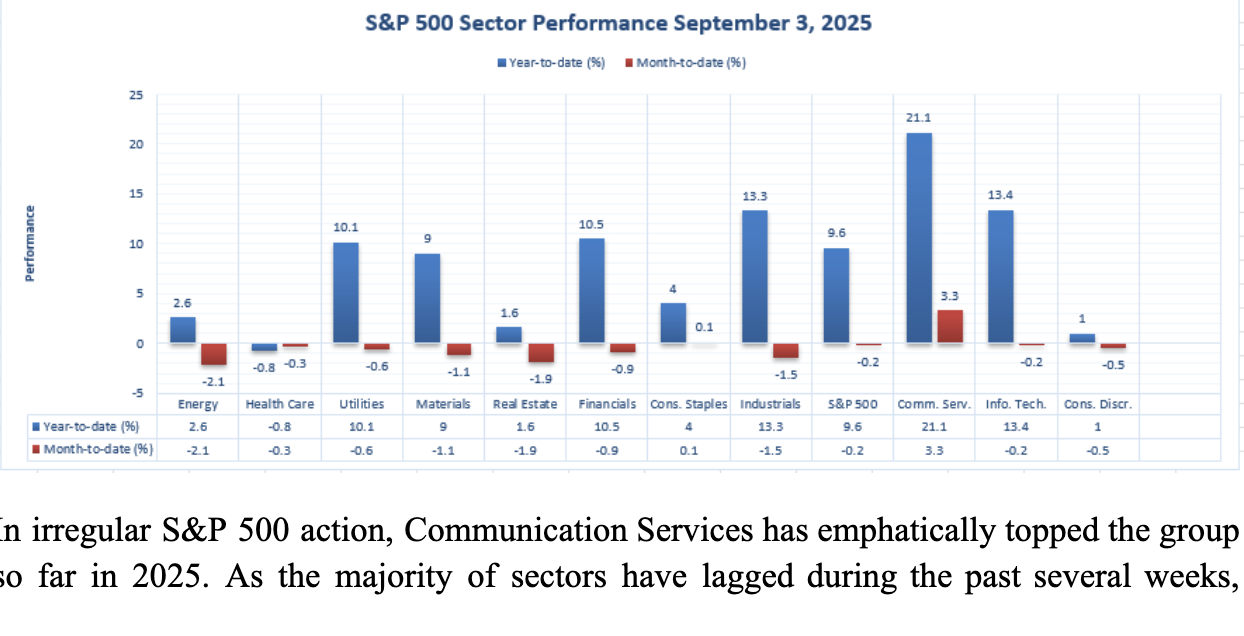
In irregular S&P 500 action, Communication Services has emphatically topped the group so far in 2025. As the majority of sectors have lagged during the past several weeks, Communication Services has remained the year-to-date and month-to-date leader, emphasizing the group’s robustness and healthy buying interest.
Communication Services: Dominant Leadership
YTD: +21.1% | MTD: +3.3% Communication Services is the highest-performing S&P 500 sector year-to-date, increasing by 21.1%. It remains the one group showing notable upside action last month, increasing 3.3% month-to-date as the majority of peers have been down on the period. It reflects the ongoing dominance by the presence of sustainable momentum fueled by the sector-level earnings strength and popular investor demand for digital-led growth stories.
Other Standout Performers
- Information Technology: +13.4% YTD | –0.2% MTD
- Industrials: +13.3% YTD | –1.5% MTD
- Financials: +10.5% YTD | –0.9% MTD
- Utilities: +10.1% YTD | –0.6% MTD
While most sectors have seen double-digit year-to-date performances, the month-to-date downgrades reflect weakening momentum relative to the Communication Services’ remarkable capability to maintain acceleration.
We remain tactically overweight the sectors that have shown both strength and relative resilience. Communication Services, with a YTD of +21.1% and MTD of +3.3%, still provides the best combination of growth, margin improvement, and 2025 digital transformation tailwinds in our book.
Earnings
Yesterday’s Reports (September 4, 2025)
- Broadcom Inc. (AVGO)
Broadcom reported a very strong fiscal Q3, with adjusted EPS of $1.69 and revenue of $15.95 billion, both above expectations and marking a 22% YoY increase. AI-related sales surged 63% to $5.2 billion, while management guided Q4 revenue to $17.4 billion, again above consensus. The highlight was a $10 billion AI chip order from a new customer, reinforcing Broadcom’s position as a core beneficiary of the AI infrastructure boom.
- Lululemon Athletica Inc. (LULU)
Lululemon disappointed markets by cutting its annual outlook due to weaker consumer demand and tariff headwinds. The company now expects revenue of $10.85–$11.0 billion (down from $11.15–11.30 billion) and EPS of $12.77–12.97 versus prior guidance of $14.58–14.78. A projected $240 million hit from tariffs weighed heavily on profit expectations, leading to a sharp decline in its shares post-earnings.
- Copart Inc. (CPRT)
Copart delivered fiscal Q4 EPS of $0.41, beating consensus of about $0.36, up from $0.33 YoY. Revenue came in at $1.13 billion, slightly below estimates but still up 5.2% YoY. Performance was supported by its services business and strong margin discipline, showing steady growth though without a significant upside surprise.
- Samsara Inc. (IOT)
Samsara posted robust Q2 FY2026 results, with annual recurring revenue rising 30% YoY to $1.64 billion and revenue up 30% to $391.5 million. Non-GAAP EPS of $0.12 topped expectations near $0.07. Management also guided Q3 above estimates, reflecting momentum in connected operations technology. Shares rose in after-hours trading as investors rewarded strong execution.
- Pro-Dex, Inc. (PDEX)
Pro-Dex reported fiscal Q4 results yesterday, with revenue rising to $17.5 million (+16.7% YoY) but EPS at $0.36, missing expectations by roughly 23%. Unless a secondary update is released, there is no earnings scheduled today, leaving investors to digest the weaker earnings surprise and assess whether growth in dental and medical device components can offset margin pressure going forward.
Today’s Scheduled Earnings (September 5, 2025)
- Ermenegildo Zegna N.V. (ZGN)
Zegna is due to release first-half 2025 results today, with consensus calling for EPS of about $0.13. Analysts are closely watching direct-to-consumer performance after management highlighted 4% YoY and 6% organic revenue growth in H1, supported by the DTC channel. Investor focus will be on whether Zegna can maintain momentum in the face of broader luxury sector headwinds.
- ABM Industries Incorporated (ABM)
ABM will report Q3 2025 results before the market opens, with consensus at $0.95 EPS on revenue of $2.15 billion. Investors will look for updates on segment performance, backlog trends, and margin outlook in facility services, particularly given the cost pressures across the services sector.
- Kewaunee Scientific Corporation (KEQU)
No earnings are expected from Kewaunee today, as the company is scheduled to release its Q1 FY2026 report on September 10, 2025. Investors will have to wait until then for updates on lab equipment demand and order book performance.
Stock Market Summary – Friday, September 5, 2025
U.S. equity markets surged today on the basis of revived hopes of a more dovish Federal Reserve policy. Backward signs in the labor market led to hopes of rate reduction on the horizon, brightening investor mood and pushing major indices upward. Markets gained momentum on the basis of news of soft labor market data that may act as a catalyst of Fed easing.
Stock Prices
The Geopolitical Trends and Economic Indicators
Cool U.S. labor data supported bets that the Federal Reserve will head towards rate cuts, with sluggish ADP payroll growth and the JOLTS survey reporting jobs available down below seekers for the first time since the pandemic. Though that has raised hopes of monetary easing and boosted equities, ongoing international trade risks and geopolitical tensions within energy markets remain to dampen sentiment, which has investors hedged between policy wishes and outside risks.
Live Stock Updates
- T. Rowe Price Group (TROW): It surged 5.8% on the report that Goldman Sachs plans to invest $1 billion to develop co-branded investment products and model portfolios.
- Goldman Sachs (GS): Gained 2.6%, reflecting market confidence in its expansion strategy within asset management.
The Magnificent Seven and the S&P 500
The “Magnificent Seven”—Apple, Microsoft, Nvidia, Amazon, Meta, Alphabet, and Tesla—remain pivotal to market direction. While today’s gains across indices reflect their continued leadership, broader market participation remains narrow. As these mega-caps pause or pull back, their influence—and fragility—becomes even more pronounced, with energy and industrial sectors unable to fully offset any weakness in tech leadership.
Major Benchmark Performance on Friday, September 5, 2025
- S&P 500: Trading at 6,449.12, up approximately 0.8%.
- NASDAQ Composite: Trading at 21,497.73, up about 0.9%.
- Dow Jones Industrial Average: Closed at 45,621.29, up roughly 0.8%.
- Russell 2000: Trading at 2,365.70, up around 1.3%.
We continue to watch the mega-cap dominance and the macro trends closely at Zaye Capital Markets. While the narrative today is that of optimism on the back of dovish hopes, sustainability of the move is still on the economic data and the recovery of sectoral breadth.
Gold Price
Spot gold is holding at $3,556/oz, near its recent high around $3,579, as December futures remain just above $3,615. The newest policy of President Trump—comprising import levies on semiconductors, pressure on Europe to reduce Russian oil imports, and tougher security agenda—adds layers of risk of inflation and geopolitics, both of which enhance the attractiveness of bullion as a haven asset. On the backdrop of these developments, today’s economic data—Retail Sales, Average Hourly Earnings, Change in Non-Farm Employment, and the Unemployment Rate—are critical. Better-than-anticipated figures may boost Treasury yields and the U.S. dollar, which may pressure gold on the short term, and weaker readings may confirm rate-cutting bets and further drive gold upward to test record levels anew.
Yesterday’s weaker labor readings—only 54,000 private jobs were created in ADP data and JOLTS reporting job openings lower than seekers—tilted the focus of expectations towards a more dovish Federal Reserve, driving real yields down and supporting bullion’s weekly rise. With gold already on track to have its best week since March, sentiment remains positive as long as wages and payrolls do not spark further inflation concerns. The very short-term environment of gold is therefore framed by a dual motivator: a risk premium sustained by Trump’s geopolitical and tariff position, and the softness of the labor market maintaining looser policy bets. Both together act to buoy the metal’s short-term bid, with real yields and the dollar once again being the determining levers of the move.
Oil Prices
Brent is pricing around $66.8/bbl and WTI at around $63.3/bbl, continuing a three-day decline as markets offset a reported 2.4 million-barrel U.S. build in inventories and anticipated OPEC+ supply increase at the next meeting. August OPEC production rose, cementing concerns of more lax balances, and slower 2025 demand growth by the IEA has further established the bearish tone. Meanwhile, the geopolitical undertow is showing support: traders continue to be vigilant to sanction rumor and regional hotspots, maintaining a modest risk premium built-in. News headlines throughout market wires and trading desks underscore the push-and-pull story—bearish supply indications offsetting bullish geopolitical tension.
Trump’s recent comments intensify this balancing act. His push for Europe to halt Russian oil purchases, emphasis on stronger economic pressure on China, and a more aggressive security stance all increase the probability of disrupted trade flows, a bullish catalyst for crude if Russian supply routes tighten. Yet, tariff policies and domestic protectionism raise risks of slower global growth, a bearish force on demand. Yesterday’s softer labor data pointed toward looser Fed policy, easing the dollar and supporting commodities, though the weaker hiring backdrop also hinted at slower fuel use. Today’s critical releases—Retail Sales, Average Hourly Earnings, Non-Farm Payrolls, and the Unemployment Rate—will likely dictate near-term direction: stronger prints could firm yields and the dollar, weighing on crude, while softer numbers would reinforce rate-cut bets, weaken the dollar, and provide room for an oil rebound from current levels.
Bitcoin Prices
Bitcoin is currently trading near $111,200, after moving between an intraday high of about $111,664 and a low near $109,378. The price action reflects investor caution ahead of today’s U.S. economic releases. Regulatory developments are providing a supportive backdrop, with the SEC signaling a “new day” for digital assets by moving to revamp crypto rules and consider exchange-based trading. At the same time, Bitcoin’s network strength is underscored by a record hash rate, while corporate adoption continues to climb with more than one million BTC now held by public companies. These signals highlight both institutional confidence and growing structural integration of Bitcoin into the broader financial system, even as traders warn of seasonal September weakness.
Trump’s latest comments—pressuring Europe to halt Russian oil purchases, imposing tariffs on semiconductors, and emphasizing a hardline security agenda—feed into Bitcoin’s appeal as a hedge against geopolitical and policy risks. At the macro level, yesterday’s soft labor readings (muted ADP payroll growth and weaker job openings) strengthened expectations of a dovish Fed, pushing real yields lower and supporting non-yielding assets like Bitcoin. The near-term driver now rests with today’s economic data: stronger numbers could lift yields and the dollar, weighing on Bitcoin, while softer prints would reinforce rate-cut bets and help sustain Bitcoin above the key $111K level, with analysts flagging $112K as the next important resistance marker.
ETH Prices
Ethereum is changing hands around $4,317.90, which is down around 2% on the day after ranging between an intraday high of approximately $4,430 and a low of around $4,269. The short-term weakness notwithstanding, the whale wallets have been actively accumulating ETH, with the addresses that have between 1,000 and 100,000 ETH raising their exposures by around 14% since the start of April. A recent surge saw 260,000 ETH picked up within 24 hours, and the staking queues have increased to above $3.7 billion, being a strong indication of belief in long-term holding coupled with the generation of yields. Such accumulation bodes well with a bullish tone on ETH, despite the ongoing broader market volatility.
ETF flows have been more prudent, though. Investment products tied to Ethereum registered $135 million of outflows last week, sharply contrasted against the $301 million inflows into Bitcoin ETFs, signaling a fleeting rotation out of ETH on the institutional level. Nonetheless, the aggressive buying by whales and continuous increases in corporate and institution-level treasury holdings of Ether have been counterbalancing forces against ETF outflows, restraining the risk of a deeper decline. With sentiment on the macro level solely relying on today’s U.S. economic data, a dovish result will probably soften the greenback and supply short-term support to ETH, possibly settling prices above $4,300 and triggering a test of the $4,500 region anew.
