Where Are Markets Today?
Markets began Thursday on a positively cautious basis with U.S. equity futures edging up across major indices. The S&P 500 and Nasdaq 100 contracts advanced by roughly 0.2% in pre-market trading in response to a measured rebound after consecutive turbulent sessions. Market participants are seemingly hesitantly positioning for possible gains going forward as they process last week’s Fed rate cut that acted as a modest tailwind. Underpinning this move is some weakening in the U.S. dollar that removes pressure from multinational earnings and commodity prices and assists in stabilizing equity valuations—and large-cap growth names in particular. Nevertheless, cautious remains the word. Market participants are looking forward to today’s pivotal economic data—including Final GDP, Durable Goods Orders, and Unemployment Claims—which are likely to frame the narrative both ways regarding if the Fed continues to ease or pauses to take stock.
Meanwhile, European futures are mixed to slightly negative, reflecting a more skeptical stance. Euro Stoxx 50 futures were down about 0.02%, and FTSE 100 futures were modestly in the red, showing reluctance to follow Wall Street’s cautious rebound. The hesitancy is driven largely by Europe’s persistent struggle with elevated inflation and sluggish growth, which has left the European Central Bank boxed in. Unlike the U.S., where monetary easing has already begun to reprice risk assets, the ECB remains constrained by price stability concerns—especially in key economies like Germany and France. As a result, European equity investors are facing limited policy tailwinds, which continues to cap upside momentum across regional indices. Adding to European sentiment complexity is the dollar-euro divergence. A relatively strong euro, relative to weakening U.S. dollar, is squeezing European exporters—most significantly German industrials and automakers—by rendering their exports less competitive internationally. The currency headwind alongside slower economic recovery and higher energy prices has eroded confidence in indices linked to DAX and export-focused ones. Additionally, geopolitical overhangs—from Russia’s sustained military pressure, Middle East tensions, and trade dislocations associated with energy supply chain logistics—are maintaining volatility high and defining smaller futures trading ranges throughout the region. While U.S. markets are holding out on softer data to enable yet another policy leg, European investors are held captive by structural headwinds.
At Zaye Capital Markets, today’s market configuration is one of cautious divergence, whereby the United States continues to enjoy a semblance of bullish bias amidst European inability to break free from cyclical and structural inhibitions. Both markets’ subsequent phase will be dictated by today’s macro prints. If U.S. data disappoints, equity gauges would rally one more time in hope of accelerated easing. Stronger-than-anticipated data would, on the other hand, redefine expectations, especially for technology and growth stocks having spearheaded recent rebound. For Europe, without new stimulus or sizeable earnings surprises, upside will tend to stay capped. With cross-continental monetary policy keeping out of sync for some time to come, global investors must prepare for region-focused rotations and sharp short-term volatility.
Major Index Performance until Thursday, 25th of Sept., 2025
- S&P 500: Trading at 6,630.44, down 0.5% on the day.
- Nasdaq Composite: At 22,450.61 from here, down -0.6%, selling in mega.
- Dow Jones Industrial Average: Advanced 0.2% to 46,100.35, driven by advances in financials and industrials.
- Russell 2000: Flat at 2,430.17, showing mild outperformance as small caps stabilize.
The Magnificent Seven and S&P 500
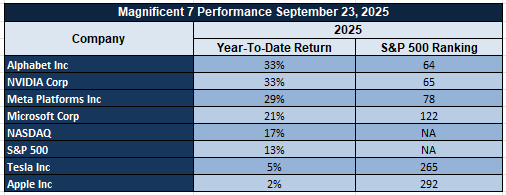
The “Magnificent Seven”—Apple, Microsoft, Nvidia, Amazon, Meta, Alphabet, and Tesla—are feeling pressure once more this week, individually displaying fatigue symptoms. Average sector-wide drawdowns exceeding 18% from recent highs are driving the broader Nasdaq and S&P 500 decline. Tesla and Meta have taken the brunt, with valuations reassessing as optimism about AI-driven bull runs is tempered. This is possibly signifying a change in leadership in the market as investors rotate from having excessive exposure to technology-heavy stocks to other industries such as energy and industrials that have held steady through the volatility. For the S&P 500 index, sustained rally capability remains uncertain without fresh support from its biggest constituents.
Drivers Behind the Market Move
Here are three core drivers for today’s early activity in the U.S. and Europe – through latest news, Trump’s statements, and coming economics:
1. Policy Uncertainty and Geopolitical Rhetoric.
Trump’s aggressive rhetoric—to the UN, against NATO, and regarding Ukraine—has injected fresh geopolitical risk premium into equities. His rhetoric for NATO to shoot Russian planes and turn sharply toward full Ukrainian support (asserting it can recover all lost ground) has provided support to defense and energy sector sensitivity. Defense stocks in Europe are picking up on the back of such policy tone change. On the other hand, Trump’s threat regarding fresh trade investigations into industrial and medical gear, along with comments holding UN responsible for alleged sabotage, has provided layers of uncertainty into trade and institutional stability narratives across the globe. This has resulted in cautionary trading activities, particularly in these export-led and globally exposed industries.
2. Business Activity Weakening and Growth Indicators Becoming More Cautious.
U.S. business activity exhibited additional moderation, with the flash composite PMI falling for the second month in a row. This implies that both industries and services are starting to lose steam as higher-for-longer rates work through the real economy. At the same time, across Europe business sentiment is fading as well — as witnessed by Germany’s unexpected drop in Ifo Business Climate Index. Such indications of ebbing growth are dampening sentiment and underpinning assumptions that any sustained rally will need fresh stimulus or a more convincing disinflation trend.
3. Macro Overhang from Key U.S. Data on the Horizon.
Today’s U.S. economic calendar is very influential and consists of Final GDP, Unemployment Claims, Durable Goods Orders, and the GDP Price Index. These are among releases that will serve as key waypoints for investors tweaking rate expectations. If they signal a weakening economic trend, these will serve to stoke hopes of yet one more Fed rate cut by risk assets like crypto and equities. Better-than-expected prints will, however, fan inflation stickiness worry and delay further policy easing, inducing pressure downwards across asset universes. Investors are generally holding major allocations in preparation for these prints, thus the cautious note across U.S. and European futures.
At Zaye Capital Markets, these dynamics are viewed as both external risk (geopolitics and policy dislocation) and internal economic weakness converging. Conviction in the marketplace remains superficial, and fresh data coming out today will prove decisive on whether sentiment strengthens or stumbles into week’s close.1.
DIGESTING ECONOMIC DATA
The TRUMP Tweets and Their Implications
In a whirlwind series of public statements and policy announcements, President Trump once again drew global attention with a combination of blatant threats, disruptive geopolitical posturing, and aggressive executive commitments. From suggesting that the UN had possibly sabotaged an escalator preceding his announcement, to branding whole governments as “going to hell”, Trump’s rhetoric at the United Nations this week was both aggressive and dramatic. The Secret Service investigation into possible sabotage of the UN elevator—to which Trump linked internal sabotage and arrest grounds—is an additional dollop of procedural drama in what was already a high-stakes week for international diplomacy. These statements are not without effect. They cause additional volatility throughout markets, create additional ambiguity about multilateral cooperation, and transmit mixed signals among both friends and foes. Though the White House later toned-down his Russia comments as a “negotiating ploy,” such immediate market reactions are symptoms of unease with such rhetoric whiplash.
Among Trump’s most significant market-facing implications is his demand that NATO shoot down Russian aircraft defying airspace. While framed as deterrence, such a statement raises geopolitical risk premium across energy and defense markets, particularly in Europe. With his additional remark that Ukraine could regain all lost territory, such comments may encourage U.S. military support and elicit responses from adversarial countries—the ripples that have spilled over in the past into such commodities as oil and gold, and into dollar-related safe-haven demand. His plans to sign executive directives to target domestic terrorist groups and disband Antifa are domestic signaling but may otherwise encourage heightened political polarization leading up to the next session of legislature and induce heightened policy friction and elevated odds for delayed fiscal responses or legislative stalemate.
Economically speaking, Trump’s fresh “America First” stance is also grabbing headlines. A leaked memo revamping funding of foreign aid, alongside newly initiated national-security tariff inquiries into industries like robots/robotic systems, medical devices/medical instruments/equipment, and industrial machinery/industrial vehicles, indicates a fresh protectionist bent. This heralds possible trade ructions ahead, especially among nations highly reliant on U.S. industrial imports. Investors will want to watch tariffs closely, as they tend to ripple out into inflation statistics and corporate earnings, particularly among multinational corporations possessing highly sophisticated supply chains. Trump’s fresh emphasis on cracking down on visa regulations—in spite of open invitations for global viewer ships to sporting events held in the United States—is yet one other piece of confused mixed signals that make cross-border movement-of-people dynamics and global opinion all the more complicated. At Zaye Capital Markets, we view Trump’s current messaging cycle as both near-term market volatility inducer and longer-term structural risk. These comments, though frequently politically calculated, cause volatility in areas essential to global capital flows: defense, trade, public health, and diplomatic unity. Market participants will now seek follow-through in the form of executive action, congressional reaction, or diplomatic repercussions. Until such time, prepare for ongoing headline sensitivity across asset exposures like gold, oil, the U.S. dollar, and risk proxies like Bitcoin—all that are ever more connected to Washington’s political beat.
Housing Spike vs. Labor Weakness
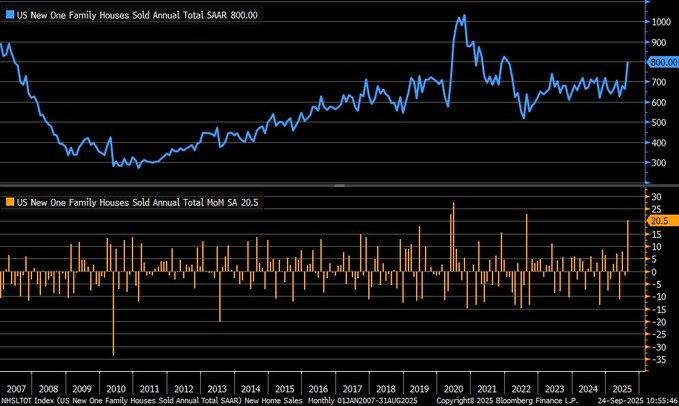
U.S. new single-family sales jumped by 20.5% in August 2025 to an annualized pace of 800,000 units, registering the best pace in more than three years. The increase bucked general macroeconomic weakness and suggested prudent homebuilder measures over a real demand resurgence. With average employment growth over the previous three months coming in at just 29,000, the job market is obviously slowing. Homebuilders had anticipated this and resorted to aggressive pricing and financing offers—the kind of rate buydowns—to rev up activity. Almost 39% of builders dropped their prices in August, the highest such figure since 2020. The median sales price advanced by 1.9% to $413,500, probably registering product mix instead of price strength, as affordability continues to be a limiting factor for many customers.
The drop in housing supply to 7.4 months from 9.0 seems to confirm the demand response, but the bigger picture cautions. Historically, new home sales data is very volatile and often revised downwards. This large spike could simply reflect a statistical rebound instead of a sustainable change in conditions. Furthermore, the drop in 30-year mortgage rates to 6.26% would have probably given urgency to buying, as customers rush to secure good terms on anticipation of Fed rate reductions. However, weak wage growth, lingering inflationary pressures, and dampened labor force momentum test the sustainability of this spike. The housing sector, though stabilizing at the fringes, continues to wade through structural affordability issues. Given these dynamics, select homebuilders with strong cash positions, efficient land pipelines, and vertically integrated financing arms are likely undervalued—particularly those trading at a discount to book value or below long-term P/E ranges. These firms can better withstand margin compression and adapt pricing models to shifting rate environments. Analysts should track revisions to housing data, upcoming mortgage rate trends, and key labor market indicators, especially wage pressures and unemployment claims. These factors will be crucial in determining whether the recent sales spike is the beginning of a broader cycle recovery or simply a short-term reaction to transient financial conditions.
Increase in Foreign Equity Ownership Raises Valuation Red Flags
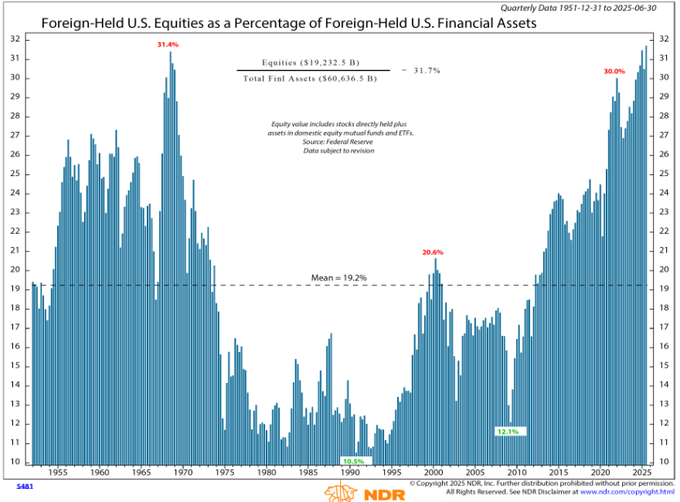
Overseas ownership of U.S. stocks has never been greater than it is now, accounting for 34.8% of all foreign-held financial assets compared to the long-term average of 12.9%. The change indicates a massive shift in global capital flows toward U.S. risk assets that probably was inspired by America’s relative economic soundness, robust corporate profit internals, and global volatility-related safe-haven bid. Speculative and strategic capital has flocked to the relatively robust U.S. marketplace, and this movement intensified dramatically from 2023 through 2025. Foreign equity ownership was only at about 17% in mid-2023, according to treasury data, underscoring how fast and intense this movement has grown.
This sharp rise is accompanied by risks. The current level is decidedly above historical averages, and similar spikes throughout prior cycles have signaled overvaluation followed by corrections. Though global reallocations pay off in near-term momentum, they also expose markets to swift about-faces in the event conditions deteriorate or U.S. assets underperform. Analytical proof indicates these flows are highly sensitive to policy shifts, geopolitical dislocations, and dollar volatility. Lacking structural proof for long-term investor intent, the current level could signal sentiment-driven peak more than sustainable trend. A lack of peer-reviewed proof for long-term supportability at this level raises cautionary flag among investors and policy makers. An internationally visible U.S. asset manager with strong equity flows, robust fee margins, and incrementally international distribution may be undervalued—particularly if its P/E ratio or stock price hasn’t fully captured the full implications of increasing foreign capital flows. Analysts must pay attention to changes in net foreign equity purchases through monthly TIC data, relative U.S. vs. non-U.S. equity valuation measures, and pivotal geopolitical developments that would reverse or maintain this trend in capital flows. With valuation risk heightened, capital flow sustainable-ness attention is paramount.
Manufacturing Softness Rekindles Recession Fear
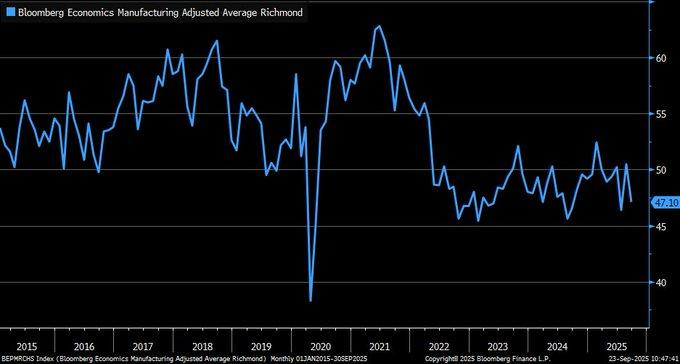
The Richmond Fed Manufacturing Index dropped to 47.1 in September 2025 (ISM-adjusted), underscoring fears about industrial activity weakening more broadly across America. Readings below the 50-mark are conventionally associated with contractionary conditions, and this drop is consistent with previous-cycle indicators pointing to dampening momentum below the surface. Previous research has demonstrated that ongoing manufacturing frailty—and not least in regional Fed indices—is frequently an early harbinger of economic pivot points. The ebbing in new order backlogs to -21 and significant drop in the future employment index to only 1 put additional credibility in the thesis that demand is faltering and hiring plans are stagnating, at least across the Fifth District.
This news arrives as the macro narrative is already tilting into caution. Key leading indicators like housing building permits—the traditional predictors of recession—have already started to turn downwards. These trends, coupled with increasing evidence of tighter credit conditions and sporadic consumer resilience, make the case for a clean post-2023 rebound more difficult. Although inflation has cooled off, the real economy already shows evidence of policy lag effects. The simultaneous onset of contraction in manufacturing and soften housing activity means tailwinds from fiscal and monetary stimulus are waning and leaving the economy more vulnerable to bad shocks. Diversified industrial corporation with lean cost models, predictable backlog visibility, and balance sheet discipline may reflect undervaluation in this context—particularly if trading below historical EBITDA multiples amidst cyclical headwinds. Strategists must keep close attention on regional Fed manufacturing reports, new order developments, intentions for labor, and capital goods new orders. With vital gauges suggesting weakening demand, near-term economic inflection probability seems to be building among analysts and thus calls for more cautious equity allocation across cyclical industries.
Skills Gap Correction Masks Deeper Industrial Strain
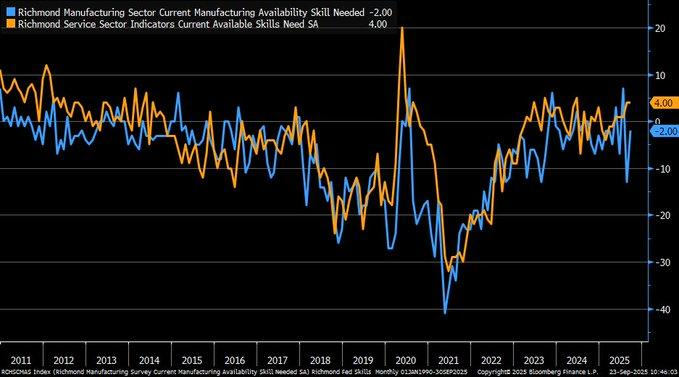
Latest regional statistics reveal a quick correction to the Richmond Fed’s Manufacturing Skills Gap Index declining from a high of 4.0 to below levels in September 2025, implying relief in pressures from labor mismatch. However, the larger Richmond Fed Manufacturing Index plummeted from -7 all the way to -17 in the same period, suggesting underlying demand frailty and structural stress throughout the Fifth District. Conversely, the services side remains steady in the Richmond Fed’s latest survey, suggesting divergent trends throughout the regional economy. The implication is that the observed relief in the manufacturing labor gap may represent stopgap measures—in such form as layoffs or declining hiring demand—instead of a sustainable solution to lingering shortages in the workforces.
National statistics support this view. As of the most recent Bureau of Labor Statistics report, 2.1 million U.S. factory jobs are currently unfilled, highlighting the long-standing mismatch between accessible talent and industrial demand. Though temporary adjustments in skills indices may suggest improved conditions on paper, long-term structural issues are deeply ingrained, particularly in cities such as Richmond whose industrial fundamentals are more exposed to demographic change. A large swath of the regional manufacturing population is approaching retirement and by 2030 will leave 25%, increasing long-term capacity risks and causing lengthy expansion planning headaches for regional makers. A diversified mid-cap supplier to the automation or robotics space with exposure to U.S. reshoring trends and diversified end-markets might be getting neglected valuations, especially ones who provide scalable solutions to labor-constrained manufacturers. These companies are poised to gain from structural shortages of labor as well as multi-year-capital-spending cycles. Analysts must track regional employment participation rates, job openings vs. hires, and retirement patterns across the broader manufacturing space. The skill gap thesis is changing—and not going away—and how it impacts productivity, wage inflation, as well as investment approach must stay at the core of forward-looking thinking.
Full-Time Recruitment Soars While Part-Time Market Withers
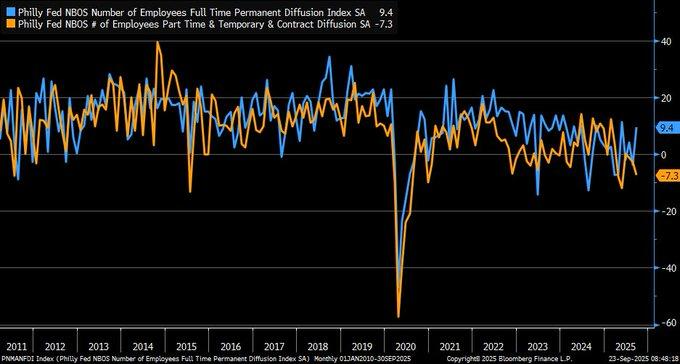
Philadelphia Fed’s recent Services Index indicates employment composition shifting divergently with full-time hiring increasing steadily from 2020 and sharply dropping from 2022 for part-time work. This shift indicates a structural change in how businesses are organizing labor, possibly driven by shifting post-recession approaches and reassessment of workforce imperatives. There’s an increased preference for full-time employment for stability and retaining skills especially in professional and technology-intensive areas of the services economy. On the other hand, industries that had long depended on flexible employment—the retail, hotel, and logistics industries—are experiencing reductions in part-time employment consistent with wage stickiness and rising volumes from automation impacting lower-wage positions.
Labor market statistics verifies the pattern: full-time employment has grown by 3.2% since 2023, and part-time employment has dropped by 1.8%, supporting the idea that employers are valuing long-term, contract-certain employment amidst high macro uncertainty. Though it implies greater job robustness in core industries, it also renders rising sectoral imbalances more visible. With declining opportunities for part-time work, labor force engagement will be distorted for younger or poorer workers reliant on flexible work arrangements. The transition will place stress on household income flexibility in impacted groups despite seemingly healthy headline employment statistics. An employee technology firm emphasizing enterprise scheduling, full-time hiring solution, or automation might be undervalued if it’s trading below historical earnings multiples and faces growing demand for integrated HR platforms. These companies are best-placed to benefit from this reshaping of work. Employment composition in coming regional Fed surveys needs to be watched by analysts along with change in labor force participation and wage growth differentials between full-time and part-time segments. With full-time jobs coming into favor, the services sector is obviously emphasizing consistency over flexibility—a trend that will influence hiring models and income distribution among consumers in coming quarters.
Factory Employment Cracks Behind the Surface
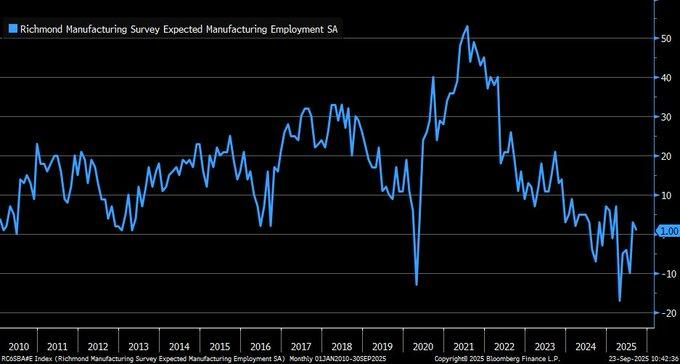
Richmond Fed’s Manufacturing Employment Survey Index dropped to +1 in September 2025 after a sharp retreat from historical standards and indicates manufacturers are retrenching hiring plans as the economy continues to head into greater levels of uncertainty. The weakness is similar to the sharp decline in the broader Richmond Fed Manufacturing Composite Index, dropping to -17 from -7, emphasizing broad demand weakness throughout the industrial economy. The slowdown in employment is not only representative of softer new orders and production levels but also rising constraints associated with ongoing shortages of labor, margin compression, and global supply chain bottlenecks that are still impinging upon planning assumptions.
By surveying industries, 75% of factory CEOs continue to cite large-scale issues finding workers, citing that declining hiring sentiment might not reflect declining demand for employees but rather ongoing shortages for key positions. With this structural absence coupled with weakening demand measures, industrial rebound prospects appear bleak. While high-level employment statistics might hold steady, it’s regional Fed surveys that are flashing red regarding upcoming labor confidence. Of particular note for investors is this decline in manufacturing employment due to it frequently preceding broader economic inflection points and eroding near-term rebound chances. Businesses used to industrial hiring or labor services could see pressure, while businesses that provide automation or productivity-improving solutions could be underpriced—especially those already below cash-adjusted book value or EV/sales historical ranges. Of note, this labor-focused manufacturing slowdown could also spill over to non-traditional areas of the market: past data indicates that manufacturing weakness tends to boost volatility in crypto assets such as Bitcoin, especially on key data prints. Analysts will want to closely monitor forthcoming PCE inflation data, ISM Manufacturing Index updates, and real-time employment changes, as these could further refine expectations about Fed policy orientation and cross-asset risk sentiment.
Upcoming Economic Events
Final GDP q/q, Unemployment Claims, Core Durable Goods Orders m/m, Durable Goods Orders m/m, Final GDP Price Index q/q, Existing Home Sales
This week brings a high-impact series of U.S. economic data that will put the market’s belief in soft landing prospects and the coming monetary policy path to the test. With inflation tempering yet growth indications shifting to mixed, coming sessions will yield critical shifts in terms of positioning by rates, equities, and commodities. Coming from revised GDP to labor market conditions and business investment health, every data point has relevance to how the Fed fine-tunes its next step—and how investors distribute risk in an increasingly uncertain landscape. This is what’s on our watchlist, and how every result will influence broader sentiment:
Final GDP q/q & Final GDP Price Index q/q
- If the Final GDP figure exceeds forecasts, it will strengthen the case that the U.S. economy remains more resilient than feared, potentially extending the rally in economically sensitive sectors such as industrials, energy, and consumer discretionary. However, strong growth could also complicate the case for rate cuts, particularly if it’s paired with an upward surprise in the Final GDP Price Index—a proxy for inflation embedded in growth. A hotter price index would likely push Treasury yields higher, strengthen the U.S. dollar, and put pressure on high-duration tech names.
- Conversely, if both GDP and the price index disappoint, we may see a flight to safety: yields could fall, defensive sectors might gain traction, and rate cut bets for Q4 could resurface quickly.
Unemployment Claims:
Weekly unemployment claims will serve as test for labor-market resilience.
- A below-estimates print will bolster the narrative that employment creation remains robust, likely boosting consumer confidence and near-term risk tolerance—but will also potentially extend inflationary alarms, especially if it signals sustained wage pressures. Markets will then take the data as reason for Fed caution, limiting upside for rate-sensitive stocks.
- A spike in claims will be taken as early chink in employment armor. That sort of miss will offer support for view that tight policy begins to take its toll, which would cause bond demand once again and rotation into utilities, healthcare, and consumer staples.
Core Durable Goods Orders m/m & Durable Goods Orders m/m
Core capital goods orders are one of the most important leading indicators for private-sector business sentiment and investment.
- A beat in these prints would mean corporations are still comfortable making long-term commitments and would be positive for industrials, machinery stocks, and capex-related mid-cap stocks. That said, such gains here would also cause one to question support from the Fed at any point soon.
- A miss would, however, reaffirm corporations are becoming cautious with sustained higher-for-longer rates and geopolitical headwinds and could have cyclical stocks downside and monetary easing assets such as gold and Treasuries upside.
Today’s Home Sales
All eyes will also be on sales of already-built homes, which give a broader view of housing marketplace activity than sales of new homes.
- A larger-than-anticipated figure will signal that recent decreases in mortgage rates are finally unleashing pent-up demand, particularly among repeat buyers, and would help propel stocks of homebuilders and housing providers.
- A disappointing figure will confirm that affordability constraints and tougher credit standards are keeping demand in check—and such an eventuality will stoke controversy over whether the Fed’s current approach is too aggressive given housing’s leading role in America’s economy.
Together, this week’s releases have the ability to shift market expectations across several fronts. At Zaye Capital Markets, we’re watching closely between growth, inflation, and labor data looking for signals if the current “policy in wait” condition will endure—and if forward guidance shifts more forcefully in reaction to the new data. With sentiment brittle and volatility on rates running high, modest surprises will have disproportionate effect.
Stock Market Performance
Indexes Recover from April Bottoms, Yet Member-Level Withdrawals Illustrate Spotty Rebound
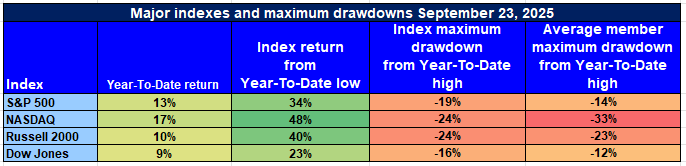
U.S. equity indices have enjoyed healthy rallies off April 8, 2025 bottoms, yet beneath the surface, typical drawdowns for members imply lingering breadth weakness across the marketplace. Index-level returns only partially capture reality—the sheer number of stocks well below prior highs, particularly across growth and small-cap universes. For our firm here at Zaye Capital Markets, it’s proof that it’s still all about selectivity, and volatility and dispersion remains typical in the environment.
S&P 500: Strength in Leadership Hides Greater Weakness
YTD: +13% | +34% lower than April low | -19% lower than YTD high | Avg. member: -25%
The S&P 500 recorded a strong 13% year-to-date rise and advanced by 34% from April’s minimum driven by large-cap leadership. Nevertheless, at current levels, the average component remains 25% off its high, and the index corrected by 19% from its high—the indication that participation remains top-heavily centered. That concentration risk could put a lid on further upward developments without broader support.
NASDAQ: Impressive Bounce, But Deep Underperformance Beneath
YTD: +17% | -48% below April low | -24% below YTD high | Avg. member: -47%
The NASDAQ has taken the leadership on the rebound side, rising 48% off the April low and achieving a 17% year-to-date rise. However, average membership has experienced a debilitating 47% drop from tops—the weakest among the large indexes. This indicates steep losses throughout middle-tier technology names despite index leaders dragging performance upward.
Russell 2000: Small-Caps Struggle for Traction Despite Recovery
YTD: +10% | +40% below April low | -24% below YTD high | Avg. member: -38% Even though it had a steep 40% April rebound and was up 10% YTD, the Russell 2000 remains evidence of investor trepidation with small-cap exposure. A drop from year highs by 24% and median/member declines by 38% suggest continuation of macro sensitivity and weaker earnings traction in this space.
Dow Jones: Defensive Exposure Fuels Weak Performance
YTD: +9% | +23% lower than April’s low | -16% lower than YTD’s high | Avg. member: -23 The Dow has risen by 9 this year and by 23 from April bottoms, in large part due to exposure to seasoned dividend stocks. That index also has had the lowest peak drawdown among all four indexes at 16%. Yet by averages, it’s off highs by 23%, which demonstrates that not even defensive exposure has shielded from general equity weakness.
Again, at Zaye Capital Markets, we remain quality-focused over momentum and prefer stocks with sustainable earnings, healthy free cash flow, and minimal leverage. As breadth remains flimsy and dispersion elevated, our view is to exercise caution near index chases and opt for a more selective method centered on relative strength and downside protection.
The Strongest Sector in All These Indices
Communication Services Assumes Leadership as Industry Growth Expands
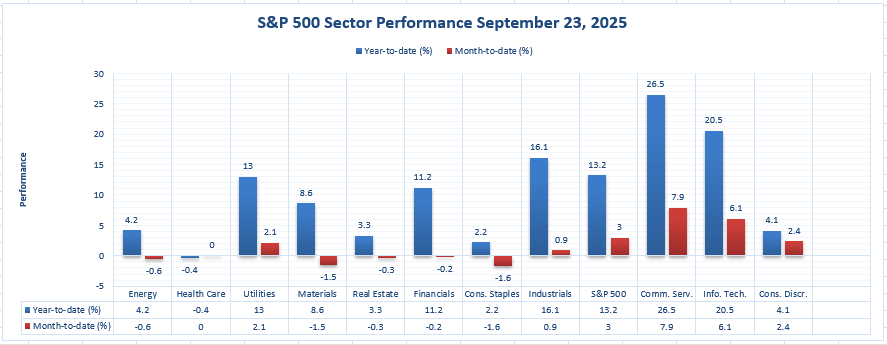
Through September 23, 2025, Communication Services has solidified itself as one of the top-performing sectors within the S&P 500 by beating all peers on both year-to-date and month-to-date tracks. The sector has jumped +26.5% YTD by quite some distance over the broader index’s +13.2%, and is maintaining vigor with a +7.9% MTD return, illustrating sustained momentum across fundamentals and investor sentiment. Such outperformance is driven by a combination of earnings durability through pandemic-related headwinds, capital-light business models by nature, and exposure to digital ads and streaming services that are riding global consumption waves.
Next was Information Technology which also delivered a respectable performance with +20.5% YTD and +6.1% MTD gains, with investors’ interests in growth stocks linked to artificial intelligence and cloud infrastructure behemoths staying healthy. That said, it’s Communication Services which has exhibited leadership most steadily by advancing despite volatility spikes over the recent past and implying additional institutional optimism in earnings.
In our opinion, Communication Services’ outperformance remains cyclical and structural. With growing operating leverage and better ad-spend fundamentals, the space remains worthy of its premium. We’re positive but selective, preferring diversified digital revenue-driven firms with robust free-cash-flow generation and pricing capability across core markets. Analysts must keep close attention on ad spends, engagement metrics on platforms, and large-cap leadership’s guidance to test the endurance of this outperformance into Q4.
Earnings
Earnings Review — 24 September 2025
- Cintas Corporation
Cintas Corporation released its fiscal Q1 2026 results on 24 September 2025. Revenue came in at $2.72 billion, up 8.7% year-on-year (including 0.9% from acquisitions), while diluted EPS rose to $1.20 from $1.10, a 9.1% increase. Gross margin expanded slightly to 50.3% (up 20 basis points), and operating margin reached 22.7%. Cintas raised its full-year guidance: revenue to $11.06–$11.18 billion (from prior $11.00–$11.15 billion) and EPS to $4.74–$4.86 (from $4.71–$4.85). To support this, the company repurchased $347.4 million in stock through Q1 and increased the quarterly dividend by ~15.4%. Cintas delivered a modest beat on revenue and EPS vs. consensus. Margin expansion, while mild, signals continued operational discipline; raising FY guidance shows confidence in demand continuity. Watch capital return discipline: share buybacks and dividends support investor return, but interest rates and working capital cycles could stress free cash flow. The raise in guidance sets a higher bar; any forward softness (in bookings, pricing) may cause multiple compression.
- Uranium Energy Corp.
Uranium Energy Corp. disappointed with an EPS of –$0.06, missing the estimated –$0.04 by a wide margin, reflecting a –69.49% negative surprise. Revenue was $8.5 million, but operational turnover for the quarter was listed as zero, indicating limited activity or project delays. The results point to ongoing volatility in uranium production and highlight the cyclical, project-based nature of the company’s revenue generation. Investors should stay alert to the company’s forward production guidance, exploration updates, and geopolitical factors affecting uranium pricing as drivers of next-quarter recovery potential.
- Thor Industries, Inc.
Thor Industries posted a strong earnings beat with EPS at $2.36 against a consensus of $1.28, reflecting an 84.04% positive surprise. Revenue also came in higher at $2.52 billion, surpassing the expected $2.32 billion. The beat was driven by better-than-expected demand in the RV segment, operational efficiency improvements, and cost control initiatives. This quarter’s performance suggests the company is managing input inflation better than expected and signals possible upside revisions if demand holds steady into the winter months. Inventory and dealer sentiment will be critical for future volume trends.
- KB Home
KB Home reported EPS of $1.61, ahead of the $1.50 estimate, yielding a +7.22% surprise. Revenue hit $1.62 billion, slightly above the forecast of $1.59 billion. Strong pricing discipline and higher deliveries contributed to the top-line performance, while cost containment and improved gross margins helped drive the earnings beat. Given the current macro backdrop with declining mortgage rates and builder incentives in play, KB Home appears well-positioned among large-cap builders. However, analysts should monitor backlog trends and cancellations, as the broader housing sector remains sensitive to labor shortages and affordability pressures.
Earnings Preview — 25 September 2025
- Costco Wholesale Corporation
Costco is anticipated to report Q4 (FY2025) adjusted EPS around $5.80, with revenue near $86.01 billion and same-store sales growth ~5.9%. Investors should focus on margin pressure from rising costs, changes in membership revenue, U.S. vs international comp growth, and guidance amid supply chain / tariff uncertainty.
- Accenture PLC
Expectations for Accenture PLC center on consulting and technology services demand, foreign revenue mix (especially Europe), and margin sustainability under labor cost pressures. Guidance and commentary on global IT spending will be closely watched for macro implications.
- Jabil Inc.
Jabil’s results will hinge on end-market demand across consumer electronics and industrial verticals, backlog visibility, input-cost trends, and inventory digestion. Any updates on diversification or cost control measures could influence sentiment.
- TD SYNNEX Corporation
For TD SYNNEX, the focus will be on distribution volumes, supply chain constraints, technology spending trends, and margin resilience amid hardware/software mix shifts. Upside surprises in any of these firms could reinforce broader demand resilience, especially in tech and enterprise segments. Misses—especially in guidance or margin contraction—may raise questions about consumer and business capex sensitivity heading into late 2025.
We at Zaye Capital Markets will monitor revenue vs guidance deviation, margin trends, order/backlog dynamics, and forward guidance for signs of accelerating or decelerating momentum.
Stock Market– Thursday, September 25, 2025
U.S. equity indexes started off softer as sentiment remains to temper due to ongoing concerns over lofty valuations, central bank attitudes, and elevated Treasury yields. Despite S&P 500 and Nasdaq’s pressure from drops by mega-cap tech issues, both Dow Jones and Russell 2000 are breaking out slightly better as funds rotate into defensives and industrials.
Stock Prices
Economic Factors and Geopolitical Events
This week’s market anxiety is caused primarily by recent remarks by Federal Reserve Chairman Jerome Powell that cautioned U.S. equity valuations are “fairly highly valued” and rang alarm bells about stretched multiples, especially in growth segments. This was in addition to weakening manufacturing prints and bleak durable goods orders to confirm sentiment that despite disinflating inflation, growth itself is slowing. At the same time, fresh geopolitical concern about U.S. trade tensions with China and general global growth slowdown risks are causing investors to move into risk-off positions.
Latest Stock Updates
- $INTC | Intel is said to be negotiating a strategic funding from $AAPL | Apple, which could see both engage in a historic cooperation in chip fabrication or artificial intelligence acceleration. Though details are not forthcoming, such cooperation would enable Intel to catch up competitively in sophisticated chip development.
- $OPEN | Opendoor Technologies jumped after Jane Street revealed a 6% stake in the firm, reflecting rising institutional buying interest in the residential-tech platform. The stock is coming into view as a speculative rebound play as hints of stabilization emerge in segments of the housing space.
- GOOGL | Alphabet (Waymo) launched “Waymo for Business,” a new business-facing product allowing businesses to book robotaxi rides for employees in five cities in the United States. That’s a broadening of Waymo’s commercial deployment and new attempt to generate revenue from autonomous driving technology at scale.
The Magnificent Seven and S&P 500

The “Magnificent Seven”—Apple, Microsoft, Nvidia, Amazon, Meta, Alphabet, and Tesla—are feeling pressure once more this week, individually displaying fatigue symptoms. Average sector-wide drawdowns exceeding 18% from recent highs are driving the broader Nasdaq and S&P 500 decline. Tesla and Meta have taken the brunt, with valuations reassessing as optimism about AI-driven bull runs is tempered. This is possibly signifying a change in leadership in the market as investors rotate from having excessive exposure to technology-heavy stocks to other industries such as energy and industrials that have held steady through the volatility. For the S&P 500 index, sustained rally capability remains uncertain without fresh support from its biggest constituents.
Major Index Performance until Thursday, 25th of Sept., 2025
- S&P 500: Trading at 6,630.44, down 0.5% on the day.
- Nasdaq Composite: At 22,450.61 from here, down -0.6%, selling in mega.
- Dow Jones Industrial Average: Advanced 0.2% to 46,100.35, driven by advances in financials and industrials.
- Russell 2000: Flat at 2,430.17, showing mild outperformance as small caps stabilize.
At Zaye Capital Markets, rotation moves, macro indicators, and fund flows are closely watched. With earnings season in full swing, top companies’ penchant to sustain profit momentum—with inflation and policy risks in sight—shall be instrumental in determining market direction through Q4.
Gold Price
Gold is trading at $3,748.68 per ounce as of Thursday, September 25, 2025, registering a slight intraday rise of 0.33%. The price movement demonstrates a guarded but positive mood throughout the market as investors process a mixture of macroeconomic cues and tart geopolitical rhetoric. The international environment for gold is getting progressively accommodative as new uncertainty emanates from both geopolitical and economic flanks. President Trump’s aggressive rhetoric at the UN—from charges of sabotage and escalator vandalism to calling on NATO to shoot Russian planes out of the sky—reached new levels of geopolitical tensions, while warnings of an executive directive on domestic terrorism and sudden shifts in foreign policy such as revamping “America First” funding are stoking safe-haven buying. The scenario that all territory lost by Ukraine would be regained, though presented as optimism, injects one more source of volatility into already shaky geopolitical context. Conventionally speaking, such aggressive posturing—particularly when coupled with uncertain diplomatic dynamics—usually pushes capital toward gold as insurance for system-wide shocks. Additionally, Trump’s suggestion that the UN possibly staged a security debacle provides one aspect of conspiracy-fomented volatility that would erode confidence among markets. Today’s U.S. economic calendar—to include Final GDP, Unemployment Claims, Durable Goods Orders, and Final GDP Price Index—can confirm or dismiss this gold-positive trend. If growth or inflation disappoints to the downside or surprises to the upside, it could stress test gold as real yields take one step closer to positive ground and Fed rate cuts are delayed. On the other hand, if data confirms lingering economic weakness it would cement support for gold as a non-yielding defense asset. Yesterday’s surprise in housing sales was inconsistent with sustained weakening in the labor market and triggered mixed signals about economy health. For gold, this ambiguity is positive as investors tend to take refuge in safety as policy clarity wanes. With real rates stuck in a volatile neighborhood and tensions rising globally, we at Zaye Capital Markets consider today’s environment as one positive for allocation to gold—at least as volatility across equities, geopolitical tensions, and central bank policy all converge together in a high-alert environment.
OIL PRICES
Crude oil is trading modestly off $64.72 per barrel for WTI on Thursday, September 25, 2025, after reaching a seven-week high. The market had become increasingly responsive to both near-term supply shortages and general macro headwinds. Support had arrived through an unexpected 607,000-barrel U.S. draw from stocks and ongoing supply chain risks emanating from Eastern Europe. Russia-related disruptions and tight stocks in Cushing and North Sea terminals had spurred elevated risk premia earlier this week. Profit-taking and cautious trading in preparation for today’s thick U.S. economics calendar are now muting sentiment. Speculation was stoked by the International Energy Agency (IEA), cautioning recently that global oil markets could switch into oversupply by year-end as demand declines and non-OPEC+ producers increase output. Confirmation from OPEC’s Joint Ministerial Monitoring Committee (JMMC) in coming days is now sought after possible revised output target advice amidst shifting demand dynamics. Trump’s string of high-wire geopolitical statements have injected volatility into energy space. His exhortations for NATO to shoot Russian planes out of the sky, his UN broadside, and new “America First” directions for foreign aid have injected geopolitical risk into an already precarious environment. While oil tends to spike on geopolitical tensions, Trump’s volatility—the talk of sabotaged escalators through to executive directives aimed at domestic disorder—has brought policy fog not actionable signals. Yesterday’s contradictory economic data, strong home sales contrasting with feeble labor momentum, has made demand expectations uncertain. Tomorrow’s Final GDP, Durable Goods Orders, Unemployment Claims, and GDP Price Index could radically redefine oil’s near-term trajectory. Strong data could take oil higher on demand confidence, and downside surprises confirm IEA’s oversupply issues and prompt fresh selling. At Zaye Capital Markets, oil seems to us to have entered a critical recalibration period—between hard evidence, political static, and an energy space looking for balance.
Bitcoin Prices
Bitcoin traded at $112,916.00 as on Thursday, September 25, 2025, marking a modest 0.78% day’s gain and following through on its rebound after a turbulent start to the month. Market watchers are offsetting near-term liquidation risks—the over $1.5 billion in derivatives eliminated earlier this week—with institutional optimism building. Coinbase CEO Brian Armstrong fanned sentiment by outlining Bitcoin potentially reaching $1 million by 2030 by virtue of long-term scarcity fundamentals and increasing global recognition. Related news flow about SEC moves to consolidate crypto ETF approvals has injected fresh optimism about regulatory outcomes and pushed digital assets closer to mainstream attention. Same script continues to receive support from increasing numbers of asset managers and hedge funds increasingly talking about Bitcoin and Ethereum as “strategic portfolio allocations” and solidifying them as something more than speculative wagers. Price action remains sensitive to headlines as money managers navigate carefully between structural positives and macro volatility. President Trump’s recent spate of forthright and unconventional geopolitical rhetoric—from talk about dismantling Antifa networks to cautions to NATO over airspace incursions and UN sabotage allegations—added fuel to the uncertainty-fomented demand for decentralized assets. Such rhetoric strengthens perceptions about global instability, a familiar crypto inflow driver as investors turn to assets outside traditional financial architectures. Yesterday’s mixed U.S. economic data—with resurgent new homes sales contrasting with lingering labor market frailty—has meanwhile made policy expectations murky, often supportive for Bitcoin’s role as a macro hedging vehicle. Ahead, today’s Final GDP, Durable Goods Orders, Unemployment Claims, and GDP Price Index will receive close attention. If data is robust, tighter monetary policy expectations could temporarily put a top on upward momentum; if such prints soften, dovish speculation would get recycled and fresh capital redirected into crypto space. At Zaye Capital Markets, Bitcoin’s positioning continues to receive attention not only as speculative play but sentiment proxy for wider macroeconomic fragility and institutional risk tolerance.
ETH Prices
Ethereum (ETH) is currently trading at $4,112.35 as of Thursday, September 25, 2025, reflecting a modest 0.97% decline on the day as it clings to the critical $4,100 support level. This zone has become an essential battleground for short-term direction, with intraday swings reflecting both macro jitters and on-chain positioning. Despite the slight pullback, Ethereum’s market structure remains largely constructive, underpinned by declining exchange balances—a sign that whales and institutional investors are pulling ETH off exchanges and into cold wallets. In the ETF space, ETH-linked products have seen stronger net inflows than Bitcoin ETFs over the past several sessions, as investors increase exposure to Ethereum’s growing use case in real-world tokenization, smart contracts, and layer-2 scaling adoption. Institutions appear to be rotating into Ethereum at a moment when traditional markets are searching for alternatives to rate-sensitive equities, particularly as crypto-native yields become more attractive in a high-rate environment. Analysts are also watching layer-2 adoption metrics and gas fee compression, both of which are improving Ethereum’s long-term fundamental case.
Recent whale activity has added both conviction and volatility to ETH’s trading behavior. Notably, a whale wallet accumulated $43.7 million worth of ETH, interpreted as a long-term signal of confidence at current price levels. At the same time, other major holders have been seen selling ETH at a loss, likely driven by short-term macro nerves and profit protection after September’s earlier gains. This divergence is creating a choppy environment, where both accumulation and capitulation are playing out simultaneously across different investor classes. If today’s U.S. economic data—Final GDP, Durable Goods Orders, and Jobless Claims—print weaker than expected, Ethereum may benefit from renewed dovish expectations and increased inflows into crypto as a macro hedge. However, stronger-than-forecast numbers could put pressure on ETH by strengthening the dollar and pushing real yields higher, which historically dampens crypto risk appetite. At Zaye Capital Markets, we view ETH’s current consolidation as a tug-of-war between growing institutional conviction and short-term macro uncertainty, with today’s data poised to provide the next directional cue.
