Where Are Markets Today?
U.S. stock futures are opening modestly higher on Monday, September 29, 2025, as contracts related to the S&P 500 and Nasdaq 100 advance about 0.2% to 0.3%. Following a rocky previous week that saw investors rotate out of high growth names amid rising scrutiny about the Fed’s shift in policy, that’s a positive morning. It seems the big catalyst behind the day’s strength is the softening U.S. dollar, which has traditionally been a source of tailwinds among multinational corporations through facilitating easier global liquidity markets and enhanced export competitiveness. Bargain hunters also are wading back into the summer rally leaders that recently suffered a sharp correction, namely the technology and consumer discretionary sectors. Even so, the advance is still pretty tentative due to imminent political risk, chiefly the unresolved standoff in Congress that potentially culminates a U.S. government shutdown. That would push back big economic releases, blur the vision that the decision-making apparatus of the Fed requires to inform monetary policymakers, as well as induce fresh risk-asset uncertainty.
Over in Europe, Euro Stoxx 50, DAX, and FTSE futures are also pointing slightly higher, tracking Wall Street’s cautious optimism. Investors on both sides of the Atlantic are attempting to price in the implications of a looser U.S. monetary policy stance and potential rate cuts in early 2026. However, unlike the U.S., the European Central Bank remains constrained. Persistent inflation in core economies like Germany, France, and Italy has limited the ECB’s ability to pivot dovish, creating a divergence in global policy paths. That divergence—where U.S. financial conditions are softening while European policy remains tight—has begun to favor U.S. equity markets over European ones. Additionally, the relatively stronger euro is hurting sentiment across export-heavy sectors like industrials and autos, particularly in Germany. With European growth data remaining soft and structural inflation elevated, investors are understandably reluctant to make aggressive directional bets in the region.
Two key forces are driving this muted tone in futures markets. First, the relentless fall in the U.S. dollar is providing a wide tailwind to global risk assets. It releases pressure on dollar-denominated debt in emerging markets, enhances corporate earnings clarity among U.S. exporters, and supports commodity-linked economies that enjoy tight trading links to Europe. Secondly, bipartisan gridlock in Washington, as well as high inflation throughout Europe, has capped sentiment. Investors recognize short-term opportunities in high-quality assets—above all those that borrow cheaply, have strong balance sheets, and little duration risk—and are nonetheless concerned about systemic shocks. These include possible shutdown drags, postponed releases, as well as erratic Federal Reserve communication as implied recently by remarks by some Fed officials like Barkin. At Zaye Capital Markets, we see the current futures positioning reflecting a market that’s in “data-watch mode,” looking to wait until they see where things stand before chasing the upside. Political uncertainty in the U.S. as well as monetary divergence in Europe act as speed bumps to otherwise being a wider risk rally. Today’s modest gains indicate a desire to be long selectively—in the parts most aided by a soft dollar as well as accommodative central banks—but not a full return to risk-on sentiment. It’s likely that futures will stay capped until investors see clarity on fiscal stability in the U.S., persistence in inflation in Europe, as well as monetary coordination around the globe. Until then, intraday moves will be more driven by headlines than fundamentals.
Major Index Performance up to Monday, the 29th September, 2025
- S&P 500: Trading at 6,641.88, down 0.4% on the day.
- Nasdaq Composite: At present stands at 22,399.72, lower by 0.6%, as big-cap.
- Dow Jones Industrial Average: Up 0.3% to 46,170.56, supported by gains among financials, energy.
- Russell 2000: Higher by 0.2% to 2,437.89, where small caps.
The Magnificent Seven and the S&P 500

The “Magnificent Seven”—Apple, Microsoft, Nvidia, Amazon, Meta, Alphabet, and Tesla—are keeping the market lower still, with new losses gaining steam heading into Monday. Tesla and Meta are the leaders on the downside, both off more than 4% on the week. Typical drawdowns throughout the group are above 18% off recent highs, eroding the stability the S&P 500 enjoys as a consequence of their combined market cap weighting. This weakness driven by the tech sector is a reflection both of the necessary recalibration of valuations as much as waning optimism around AI mania and increasing regulator pressure. As this core group cannot find their footing, other sectors such as energy, industry, and financials are already taking inflows as alternatives—but to no scaling necessary to make up lost ground on mega-cap weakness. Resilient upside within the broader market now seems doubtful without help from these leaders.
Drivers Behind the Market Movement
Following are three big market movers behind the current pre-market action in the U.S. and Europe — due to the recent developments, statements by Trump, as well as upcoming economic releases:
- Trump’s Economic Optimism and Trade Commentary
Trump’s recent tweets — “the economic numbers are great” and “prices are down” — have contributed to a cautiously optimistic mood in markets, most notably the U.S. He also stressed the administration’s $200 billion in tariff income, as the Supreme Court weighs the legality of those actions. While the story conveys economic prowess and advocates consumer-oriented sectors, investors are also offsetting it with the threat of policy excess. Moreover, the aggressive rhetoric about trade—paralleled by Navarro’s remarks regarding pharmaceutical tariffs as well as China-Vietnam-Indonesia supply domination—is introducing uncertainty around manufacturing margins as well as global trade relationships. Markets are reacting with selective positioning, rotating into those sectors that are capable of soaking up the volatility stemming from policies or hedging the same.
- Inflation Surprises and Diverging Monetary Paths
In Europe, Spanish Flash CPI came in higher than expected at 3.1% y/y vs the 2.7% forecast, reigniting concerns that inflation remains stickier than the European Central Bank anticipated. This reduces the ECB’s ability to turn dovish, which contrasts with growing bets that the U.S. Federal Reserve may pivot sooner. Meanwhile, investors continue to digest yesterday’s U.S. data, where core PCE held steady and durable goods orders showed signs of strain. Together, these prints reinforce the narrative that inflation is proving persistent while growth may be slowing, leaving both central banks in difficult positions. This policy divergence is adding tension to currency markets and sector rotations in both regions.
- Macro and Political Risk Capping Upside Potential
Aside from economics, politics continue to be a prime overhang. The specter of a U.S. government shutdown—a possibility this week-end of some funding holidays—is causing concern. A shutdown would postpone significant data releases and blur clarity for the Fed, undermining short-term conviction in both risk and defensives. Sensitivity to geopolitics gets a further boost due to Trump’s remarks about reaching a Gaza deal as well as Netanyahu’s imminent speech on Iran’s nuclear program. Investors are getting progressively nervous about tail risks—from domestic political deadlock to Middle Eastern unpredictability—and are reacting accordingly, cutting back on high-volatility names while overweighting high-quality defensives as well as short-duration trades.
Zaye Capital Markets interprets current market sentiment as a product of opportunistic sector rotation coupled with defensive hedging. Data-heavy week, combined with high-impact rhetoric by Trump as well as global policy divergence, has contributed to thin conviction across the major indices. As long as macro clarity is absent or geopolitical risk remains high, intraday swings are likely to be the order as investors respond more to headlines than fundamentals.
Digesting Economic Data
TRUMP Tweets and their Implications
Over the last 48 hours, a flurry of comment from Donald Trump has run through markets, ranging from economic optimism to key global security flashpoints. Repeating his claims—”the economic numbers are great,” and “economy is doing well, prices are down,” indicate a concerted effort to cement a rosy macroeconomic story. These remarks are likely designed to be positive build-up ahead of potentially another big policy phase. For markets, the statements feed risk-on sentiment at the headline level. However, the inconsistency between this optimism and soft spots in the data—such as weakening durable goods orders and fragile labour market—is that investors will likely view these assertions through a skeptical prism, as core inflation and unemployment are still unresolved.
Geopolitically, the mention of Trump’s conversation regarding Israeli Prime Minister Netanyahu’s discussions regarding Iran’s resumed ballistic missile aspirations and nuclear program indicate higher tensions within the Middle East. These statements, coupled with his comment that “we’re very close to a deal on Gaza,” engender confusion: while, on the one hand, diplomatic breakthroughs within Gaza would lower regional volatility, on the other, resumed attention to Iran’s military future could reinstall volatility into energy as well as military markets. To oil traders, the ambivalence may cause price whiplash as supply risk premiums fluctuate up as well as down depending on the tone as well as apparent proximity to breakthroughs. On the issue of trade and technology, the framing of Oracle as “the great firewall of America” and the deal structure that keeps 50% of the U.S. profits of TikTok with ByteDance reflect his government’s shift in tech nationalism. At the same time, the more than $200 billion collected in tariffs is being framed as a policy win, although the legality of those tariffs still is before the Supreme Court. These moves create important crosscurrents into the tech, communications, and consumer goods spaces—to the benefit of companies that are most exposed to Chinese, Vietnamese, or Indonesian manufacturing. Navarro’s attention to pharma and furniture tariffs also expands the range of the sectors that are now subject to possible margin compression or supply chain reordering.
Taken together, these statements paint a picture of assertive economic stewardship, intense regulatory control over digital and pharmaceutical domains, and high-stakes diplomacy. For investors, the market implication is layered: equity markets may initially respond to the pro-growth tone, but volatility will persist as legal, diplomatic, and policy uncertainties unfold. At Zaye Capital Markets, we advise clients to view Trump’s stream of commentary not as market signals in isolation, but as part of a broader narrative strategy with potential to reshape sector flows, sentiment trajectories, and risk pricing in the weeks ahead.
PCE Stability Defies Tariff Shock — Delayed Impact or Supply Chain Resilience?
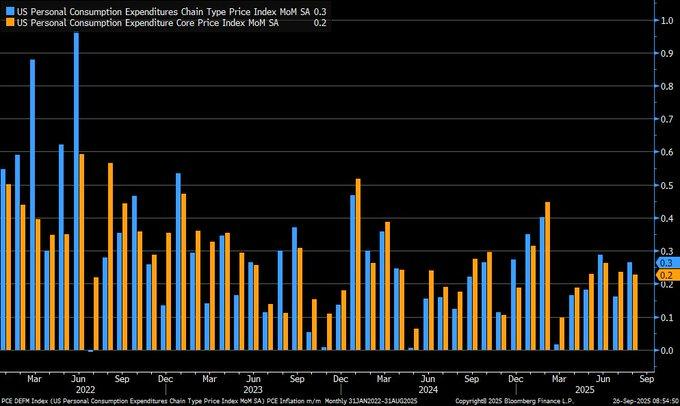
Aug PCE inflation registered a monthly rise of 0.3%, as expected, as did the core gauge’s unchanged 0.2% advance. But buried beneath the surface, the data defies conventional wisdom: even after imposing 10-20% tariffs on Chinese imports during the first half this year, pass-through inflation is subdued. That defies an oft-used estimate that such tariffs would induce price hikes by 0.5-1%. The disconnect implies either a lagged inflation response or enhanced supply chain elasticity as also company pricing restraint, even as input costs rise.
We interpret this as a potential turning point in how market participants and policymakers assess inflation dynamics. The Fed’s preferred PCE measure, which accounts for shifting consumer behavior like product substitution, provides a more grounded look at real-world pricing pressure. With the central bank already trimming its policy rate to 4.00–4.25% in mid-September, the stability of inflation under recent trade pressure may justify further policy easing if productivity trends continue to offset cost shocks. However, this remains contingent on how global trade tensions evolve heading into Q4.
In our view at Zaye Capital Markets, semiconductor equipment as well as industrial automation stocks still offer value here. These sectors benefit from reshoring, capex cycles, as well as productivity-induced disinflation, although sentiment has been hurt by headline concerns over tariffs. Investors must watch Q3earnings calls into margin sustainability as well as backlog growth. Evidence of inventory discipline as well as pricing strength will underpin their bull thesis as macro uncertainty takes the shine off the broader equity euphoria.
Producers Rejoice in Relief from Higher Prices — But Inflation Outlook Refuses to Decrease
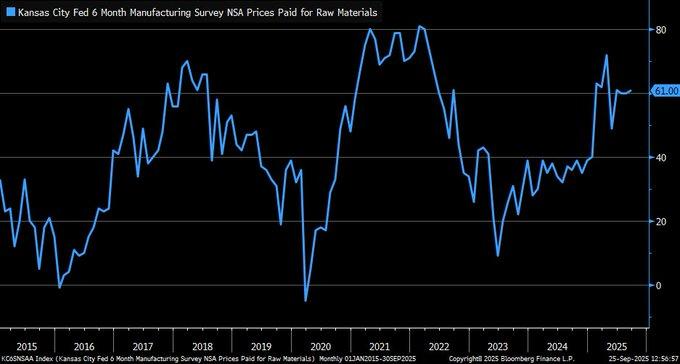
The latest Kansas City Fed 6th District Manufacturing Survey illustrates a notable pullback in raw material price pressures, with the index for prices paid declining from its 2022 high near 80 to 40 by mid-2025. While this drop confirms a softening in input cost inflation, it hasn’t translated into confidence — manufacturers surveyed continue to expect price increases over the next six months. This persistent expectation suggests that inflationary psychology remains embedded across the industrial space, even as actual cost trends improve.
Historical context adds nuance to the story. A 2023 study of global raw materials pricing trends by the World Bank found that price volatility — often tied to supply-demand mismatches — remains a structural feature of the post-2005 commodity cycle. The persistence of such imbalances, accelerated by geopolitical disruptions and uneven demand rebounds, may be informing the cautious outlook held by U.S. producers. Interestingly, this diverges from recent UK manufacturing data showing the slowest price inflation in nearly a year, underscoring how region-specific supply chain stress — such as the 2024 Red Sea crisis — may be unevenly absorbed. We believe some U.S. capital goods and middle-cap machinery stocks are undervalued, most notably those that have domestic supply chains as well as reshoring exposure. These stocks have underperformed the wider industrials due to the impact of inflation as well as logistical issues, yet are more optimally placed to benefit from margin upside should input costs continue to moderate. The analysts should pay attention to forward guidance around pricing power as well as backlogs during the next set of earnings calls — moves here can indicate a pricing bottom as well as support re-rating the group up.
Durable Goods Orders Reveal Spotty Growth — Infra Spend or Ebbing Demand?
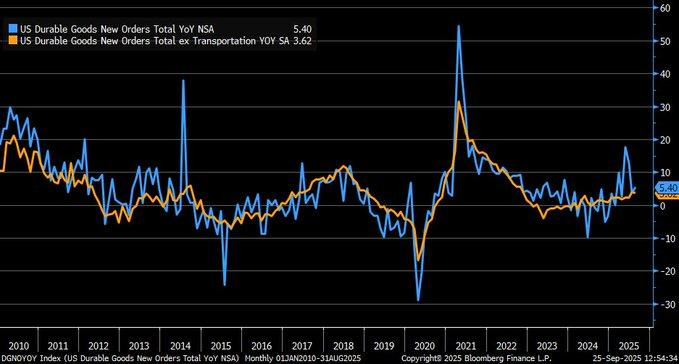
Aug. 2025 goods orders in the durable category posted satisfactory year-earlier advances, as the combined as well as core (ex-transport) posted gains, although much more subdued than previous trends. This deceleration, recently spotted within chart data, signals restraint in industrial demand. While orders remained positive, their advances are decelerating — a likely signal that firms are being more cautious during international supply-chain uncertainties, also registered by U.S. Census Bureau logistics indicators.
What is particularly illuminating is the comparison to the surprise 9.2% April order surge. That initial rise now looks less the onset of the long-predicted rebound than a short burst, maybe the product of government-planned infrastructure expenditure rather than private industry optimism. If long-cycle investment- and GDP-linked durable goods are weakening, then the issue becomes whether the current cycle growth is as strong on the quiet behind the headlines.
In positioning terms, aerospace suppliers and software companies serving industry are undervalued, notably those associated with long-term government spending or automation upgrades. These stocks may have been disproportionately punished based on order volatility fears but would be aided by recurring infrastructure tailwinds. Analysts should pay attention to new order pipelines as well as guidance on CapEx during the next round of company earnings calls — specifically to differentiate temporary spending bulge vs. sustainable, margin-building demand.
Q2 GDP Revised Up to 3.8% — AI Investment and Consumption Contributed the Most to the Rebound
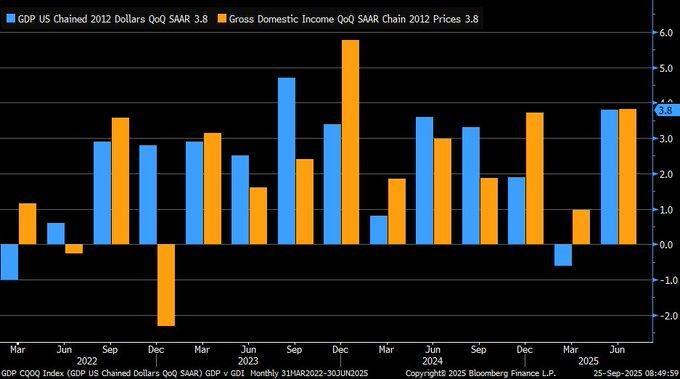
American economic growth climbed at a 3.8% annualized rate during Q2 2025, up a notch from the previous estimate of 3.3%, as a strong 2.5% acceleration in consumer spending and a significant pick-up in AI-related capital spending paced the improvement. Sturdy showing contrasts the broadly expected slowdown that was being associated with mid-year tariff hikes. Instead of dampening growth, the report suggests productivity gains as well as demand resilience more than compensated potential trade backlash. It strengthens the case that structural changes, and digital transformation, above all, are the primary engines behind real economic activity.
More compelling, nonetheless, is the coincidence of GDP growth as well as Gross Domestic Income (GDI) growth in the same period. Separately, the two are prone to diverging, prompting debate as to the more accurate indication of economic fundamentals. When they converge, as most current chart data demonstrates, they indicate strongly improving fundamentals and reduce the likelihood that the strength during Q2 is merely a statistical aberration. Since Q1 recorded modest contraction of -0.6%, the current about-face supports that downturn as a temporary setback rather than a turning point.
At Zaye Capital Markets, we believe mid-cap AI infrastructure and cloud hardware providers remain undervalued, particularly those not yet fully priced into growth indices. Their outsized role in recent GDP contributions — through enterprise adoption, capex cycles, and automation — points to durable demand. Analysts should scrutinize forward sales and installation backlogs in upcoming earnings to confirm whether the momentum seen in Q2 can carry into Q4. Early signs of continued strength may justify upward revisions to FY25 earnings estimates.
Core PCE Reaches 2.6% — Rate Cut Script Imperiled by Sticky Inflation
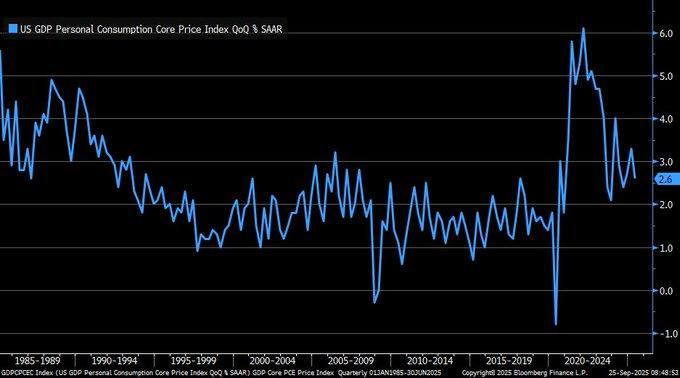
U.S. GDP Core PCE Price Index rose to 2.6% in Q2 2025 from the previous period’s 2.5%, confirming fears about persisting inflation. While the increase is fractional on a face value basis, the implication that it carries is materially important — that the disinflationary trend that was evident during the latter half of 2024 has stalled, and the structural forces behind core price pressures are more entrenched. Service industries, labour-intensive industries, and shelter costs remain main sources of this stickiness. Historically, Core PCE has had a less erratic path than CPI due to the weighting associated with consumption as well as the approach, so this gain is a credible indication that the inflation risks persist asymmetrically to the high side.
This is consistent with broader evidence of U.S. nominal rigidity. Even as borrowing rates rise and liquidity firms, wage growth still stays ahead of productivity across most sectors, most significantly logistics, health care, and construction. This suggests that there still are supply-side frictions, like skills mismatches and price gaps on inputs, that hold back how fast the inflation re-achieves the Fed’s 2% target. It suggests here that the Fed strategy for rate cuts would be pushed back once again if future data again shows core pricing stickiness. Today’s market pricing of a December rate cut now becomes subject to repricing if the September-October prints confirm this persistence. We believe diversified industrials and dividend growth consumer staples are cheap based on their inflation-hedging capability. As the market sentiment broadly prefers rate-sensitive tech, the current inflation scenario prefers equities that enjoy real pricing power and strong free cash flow conversion. Mid-cap stocks that are capable of passing on the cost without any margin degradation could do relatively better during a long-lasting “higher-for-longer” phase. Revisions to FY2025 EPS as well as operating margins need to be followed very closely by the analysts — any positive guidance here could be a catalyst for a shift into inflation-proof equities as the normalization of the policy extends further through 2026.
U.S. Exports Drop 1.3% in August — Trade Anxiety Spills Into Real Economy
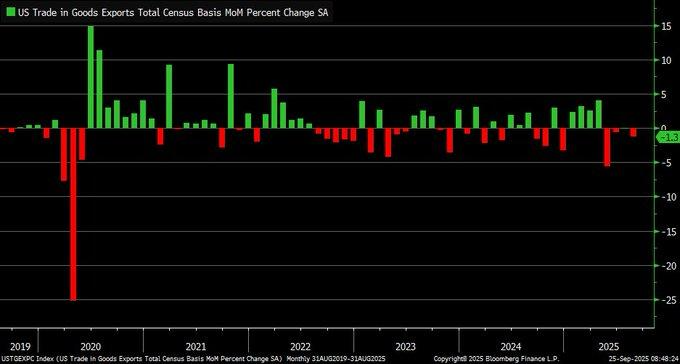
U.S. exports softened by 1.3% month-on-month during August 2025, after a flat July, based on the most current chart data following Census Bureau metrics. The softening represents a significant shift in trade momentum and supports the historical pattern that observed softness in export activity ahead of wider economic slowing. It has been a common empirical result that export volatility — most notably when extended — has the propensity to signal inflection points ahead in GDP trends. It suggests external demand for goods produced in the U.S. is softening, with agriculture, energy, and heavy machinery being hardest hit by geopolitical and policy changes.
Adding to the concern is the precipitous 29.3% plummet in U.S. imports recorded simultaneously. While part of this likely represents domestic demand softness or inventory unwinds, the magnitude of contraction suggests something more structural, most likely related to the mid-2025 expansion of tariffs. These trade measures have pushed up U.S. production costs, upended global supplier chains, and hurt global competitiveness. The consequence is softening both outbound and inbound trade flows — the ultimate hallmark of slowdown caused by trade. Continued persistence into Q4 could stress corporate margins, especially among those export-oriented industry companies as well as those that produce commodities. At Zaye Capital Markets, we view railroads and agricultural equipment manufacturers as undervalued but currently exposed to downside risk from the trade disruption narrative. These names have historically rebounded during global demand recoveries, but their near-term prospects are clouded by declining export orders and rising input costs. Analysts should monitor export order books, port traffic volumes, and farm credit stress levels. Should policymakers signal tariff moderation or stimulus for rural industries, these sectors could see a sharp reversal — but until then, risk-adjusted positioning is warranted.
Existing Home Sales Display Spotty Rebound — Structural Imbalances Redefine Paradigms Within the Housing Market
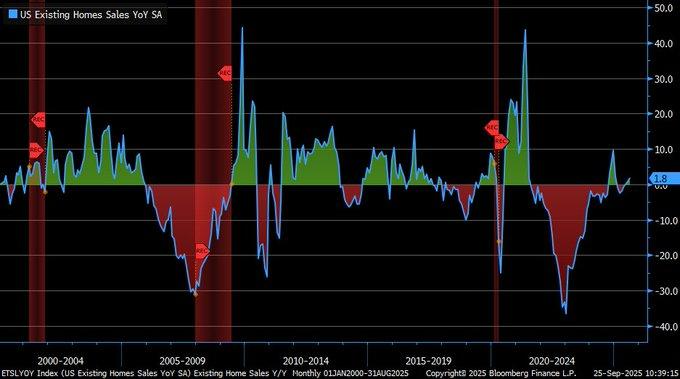
Home sales registered an annualized gain of 1.8% during August 2025, representing a modest rebound from pandemic lows, yet decreased month-on-month by 0.2%, reflecting the brittleness of housing demand during a high-rate period. Even as the broader economic metrics stabilized, the housing market is still supply-side restricted, as the high mortgage rates keep buyers back, as well as encourage the reluctance among existing homeowners to sell. Inventory is still historically constricted, as the great majority of homeowners are still locked into sub-6% mortgage rates, representing a supply freeze that reduces mobility as well as compresses transaction levels. All these restrictions are now beginning to exhibit the potential to be long-term structural market features.
In a reversal of historical norms, newly constructed homes are now, on average, cheaper than existing ones — with August data placing the median price of new homes at $447,200, compared to $484,000 for existing properties. This shift reflects a severe undersupply of new housing starts, which have persistently trailed demand. Builders have responded by cutting prices and offering incentives to move inventory, while existing homeowners remain largely inactive due to rate-lock dynamics. This is altering valuation models, especially in suburban and sunbelt regions, and may force long-held assumptions about home price premiums and consumer preferences to be reevaluated. We believe home improvement retailers and residential REITs specializing in build-to-rent properties are undervalued compared to the changing macro structure. Such sectors gain from the preference among homeowners to remodel instead of sell, as well as penetration of rental-based models in liquidity-constrained ownership markets. Investors need to look for rental pricing authority, remodeling capex trends, as well as build-to-rent pipeline additions. As the historical buy-sell cycle housing remains frozen, capital will move into the types of models that provide flexibility, yield stability, as well as exposure to shelter demand that is demand-driven demographically.
AAII Bull-Bear Spread Shifts to Positive — sentiment Recovers Despite Global Pessimism
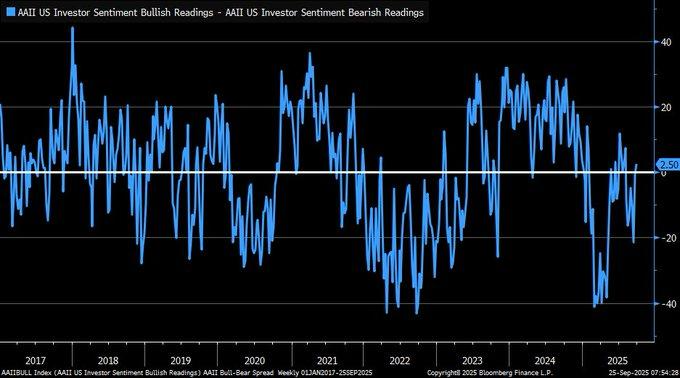
The AAII Bull-Bear Spread, which reflects the net difference between bullish and bearish investor sentiment, shifted into positive territory as of September 26, 2025, marking a clear rebound in retail optimism. Historically, the long-run averages for this survey hover around 38.0% bullish and 30.5% bearish, making the recent uptick significant in the context of cyclical sentiment shifts. While sentiment is inherently reactive, this move could indicate that investors are pricing in a soft landing scenario — possibly fueled by expectations of policy easing, resilient earnings, and macro stabilization following Q2 GDP strength.
But the optimism might be due for some additional attention. As a highly-quoted piece in behavioral finance discovered as recently as 2023, extreme bull sentiment frequently comes before short-term market declines, most notably when detached from revisions to the earnings or stability within the credit markets. That would make the current change potentially contrarian in nature. Investors do appear to be discounting multiple layers of risk — sticky inflation signals, delays to normalization, as well as delicate geopolitical equilibrium — that are yet to be properly reflected in pricing. Bull-bear spread alone cannot prescribe direction, but historically, the peaks in bullness have been associated with lower forward returns short-term. We believe defensive growth areas like consumer staples and healthcare tech still cheap on a risk-adjusted basis vs. return potential. Even after the cyclical recent advance, they offer more stability amidst sentiment-related volatility. Fund flows, short interest developments, and institutional flows into Q4 must be monitored very closely by the analysts — if sentiment continues to build without support emanating from the breadth of the earnings or credit spreads, the rotation back into the defensives gains momentum. At this stage, the bull-bear spread is a fairly decent sentiment indicator, yet fundamentals, as well as macro asymmetries, must not be overtaken.
Upcoming Economic Events
Spanish CPI y/y, U.S. Pending Home Sales m/m
With markets entering the last week of Q3, market attention shifts to the two vital releases on the economic calendar today: Spain’s Flash CPI (y-o-y) and U.S. Pending Home Sales (m-o-m). These readings, apart from being seminal within their spheres, are also definitive sentiment catalysts for global equities, debt markets, as well as policy outlooks. As central banks tread a knife’s edge between disinflation and growth weakness, the market response to any positive or negative surprise here could be magnified. Following is the analysis of the scenarios as well as their wider market effects:
Spanish Flash CPI y/y
This initial inflation print will be viewed very closely by currency as well as fixed income markets. Spain, as one of the largest economies within the eurozone, tends to issue early warning signals regarding the trajectory of the bloc’s inflation.
- If the CPI prints higher than expected, it would strengthen the argument for a more aggressive ECB stand ahead of coming meetings. Markets would see this as a reversal of recent dovish repricing, pushing up eurozone bond yields as well as the euro. Rate-sensitive sectors, most notably utilities, real estate, as well as highly levered growth equities, will be vulnerable to the downside.
- If CPI comes in lower than expected, the move would embolden the bulls on the bond side as well as ease pressure upon the ECB’s need to keep a strong tightening bias. That would be supportive of a relief bounce back up into the eurozone equities, most notably small caps as well as consumer-sensitive names, as well as pave the way to more dovish rhetoric come October.
U.S. Pending Home Sales m/m
The U.S. housing market remains operating under cyclical and structural stress, so this data is timely for both measuring consumer resilience and judging policy responsiveness.
- An advance in pending home sales above expectations would be positive, as it would indicate buyers are easing into the “higher-for-longer” mortgage rate phase. While this would be supportive of housing-related equities—the homebuilders, the mortgage servicers, the building materials stocks—it would also cause the Federal Reserve some fresh concern. A firm housing print would be suggestive of sticky demand-side inflation, making markets wonder about the timing of the next rate cuts.
- An advance, therefore, would be supported, while a below-expected reading would amplify the story around strain in affordability, potentially making policymakers think about other credit support or house-specific stimulus instruments. This would be broadly supportive, economically, of the defensives and the income-related sectors as the cycle stocks and the rate-sensitive sectors get rotated out.
At Zaye Capital Markets, we view these prints as more than standalone datapoints—they are sentiment catalysts with direct implications for how investors price risk across asset classes. For Spanish CPI, analysts should monitor eurozone rate futures and credit spreads as inflation expectations adjust. For U.S. housing, we advise a close eye on equity market breadth within real estate, consumer discretionary, and financials. Whether these numbers confirm resilience or hint at fragility, their interpretation will shape the market narrative heading into October’s central bank decisions.
Stock Market Performance
Indexes Rebound From April Bottoms, But Breadth and Drawdowns Reveal Hidden Stresses
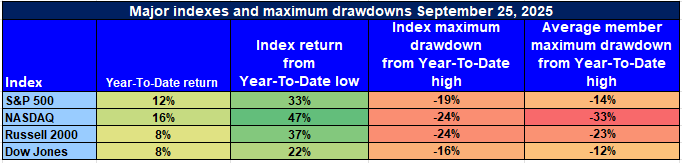
U.S. stock markets have pulled back forcefully off the April 8th, 2025 lows, as big benchmarks recorded strong gains. However, beneath the surface, extensive drawdowns and sub-par average member performance persist in demonstrating vulnerabilities across the board. Leadership is still skewed to the index giants, and there is hefty dispersion across individual stock returns. As the clock ticks closer to Q4, investors must contend with a market that obscures internal weakness behind headlines.
Here’s the analysis of the previous performance among the four key U.S. stock market indexes from Zaye Capital Markets:
S&P 500 Fact Sheet: Steady Rebound
YTD: +12% | +33% below April low | -19% below YTD high | Avg. member: -25%
The S&P 500 has produced a strong 12% year-to-date rise, supported by a 33% recovery off the April lows. A 19% pullback off the high for the 2025 high, combined with an average constituent loss of 25%, assures that breadth is still soft and most stocks are still regaining lost territory. Performance still depends on mega-cap strength more than universal investor sentiment.
NASDAQ: Gains Masking Deep Damage Within Driven By Growth
YTD: +16% | +47% below April low | -24% lower than YTD high | Avg. member: -48%
The NASDAQ still beats headlines hands-down with a 16% year-to-date gain and stunning 47% rally off the bottom in April. Beneath the headlines, the tech-heavy index suffers badly from a severe internal correction — still, the average member trails the peak high by 48%. This spread between the performance of the index itself and the return on the average stock spotlights high fragility among growth and innovation-related sectors.
Russell 2000: Small-Caps Rebound, But Still Under Pressure
YTD: +8% | -37% below April low | -24% below YTD high | Avg. member: -38% The Russell 2000 is up 8% this year to date and back up 37% from the April lows. However, the indices still trail their YTD high mark by 24%, as median component declines of 38% reflect the difficulty small-cap issues encounter in restoring investors’ confidence. Thinly liquid and highly susceptible to the domestic economic data, small caps are still exposed to macro volatility.
Dow Jones: Narrowed Gains with Caution
YTD: +8% | +22% below April low | -16% below YTD high | Avg. member: -23% Traditionally considered a defensive gauge, the Dow Jones climbed 8% through the year 2025 and recovered 22% from the April low. Its 16% pullback off the high is less severe compared to other indices, and average constituent declines are shallower too, at 23%. This is some indication of demand for the big-cap value and dividend stability that this gauge offers during times of macroeconomic insecurity.
We are also tentative, even as there is surface support in the index returns. We still believe high-quality companies that exhibit sustainable earnings, strong cash generation, and pricing capability remain the preferences. We are looking for significant breadth improvement, especially small- and mid-cap participation, before concluding the market is beyond a tactical bull phase.
The Strongest Sector in All These Indices
Communication Services Sector Leads the S&P 500 — Outperformance Aided by Growth, Momentum, and Margins
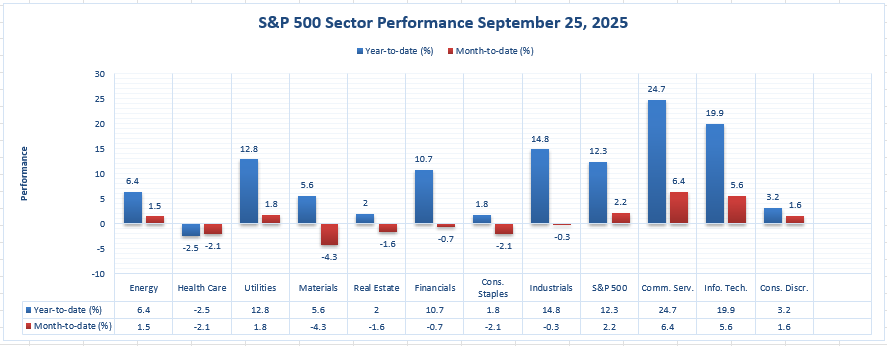
Through September 25, 2025, the strongest-performing sector within the S&P 500 has been the Communication Services sector, yielding a year-to-date gain of 24.7%, as well as a month-to-date rise of 6.4%. This double-digit outperformance highlights the sector’s compelling combination of earnings strength, rebounding digital ad spending, and increasing engagement on both streaming and network platforms. It also points to a wider sector rotation back into growth names sporting scalable business models, as well as strong balance sheets.
Consistency across both short- and long-term horizons distinguishes Communication Services among other sectors. Although Information Technology has registered a decent +19.9% YTD as well as +5.6% MTD, and Industrials rose +14.8% YTD, both failed to keep up with the sheer breadth as well as speed of the rally in Communication Services. From a month-on-month angle, no other sector even came close — the next-best, Info Tech, lagged behind by nearly 80 basis points. It indicate strong inflows into the sector, as investors are reallocating their bets to names that offer high operating leverage as well as stable cash generation amid slowing macro.
At Zaye Capital Markets, we still view select names in the Communication Services sector as undervalued on a forward basis, particularly those that boast leading digital infrastructure, AI-based monetization strategies, or targeted ad market exposure. We would recommend that analysts watch Q3 revisions in the sector, specifically those regarding margins as well as ad spend, as they will help determine whether the sector can continue to outperform during the current period that extends into Q4. Until then, the sector remains both an absolute as well as risk-adjusted sector leader — as well as a vital component of the S&P 500’s 2025 comeback story.
Earnings
Earnings Review – 26-Sept-2025
- Apogee Enterprises (APOG)
Apogee Enterprises has previously reported quarterly results, including a Q1 2026 EPS beat of $0.56 vs $0.45 consensus and revenue near $346.6 million. While no fresh confirmation of a new earnings release was available on 26 September, analysts continue to monitor key drivers such as its architectural framing systems, glass segment demand, and freight/material cost inputs. Backlog strength and margin expansion will remain top focus points, particularly if construction and non-residential demand remain uneven.
- Golden Matrix Group (GMGI)
Golden Matrix Group was expected to report on 26 September, though no confirmed press release was located. With limited consensus coverage, attention stays on gaming platform licensing growth, expansion into Asia-Pacific markets, and overall cash flow generation. International volatility has been a key theme, and any clarity on margin stabilization and product launches will likely shape the near-term stock narrative.
- Taylor Devices (TAYD)
Taylor Devices has thin institutional coverage, and no confirmed earnings report was filed on the 26th. Still, the company’s exposure to aerospace, defense, and industrial damping systems puts the spotlight on defense-related backlog health and gross margin stability. Analysts should watch for signals of how the firm is managing cost inflation and procurement delays, especially if government-related orders remain lumpy.
- Anebulo Pharmaceuticals (ANEB)
Anebulo Pharmaceuticals was also due to report on 26 September, with no earnings confirmation surfaced at the time. Given the development-stage nature of the firm, investor focus is less on revenue and more on updates to its ANEK-001 clinical program, trial milestones, R&D burn rate, and available cash runway. Any advancement in CNS-related treatments or trial acceleration would represent potential upside triggers.
Earnings Preview – 29-Sept-2025
- Carnival Corporation (CCL)
Carnival is expected to report Q3 2025 earnings with consensus EPS estimates around $1.31–$1.32 and revenue of approximately $8.09 billion. Investors are watching closely for updates on advance bookings, net yields, and onboard spend growth. Fuel costs and ship operating expenses will also be critical. Strong results may reinforce the travel rebound narrative, but cautious guidance tied to macro weakness or inflation could trigger downside pressure.
- Jefferies Financial Group (JEF)
Jefferies is set to report today, and attention will be on trading revenues, M&A advisory fees, and net interest income. Market volatility and rate conditions will shape investor expectations. Analysts are also watching for commentary around the capital markets pipeline and underwriting volumes, which serve as forward indicators for broader financial sector health into Q4.
- Vail Resorts (MTN)
Vail will report earnings with focus areas including Epic Pass sales, resort occupancy rates, and early winter booking trends. Seasonal hiring costs and snow conditions can impact margins, but strategic expansion into destination resorts and off-season experiences may offset risk. Guidance for FY26 visitation and pricing will be critical, especially amid concerns about high-end consumer fatigue.
- Progress Software Corporation (PRGS)
Progress Software is expected to report earnings today, with investor focus on annual recurring revenue (ARR) trends, software renewal rates, and cloud product penetration. Operating margins and forward guidance on licensing growth will be particularly scrutinized, especially as the firm pivots from legacy to more subscription-based revenue. SaaS adoption trends remain a key catalyst for upside re-rating.
Investors should not just parse the numbers, but lean into management commentary on forward demand, cost assumptions, and capital allocation plans—these will influence Q4 sentiment and relative rotation.
Stock Today – Monday, September 29, 2025
U.S. stock markets kicked the week off off-balance footing, as sentiment is split between optimistic hopes and rising headwinds. Pressure is once again gathering on the S&P 500 and the Nasdaq, primarily based on the relentless sell-off among the largest-cap tech stocks, as the Dow Jones and the Russell 2000 consolidate, aided by resumed sector rotation back into the value and cycle plays. Rising concerns about a U.S. government shutdown, together with dovish sentiment around corporate fundamentals, is taking its toll on risk appetite, as investors must reset expectations ahead of the final phase of Q3.
Stock Prices
Economic Indicators as Well as Geopolitics
Today’s cautious tone stems from the rising risk of a U.S. federal government shutdown, which could delay critical economic data releases and create disruptions in fiscal operations. At the same time, concerns around ongoing trade tensions and re-escalation of tariffs with China are beginning to weigh on equity multiples. This comes just as recent economic data have shown softening in consumer sentiment and housing metrics, putting the Federal Reserve in a tight spot. Despite a downward trend in inflation expectations, growth concerns are re-entering the narrative, prompting a defensive repositioning across sectors. The looming policy vacuum, combined with lackluster global growth signals, continues to challenge the bullish case for risk assets.
Latest Stock News
- $TSLA | Tesla fell again during early trade as investors grow increasingly uneasy about softening demand in core overseas markets as well as price compression on EVs. The stock has now recovered most of the 2025 gains, adding pressure to the wider tech complex.
- $AMZN | Amazon returns to the forefront amid fresh antitrust headwinds following word that the federal probes into its Prime business conduct are widening. Despite a strong AWS growth trajectory, sentiment remains suppressed as building regulatory pressure takes hold.
- $META | Meta Platforms underperforms as investors assess the track record on the monetization of their investments in the metaverse. While ad rev growth is being upheld, the high-cost projects are running up against increasing skepticism as the rates situation stands.
The Magnificent Seven and the S&P 500
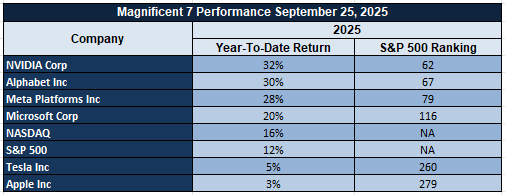
The “Magnificent Seven”—Apple, Microsoft, Nvidia, Amazon, Meta, Alphabet, and Tesla—are keeping the market lower still, with new losses gaining steam heading into Monday. Tesla and Meta are the leaders on the downside, both off more than 4% on the week. Typical drawdowns throughout the group are above 18% off recent highs, eroding the stability the S&P 500 enjoys as a consequence of their combined market cap weighting. This weakness driven by the tech sector is a reflection both of the necessary recalibration of valuations as much as waning optimism around AI mania and increasing regulator pressure. As this core group cannot find their footing, other sectors such as energy, industry, and financials are already taking inflows as alternatives—but to no scaling necessary to make up lost ground on mega-cap weakness. Resilient upside within the broader market now seems doubtful without help from these leaders.
Major Index Performance up to Monday, the 29th September, 2025
- S&P 500: Trading at 6,641.88, down 0.4% on the day.
- Nasdaq Composite: At present stands at 22,399.72, lower by 0.6%, as big-cap.
- Dow Jones Industrial Average: Up 0.3% to 46,170.56, supported by gains among financials, energy.
- Russell 2000: Higher by 0.2% to 2,437.89, where small caps.
At Zaye Capital Markets, we believe that the outlook remains very event-driven. Until breadth strengthens and mega-cap volatility fades, a defensive tilt in strategy, where sectors that enjoy pricing power, stable dividend income, and lower duration risk are preferred, is still the smart strategy. Investors need to keep a close eye on fiscal negotiations, macro releases, and guidance quality as the earnings season develops.
Gold Prices
As of Monday, September 29, 2025, spot gold is quoted at $3,777.62 per troy ounce, up 0.24% during the day, flirting just below its recent intraday high of $3,798.32—all this while hovering close to new all-time highs. This strength comes even as the U.S. political rhetoric infers a story of macro strength. Recent statements from Trump, including “the economic numbers are great” and “economy is doing well, prices are down,” merely added fuel to the idea that the economy is stabilizing. Still, there’s a more complex background to this story, as the administration boasts some $200 billion-plus of the cost of tariffs collected and optimism about some Gaza deal, even as fears mount elsewhere around the globe. Aligning himself with Israel around Iran’s nuclear aspirations, Zelensky’s backroom demand for a shipment of the company’s flagship Tomahawk missiles, and the blanket statement regarding China, Vietnam, and Indonesia’s ascendance of the most important, key supply chains, all fuel the underlying geopolitical risk. These factors keep the gold market supported, as investors don’t merely hedge off the threat of inflation, but rather global instability and sudden changes in the policy regime. At the same time, economic indicators present mixed signals for the metal. Yesterday’s dual prints, featuring static core PCE and deteriorating exports, underscored enduring inflation and weakening growth. Today’s release of the pending Spanish Flash CPI y/y and U.S. Pending Home Sales m/m will further tighten expectations about central bank tightening. A surprise to the upside in CPI data from Spain would likely rekindle expectations about tightening in the eurozone, pushing up the metal on relative currency moves. Conversely, a soft U.S. home sales number would indicate domestic demand weakness, validating defensive moves. Federal Reserve rhetoric, including Barkin’s warning that the trends on the jobs front “are starting to move in the wrong direction,” bolsters the sentiment that, even as inflation is tempering, the labor market is getting more fragile. In this environment, the metal excels: as a hedge both against stagflation as well as market dislocation. Until the timing about rate cuts is resolved or geopolitical tensions subside, we Zaye Capital Markets expect the metal to be supported and highly responsive to both macroeconomic data as well as political noise.
Oil Prices
As of Monday, September 29, 2025, oil prices are tracking downward slightly, with WTI crude sitting at $65.07 per barrel and Brent crude around $69.50, indicating a modest daily pullback of almost 1%. The downward shift is primarily attributed to the return of Kurdish oil exports—an estimate ranging from 180,000 to 190,000 barrels daily—adding supply back into an already delicate demand scenario. As additional pressure, OPEC+ is set to deliver an output increase of around 137,000 barrels daily, internal sources indicate. This move, supposedly aiming to even member quotas, is being viewed in markets as a possible oversupply threat, given the onset of global refinery refit season. On the geopolitics side, earlier support to oil—the initiation being provided by the Ukrainian drone attacks on Russian refining installations as also Middle East tensions broadly, earlier this week—has faded as headlines swing back to supply-side concerns as well as macroeconomic moderation. While no fresh report was issued today, the IEA recently warned about softening demand growth off the Asian continent as also underlining excess inventory stocks in China as well as India, soaking up discounted barrels off sanctioned sources. On the sidelines, wider market sentiment has dampened following the indication of plateauing U.S. industry activity as also the still-strong dollar, both serving to temper bullish oil inflows. Trump’s most recent commentaries reenforce the policy-mandated complexity now governing energy markets. Exclamations like “THE ECONOMIC NUMBERS ARE GREAT” and “PRICES ARE DOWN” try to paint the scene of economic prowess sans-inflation—the normally positive scenario for oil—but markets are taking it skeptically. While such posturing may portend future demand strength, data releases offer a contradictory account: durable goods orders decelerated, pending home sales are still tenuous, and exports contracted. This would indicate that consumptive demand among end-users as well as construction-related energy demand is slowing. Prior to today’s Spanish Flash CPI as well as the U.S. Pending Home Sales data, any positive surprise among European inflation would send global central banks back on the defensive, trimming oil demand forecasts. On the other hand, soft U.S. housing data would affirm slowing domestic consumption, this, in turn, would dampen the short-term energy scenario. At Zaye Capital Markets, we perceive oil still compressed between supply-side volatility as well as variable demand signals. Until clarity about the macros improves or some significant geopolitical tension is back on the radar, the energy markets would likely stay range-bound, where reactive positioning prevails over directional conviction.
Bitcoin Prices
Bitcoin is now trading around $110,000, having dropped more than 2% on the last 24 hours and continuing a multi-session downturn that has now undone nearly 28% off the back of its 2025 highs around $120,000. Following a liquidation wave and wider risk-off sentiment around the globe, the market value lost so far has exceeded $162 billion over the past few days. Higher U.S. dollar rates and vagueness around Federal Reserve moves have taken some sparkle off short-term sentiment, while institutional buying persists quietly behind the scenes. Market’s “fear index” stands at 28, indicating utmost fear, and analysts themselves have cited a key support range around $107,000 to $102,000. While consolidation around current ranges implies technical strength, the environment nonetheless remains susceptible to macro shocks as well as policy dislocations. Strategists now opine that where there is no significant catalyst, Bitcoin will face the threat of a further 15-20% pullback, if global liquidity gets even tighter or safe-haven flows sidetrack crypto markets specifically to the benefit of either the precious metals sector or the governments’ debt sector. Trump’s sweeping remarks—”the economic numbers are great,” “prices are down,” and “we’re very close to a deal on gaza”—are injecting mixed signals into the Bitcoin narrative. On one hand, his portrayal of a strong U.S. economy would generally reduce demand for decentralized hedges like Bitcoin, as investors shift capital toward traditional risk assets. However, Trump’s references to escalating tensions with Iran, massive tariff revenues under judicial review, and a potentially controversial TikTok deal reveal deep geopolitical and regulatory undercurrents. These factors reinforce Bitcoin’s alternative-asset appeal, especially among those seeking insulation from fiat policy distortions and sovereign uncertainty. Yesterday’s economic data added fuel to the indecision: core PCE stayed firm, durable goods weakened, and export demand contracted—all hinting at a growth slowdown with persistent inflation risks. As today’s Spanish Flash CPI and U.S. Pending Home Sales roll in, a hotter-than-expected CPI may reignite inflation concerns and push some capital back into Bitcoin, while a soft U.S. housing read would underscore recession fears, creating dual pressures that could keep Bitcoin locked in a volatile holding pattern until macro clarity returns.
Eth Prices
Ethereum (ETH) stands at $4,134.10, having shed approximately 0.33% over the previous 24 hours, as the market experiences a blend of diverging technical and fundamentals-related signals. While ETH has, so far, held above the psychologically important $4,000 price point, short-term sentiment remains fragile. Ongoing exchange-traded fund (ETF) redemptions are a prime cause behind the current stress on Ethereum. ETH-related ETFs registered notable redemptions during the previous week as macro-level insecurity and the overall frailty registered in the crypto markets cause safe-haven buying among both retail and institutional buyers. Despite this bearish ETF flows, successive accumulation among high-ticket buyers is offsetting the effect. On-chain observations verify that between September 25-27, there was purchase of more than 431,000 ETH, i.e., approximately $1.73 billion, among 16 Ethereum whale wallets as ETH exchange balances dropped to nine-year lows. This disconnect between ETF behavior and direct wallet accumulation is a classic dislocation between short-term, tactical redemptions vis-à-vis longer-term buildup among high-conviction buyers. Bigger-picture implications of this activity are that whales see the current correction as a long-term purchase opportunity, whilst retail and ETF flows continue to be motivated on the back of volatility fears and short-term macro storylines. Complicating the analysis, blockchain data also indicated that about 1,500 ETH (valued around $6 million) was recently transferred by a wallet corresponding to Ethereum’s founder to Kraken, sparking speculation around founder-related profit taking. Whilst this is insignificant compared to the accumulation being carried out by the whales, this type of activity tends to frighten less-s sophisticated investors. That exchange reserves are still being depleted whilst big wallets build suggests that there may be a supply squeeze story emerge if the broader market stabilises. Ethereum, at present, would then appear to be accumulating under the covers even as price movement itself is choppy. It would be positioned to reverse strongly back up if ETF flows quieten down and macro measures like inflation or liquidity indicators break strongly positive. At Zaye Capital Markets, we still see the medium term outlook on ETH as constructive, although we still foresee high volatility as the back-and-forth battle between the whales and the ETF flows unfolds.
