Where Are Markets Today?
US and European stock futures are opening on Friday on a mixed but steady basis, as major indexes trade near the flatline after the record-breaking session on Thursday. In the States, S&P 500 and Nasdaq 100 futures are marginally higher, as the Dow futures trade virtually flat—up only 1 point in the premarket. It follows the previous session when the S&P 500 added 0.06%, the Dow added 78 points, and the Nasdaq surged 0.4%, led by Nvidia’s solid 0.9% rally. In Europe, the region’s majors echo this tentative positivity. On Thursday the Stoxx 600 reached an all-time record high, as the region’s futures trade modestly higher today on the back of the ongoing strength of the technology sector as well as the semi groups led by the likes of ASMI and especially ASML. Stability in both regions reflects an equipoise between enthusiasm for those high growth areas—especially the AI sector—and the lingering-political as well as macroeconomic doubts.
One of the key drivers behind the muted tone is the resiliency of the AI trade, which remained an overriding theme despite ongoing fears like the shutdown of the U.S. government. Investor appetite still lies on the foundation of the secular trends around data infrastructure, chip development, as well as the broader digital economy. Nvidia’s new all-time high and solid momentum in the chipmakers Intel and AMD solidified that narrative, keeping sentiment solid on all the major technology-heavy indices. Strength in both AI as well as semiconductors also spilled over into European bourses, as the region’s technology shares helped the indices close at record highs on Thursday. Effectively, investors are betting thestructural growth being fueled by AI will stand above the temporary political distractions. Meanwhile, the current U.S. government shutdown, now on its third day, continues to raise concern but not panic. Markets seem to view it as a transient and controllable risk, especially as previous shutdowns have not greatly harmed equities. What’s different this time, however, is it’s occurred just as the labor data has turned sluggish, inflation has proven stickier, and the macroeconomic environment has weakened. Investors await closely how long the shutdown could last as well as how much economic drag it could bring. For the moment, futures stay positive on the notion that the central banks—particularly the Fed—would turn more dovish in tones if macro conditions continue their downtrend further, especially as the threat of downside surprises in today’s releases for the job growth or services activity takes hold.
In Zaye Capital Markets’ view, today’s market attitude is one of cautious enthusiasm. So long as AI continues to lead market momentum, breadth stays lean, and political risk continues to gather just below the surface, however, the market may not maintain recent highs. To hold recent highs in the United States as well as Europe, investors will require not only ongoing leadership in technology but also stabilization in macro data as well as positive developments on the fiscal side. For now, the market looks set to churn but remain upwardly biased—supported by enthusiasm for innovation but buffered by noise on the policy side.
Key Index Performance through Friday, October 3, 2025
- Nasdaq: Trading around 22,900 (up ~0.4% intraday)
- S&P 500: Around 6,740, modestly higher (+0.2%)
- Russell 2000: About 2,470, displaying faint strength in small cap
- Dow Jones: 46,520, holding on to gains on the back of industrials and defensives names.
The Magnificent Seven and the S&P 500
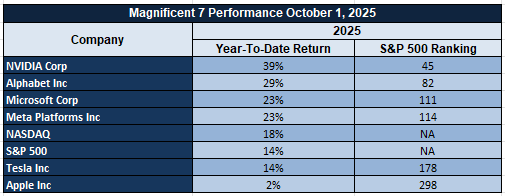
The “Magnificent Seven”—Apple, Microsoft, Nvidia, Amazon, Meta, Alphabet, and Tesla—are sending mixed signals this week. While Nvidia and Microsoft have shown pockets of resilience, Tesla and Meta have continued to weigh heavily on the Nasdaq and S&P 500 due to valuation pullbacks and growth fatigue. The group collectively remains down over 18% from their summer peaks, reflecting ongoing investor rotation away from crowded mega-cap trades. This divergence highlights the fragility in index-level performance and suggests that without broad-based support from these leaders, a sustainable rally in the S&P 500 remains uncertain.
Drivers Behind the Market Movement – Friday, October 3, 2025
US and European markets exhibit caution mixed with strength today as investors process the alignment of political events, flagging economic indicators, and robust tech-led momentum. Though larger indices trade around record levels, underlying weakness persists, especially as macroeconomic as well as policy-linked headwinds continue. Here’s the major factors impacting today’s market movement:
1. Government Shutdown and Trump’s Fiscal Agenda
The U.S. government shutdown has now entered its third day, raising fresh questions about its impact on federal operations, economic data releases, and broader fiscal stability. What’s added weight to market concerns is a series of high-impact statements from President Trump, who confirmed meetings to evaluate sweeping cuts to Democrat-led agencies and hinted at potentially thousands of layoffs across departments. These developments come amid uncertainty around whether the cuts will be temporary or permanent. Investors are weighing the potential deflationary effects of reduced federal spending against the destabilizing risk of stalled government functions. While shutdowns historically haven’t derailed markets, the duration and political context of this one could influence sentiment more significantly.
2. Lags in Economic Data and Redetermination of Growth
The shutdown is already holding up some big deadlines for government data releases, for example updates on the labour market as well as performance reports on individual agencies. But investors remain attentive for private gauges—like last week’s decrease in ADP private payrolls as well as an abrupt fall in ISM export orders—that together indicate the economy could be losing speed. Today’s data releases, led by Non-Farm Employment Change, the Unemployment Rate as well as ISM Services PMI, will be crucial. A less-than-expected set of figures could cement the narrative of an economy losing speed as well as reinforce speculative bets on the Fed cutting rates, but an unexpectedly robust release might make market participants rethink stretched valuations for equities.
3. Geopolitical Tensions and Strategic Posturing
Geopolitical events continue to shape market mood, especially in the commodities and defense-sensitive segments. Trump’s latest actions toward increasing pressure on Iran for fresh nuclear talks, as well as the White House’s threat messages for Hamas on the prospects of a Gaza peace initiative, have reinstated volatility in the region’s diplomacy. Such announcements on top of worries about trade tensions with China—particularly as the ongoing U.S.-China trade truce edges closer to its November 10 deadline—are building the geopolitical risk premium. Energy sectors in particular continue to be responsive to supply disruptions fears, where any escalation may trigger short-term volatility in oil and linked assets.
In short, the tug-of-war between bull enthusiasm in growth industries such as AI and semiconductors and bear worries about fiscal consolidation, economic weakness, and international tensions is shaping the market’s behavior today. Here at Zaye Capital Markets, our view is for investors all about being nimble this time around, with particular attention given today’s econ prints as well as the continuing policy news. Risk assets’ tone might quickly turn sour or rosier based on whether data surprises or political compromise dominates the headlines.
Digesting Economic Data
The TRUMP Tweets and Their Implications
A fresh wave of high-impact policy signals followed President Trump’s series of remarks this week, offering evidence of the administration’s strategic prioritizing of fiscal realignment, domestic security, as well as international trade. President Trump’s report of meeting Vought for the purpose of considering agencies controlled by Democrats and making findings as to whether spending cutbacks should become permanent or temporary foreshadows movement toward spirited government downsizing. Coming on the heels of White House confirmations of possible layoffs in the thousands, this course injects fresh unknowns both for the public sector workforce as well as the broader macroeconomic picture. Each of the factors will tend to energize market concerns about surging joblessness as well as falling domestic consumption—both being leading perils for the equity market as well as the interest rate expectations.
On the geopolitical fronts, additional pressure on Iran to resume nuclear talks as well as Trump’s vow that he will establish a “red line” for Hamas in response to the Gaza Plan adds fresh volatility to the international diplomatic equation. Those measures—while accomplishing the task of restoring the leadership of the United States—also bring concrete dangers of stoking regional tensions in the Middle East region crucial for energy markets. Hope by the White House for Hamas’s quick positive response elevates the stakes for highly sensitive window for negotiations. For commodity markets generally, but for oil in particular, this language may reopen the geopolitical risk premium, particularly should large players like Iran react negatively or negotiations fail to defuse regional flashpoints. Domestically, Bessent’s commentary supports the administration’s turn toward fiscal restraint. Comments blaming Democrats for proposing “inflationary spending” and threatening an possible GDP blow due to the government shutdown highlight fears of an prolonged gridlock in Washington. Also, Bessent’s comment about scheduling advanced Federal Reserve job interviews and being poised to offer Trump three to five solid candidates indicate the administration’s desire for greater control over the formation of monetary policy. Such coordination between fiscal consolidation and possible alterations at the central bank could develop long-term implications for rates, liquidity, and positioning among investors within risk assets.
Meanwhile, the broader trade landscape appears in flux. Bessent’s critique of China’s use of soy in trade negotiations, and the note that the current U.S.–China trade truce expires on November 10, raises concerns over escalating friction with Beijing. These statements could signal a tougher trade posture ahead, which may weigh on global supply chains, especially in agriculture and industrial commodities. However, the mention of upcoming support for U.S. farmers, and reaffirmation of strategic ties with Argentina, point to targeted stimulus aimed at buffering sectors vulnerable to external shocks. At Zaye Capital Markets, we interpret these comments as a broad attempt to reset the economic agenda heading into the final stretch of the year—one that could reshape market dynamics across equities, commodities, and currencies depending on how the administration’s plans are executed and received.
September Job Cuts Down but YTD Total Still Higher Than Normal
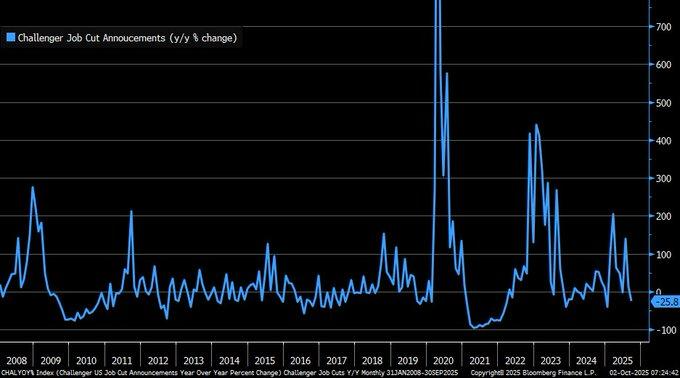
September’s Challenger job cuts report showed a dramatic 25.8% year-over-year drop to 54,064, a stark contrast to the previous month’s 13.3% increase. Despite this month’s softening, the year-to-date total of 947,000 job cuts represents the highest since the pandemic-driven peak in 2020. This suggests that although the job market was softening, job losses are higher than normal historically. The pattern reflects a change in market forces with layoffs still affecting industries and a cause for concern regarding future fiscal health. The chart showing monthly patterns since 2008 reflects the job market’s volatility with the September decline being part of larger fluctuations tied to adjustments in the labor market.
Layoffs driven by artificial intelligence, or AI, that totalled 7,000 in September alone were a distinct contributor to the job cut announcements. It brings the total layoffs for the year attributed to AI to 17,375. The increase indicates a trend turnaround in the tech space, with firms reshaping the composition of their workers, often driven by growing use of automation and artificial intelligence. These tech job losses might keep investors apprehensive about a wider range of recessionary effects as technological changes cause severe labour market realignments. Analysts need to keep a close eye on tech stock shares since firms that are significantly restructuring might experience fluctuations over the shorter term. From a stock market standpoint, these trends in job cuts could create bullish investor sentiment, especially in industries heavily dependent on labor. These job losses’ historically high year-to-date figure imply that the challenges in the labor market might not be over yet, something that could temper consumer spending as well as expectations for economic growth. Consumer discretionary and industrial stock prices might suffer if weakness in the labor market continues. Investors need to equally pay attention to trends toward growth in companies embracing AI as well as automation since they can capitalize on lower costs for labor. Analysts’ attention must predominantly be on the tech sector’s recovery path as well as implications on overall market confidence.
Mortgage Refinancing Slump Indicative of Strain
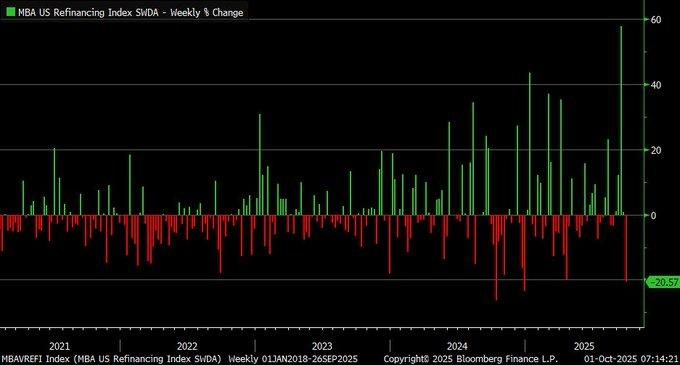
The MBA Refinancing index for the week that ended September 26, 2025, saw a drastic decline of 20.6%, its largest decline this year. The decline due to increasing volatility in the mortgage rates mirrors a larger trend in the housing market. The weekly percentage change chart since 2021 vividly shows this recent decline against the backdrop of previous periods of increase, particularly against the backdrop of the low-rate period in 2021. The prevailing 30-year mortgage rate of around 6.8% thus seems to be causing this decline, showing a highly sensitive housing market coupled with lower refinancing activity.
The 21% decline in refinancing business means that homeowners are growing more hesitant as increasing mortgage rates reduce refinancing’s appeal. The trend will help slow housing market activity since more people will refrain from buying or selling homes, contributing to less inventory as well as a decline in consumer spending related to housing. Increasingly tight housing market will cause more general caution in the economy, more so by households whose financial agility will more be affected by increasing mortgage rates.
From a wider macroeconomic standpoint, the recent slowdown in refinancing and possible cooling in the housing market may prove significant in terms of Federal Reserve policy. Since the housing market forms a significant part of consumer wealth, further softening here might cause the Fed to rethink its tightening policy. Since housing activity weakens, economists will need to watch for any hints by the Fed that might indicate a change in monetary policy, specially if the pressures on inflation soften further as a result of soft consumer spending. Investors will need to pay close attention to housing statistics since they might give a vital clue towards the Fed’s later interest rate decision.
Travel Price Trends: Shifting Costs and Post-Pandemic Affordability
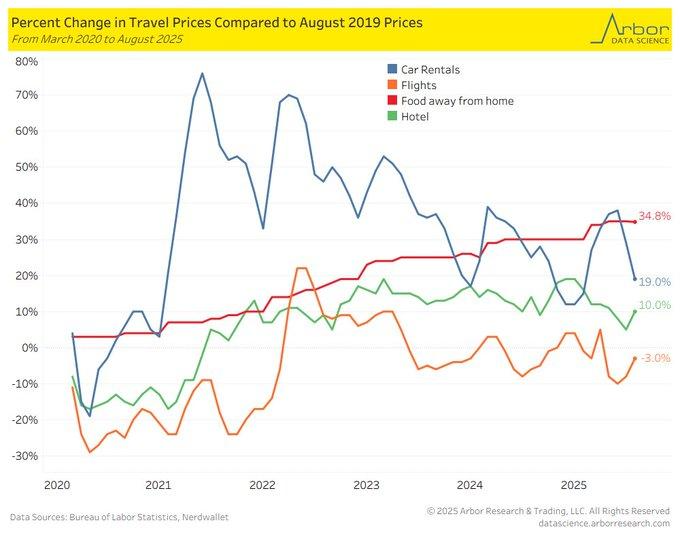
Through August 2025, travel costs have undergone significant changes, with varied trends evident across major components such as food away from home, hotels, car rentals, and airlines. Analyzing Arbor Research data with the help of BLS statistics, food away from home has increased by 34.8%, hotels by 10%, and car rentals by 19%. In contrast, flights recorded a historic decline of 3%, depicting divergent trends across the travel space. In total terms, nominal travel spending has risen by 12-14% over pre-pandemic rates as NerdWallet’s September 2025 report depicts. After the adjustment for cumulatively 26.3% CPI inflation, however, real travel spending has actually declined by 12.5%, offering a boost toward consumers’ affordability side.
A deconstruction of the BLS Consumer Price Index (CPI) series finds that the flight price deflation can be partially attributed to increased airline capacity and more competition in the market as a result of pandemic-caused interruptions. Airlines have sought to rebound from the operating difficulties after the year 2020 that resulted in more competitive pricing, a far cry from the increasing costs in the other travel industries. The rise in prices for hotels and car rentals as well as food prices away from home indicate ongoing shortages of labor as well as supply chain difficulties that continue to ripple in the service-oriented industries. In a broader post-pandemic trend outlook, fuel prices have been just as instrumental in dictating transport costs. While fuel prices themselves have been erratic, their impacts on transport costs have been moderated by improved efficiency as well as by improved air travel competition. In further development on these trends, specialists will need to monitor further travel expenses shifts as consumers grapple with growing costs in food and accommodation but benefit from lower air travel. Disruptions in supply chains, forces in the labour market, as well as competition across transport segments will be crucial things to monitor going forward.
Luxury vs. Non-Luxury Home Market: Diverging Trends Amid Economic Uncertainty
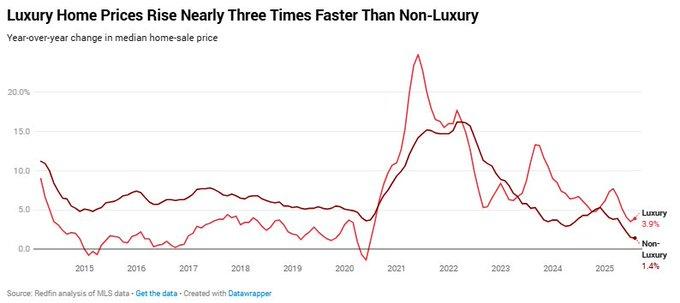
In August 2025, the U.S. real estate market again reflected a split between luxury and non-luxury segments with luxury residence prices increasing by 3.9% year-over-year to a median value of $1.25 million. Non-luxury homes, by contrast, achieved a much more moderate gain of only 1.4%, reaching a median value of $370,000. This increasing disparity in price appreciation, as reflected in the following chart tracking since 2015, reflects a stark contrast between the two segments with luxury buyers being unaffected by the currently prevailing range of high mortgage rates above 6.5%, frequently instead reserving cash offers. Even so, prices aside, sales of luxury as well as non-luxury homes declined slightly with sales falling by 0.7% as well as by 0.6%, respectively. Inventory rose considerably by 9.5% for luxury as well as by 13.4% for non-luxury homes.
The increasing gap between the prices of luxury and non-luxury homes highlights the increasing disparity in the real estate market. Luxury homes continue to be somewhat buffered against the effects of increasing mortgage rates by virtue of cash purchases by high-net-worth buyers, but non-luxury homes are coming under increasing pressure. Increasing inventory and longer days on the market now cause non-luxury homes to stay on the market for an average of 40 days compared to an average of 33 in the prior year. This pattern signifies a weakening demand and illuminates the pressure on middle-income purchasers in a context of increasing mortgage rates and growing home prices. The growing gap between the luxury and non-luxury segments is a prime indicator of the wider economic gap. With stock increasing and sales declining across both segments, the potentially long-term effects on the real estate market need consideration by analysts. Although the luxury segment holds its ground, the growing challenge by middle-class consumers to purchase non-luxury properties portends further increases in economic disparity that can cause further segmentation in the market.
Learning CARTS Methodology and Its Sales Impact on Retailing
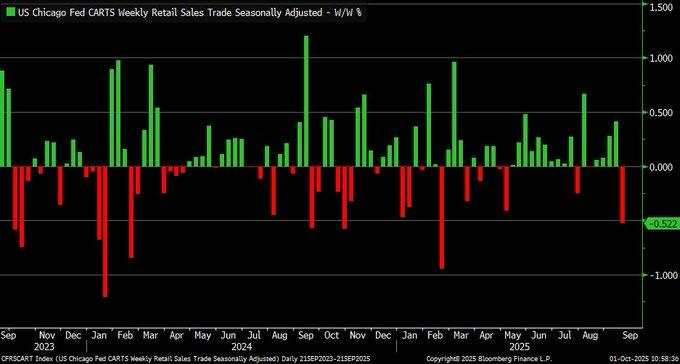
The Chicago Fed’s Advance Retail Trade Summary (CARTS) provides a real-time picture of sales at U.S. retail stores and food services as a nowcasting tool that gives a first glimpse back on consumer spending patterns. CARTS utilizes credit- and debit card transaction data to provide a preview of the official retail sales report that the U.S. Census Bureau usually reports a month later. In its advanced report released on October 1, 2025, the report indicated a decline in seasonally adjusted retail sales by a decrease of 0.52% week-over-week during the period ending on October 1. It was the largest decline since February 2025. The decline notwithstanding, it follows several positive sales increases over the preceding weeks that demonstrate consumer spending volatility on a persistent basis yet do not necessarily portend immediate cause for concern.
The CARTS approach yields useful statistics for economists and researchers by enabling the retailing environment’s performance to be measured in near real-time. Utilizing credit cards and debit cards’ data, CARTS more rapidly reflects consumer spending behavior than do traditional surveys, so more informed judgments can now be made about retail health by business and policymakers. The initial statistics published in October also incorporated revisions in former figures, some of which improve the quality of prospective sales forecasts. Nevertheless, although retail sales’ recent decline cries out for attention, it reflects the larger mixed messages in post-pandemic retail research as fluctuations here will inevitably materialize as the marketplace adapts to changed economics. The big picture for analysts from the CARTS release is consumer spending is still volatile, as some recent positive momentum was followed up by the September decline that was noted. It highlights how challenging the post-pandemic recovery has been as consumer behavior just keeps shifting. Trends in retail sales as measured by CARTS will be a big help in anticipating economic activity as tough spots on the inflation front and changing consumer patterns keep shaping the overall retail scene.
ISM Manufacturing PMI Falls Indicates Easing Global Demand
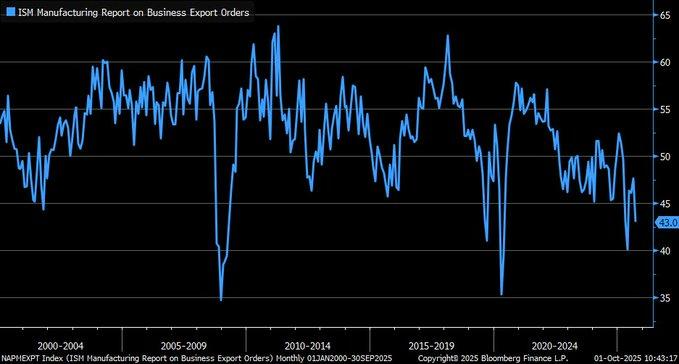
In September 2025, the new export orders index for the ISM Manufacturing PMI fell sharply to 43, a decline of 4.6 points since August. This pullback in overseas demand as reflected in the attached Bloomberg chart covering the period 2004–2025 portends increasing woes for U.S. producers. It’s one of the lower index readings since the recession of 2008–2009 when it dipped as far as nearly 35, highlighting how dire the marketplace currently is. The overall PMI composite reading as 49.1 stays below the pivotal threshold of 50, a sign that manufacturing business was still contracting. These statistics indicate a deceleration in cross-border trade coupled with the risk of tariffs and softening mainstay business in such markets as China as well as Europe.
The abrupt slowdown in export orders means that U.S. producers now find increasing headwinds in foreign business that could derail U.S. corporate earnings forecasts. With waning overseas demand, their analysts should monitor closely its effect on corporate profitability in general, particularly for corporations who significantly rely on foreign sales. It poses a concern on the future earnings outlook,particularly on multinationals as well as industries that significantly rely on foreign business such as tech, industrials, as well as consumer goods. In the United States stock market, a slowdown in export orders might cause an increase in volatility, especially in export-oriented industries. The prospects for slower earnings development in response to weaker demand in China, Europe, and other major markets might put a downward spin on stock prices. Furthermore, this worsening in global trade might affect Federal Reserve policy intentions later in 2025 as the central bank weighs the tension between containing inflation versus encouraging economic development. Analysts ought to pay attention to any cues by the Fed on rate changes or monetary easing if global trade risks continue on a trajectory since this could directly influence sentiment in the marketplace as well as investors’ attitudes.
ADP Private Payrolls Down Reflects Slowing Employment Hires
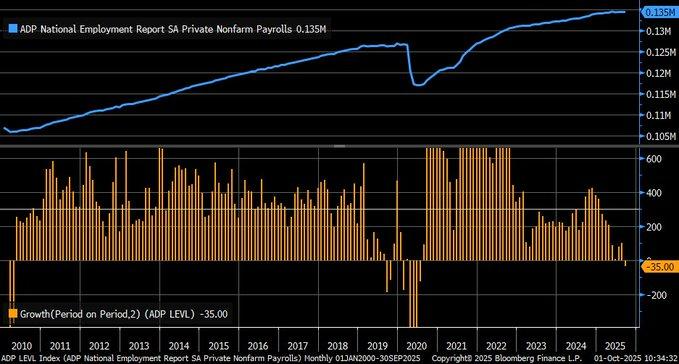
The recent ADP private nonfarm payrolls report, shared through a Bloomberg chart, reveals a concerning two-month drop of 35,000 jobs, marking the weakest performance since the 2020 recession. The September report alone saw a 32,000 job loss, reflecting a clear slowdown in hiring across key sectors such as leisure, professional services, and manufacturing. The ADP data, which is based on anonymized payrolls from over 25 million U.S. workers, offers a preliminary snapshot ahead of the official Bureau of Labor Statistics (BLS) report, providing valuable insights into the labor market’s current trajectory.
Comparing ADP against the BLS report can often give a more nuanced sense of employment trends as job creation trends can often show divergences between the two surveys. ADP being a real-time indicator compared against the more complete and authoritative measure of U.S. job growth that is the BLS data, a slowdown by ADP can be a sign that the overall labor market might soften but could equally be a sign of seasonal or temporary factors playing a part. Weakness that was identified in particular industries such as leisure and manufacturing might indicate that industries where slower growth or increasing costs can cause tightening up on hiring by these industries but others can still experience demand. This slowdown in job creation, combined with flat annual pay increases of 4.5%, will give the Federal Reserve pause when it comes to interest rates next. Should hiring continue to decline with wages held in check, the Fed will find itself in a quandary as it considers the need for rate cuts as a means of bolstering slow economic growth versus its concerns over inflation. Since the job market still shows some vitality by its own measures, any Fed action will depend on whether the recent slowdown is a temporary interlude or the beginning of a more significant deceleration. Analysts tracking these trends will offer a keen eye toward where artificial intelligence-driven efficiencies in the workplace may yet play a factor as well in hiring patterns as they do in anticipated wage increases.
Upcoming Economic Events
ECB President Lagarde Speaks, Non-Farm Employment Change, Unemployment Rate, BOE Governor Bailey Speaks, ISM Services PMI
This week ushers in a dense lineup of economic events that could significantly shift the macro landscape and investor sentiment across global markets. With key labor market data and central bank speeches scheduled, the stakes are high as market participants look for fresh signals on the direction of monetary policy, economic resilience, and inflation dynamics. From Europe’s monetary outlook to U.S. service sector momentum, every data point will be scrutinized for its forward-looking implications. At Zaye Capital Markets, here’s our take on what to expect—and how each item could move the markets.
ECB President Lagarde Speaks
The eurozone remains at a critical inflection point. Inflation is moderating, but not fast enough to rule out future rate hikes. When ECB President Christine Lagarde speaks this week, markets will listen closely for any policy tilt—hawkish or dovish.
- If Lagarde signals that inflation remains uncomfortably sticky and hints at further tightening, expect the euro to strengthen and yields on European bonds to tick higher, pressuring equity valuations, especially in interest rate-sensitive sectors like real estate and utilities.
- Conversely, if she strikes a more cautious tone—perhaps citing weaker industrial output or cooling consumer demand—markets could interpret this as a green light for future easing. That could lift eurozone equities, weaken the euro, and support peripheral bonds.
Non-Farm Employment Change
Arguably the most anticipated release of the week, the U.S. non-farm payrolls report will offer a critical update on labor market conditions.
- A stronger-than-expected print would confirm continued hiring momentum, validating the Fed’s higher-for-longer stance. That scenario could put pressure on growth and tech stocks as yields rise, while also dampening hopes for early 2026 rate cuts.
- On the flip side, a disappointing jobs number—particularly one below the 100k mark—may revive bets on a policy pivot, triggering rallies in rate-sensitive names like consumer discretionary and REITs, and sending Treasury yields lower. It would also signal that businesses may be pulling back in anticipation of a slowdown.
Unemployment Rate
Closely tied to the jobs report is the unemployment rate—another key metric the Fed watches closely.
- A lower-than-expected unemployment rate would signal labor market tightness, potentially stoking wage inflation concerns and reinforcing hawkish Fed rhetoric. In such a scenario, the U.S. dollar could strengthen on the back of elevated rate expectations, while equity markets may come under pressure, especially if wage data also shows acceleration.
- Alternatively, a higher-than-forecast unemployment rate—particularly one creeping toward or above the 4% threshold—would suggest slack is emerging in the labor force. That could be seen as a dovish signal and lead to renewed buying in bond markets and growth equities.
BOE Governor Bailey Speaks
With the UK economy facing stubborn inflation and weakening consumption, Governor Andrew Bailey’s remarks will be closely dissected.
- Should he reinforce the Bank of England’s commitment to taming inflation—even at the expense of growth—it would signal continued rate pressure and likely bolster the pound, while putting downside risk on UK equities, particularly banks and retailers.
- However, if Bailey adopts a more measured stance, acknowledging economic strain and hinting at a possible pause or eventual cut, risk assets could rally. Sterling might weaken slightly, but equities—especially in the FTSE 250 segment—may find some upside as rate pressures ease.
ISM Services PMI
This index remains a crucial barometer for U.S. economic health, given the dominance of services in GDP composition.
- A reading above expectations—particularly one closer to or exceeding 54—would reinforce the view that the economy remains resilient, with demand staying strong in sectors like travel, health care, and finance. However, such strength could also complicate the Fed’s path, as persistent service inflation remains a concern. Markets could see a mixed reaction: cyclical stocks may rally, while rate-sensitive areas may lag.
- A weaker-than-expected PMI, especially below the 50 threshold, would point to contraction in services activity and may trigger a flight to safety across bonds, gold, and defensive equities such as utilities and consumer staples.
Bottom Line for Markets
This week’s economic slate offers a well-rounded view of monetary policy direction, labor market strength, and service sector momentum. If most readings come in above forecast, we may see a renewed pricing in of tighter policy across the U.S. and Europe—strengthening respective currencies but weighing on equities. If figures come in below expectations, markets may welcome the reprieve as a sign that easing cycles could begin sooner than anticipated.
At Zaye Capital Markets, we continue to monitor these developments closely, advising clients to maintain flexibility in positioning, with a balanced exposure to both defensive plays and value opportunities that benefit from rate stability.
Stock Market Performance
Indexes Rebound from April Bottoms But Suggestively Weak Breadth Keeps Cautionary Message Alive
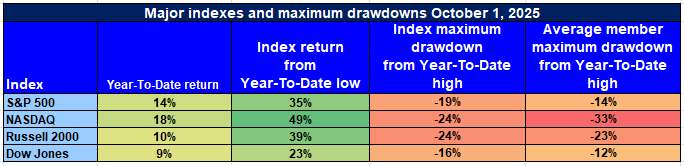
The domestic equity market has been holding up since the April 8th bottom as year-to-date performances seem solid on the surface. But the underlying member- as well as index-level drawdowns reveal the more precarious foundation where investors will need to remain on their toes for volatility as well as disparate participation.
Here’s our recap of the week’s performance on major indexes:
S&P 500: Gains Driven by Larger-Cap Strength
YTD: +14% | +35% lower than April low | -19% lower than YTD high | Avg. member: -14% from April low / -25% lower than YTD high
The S&P 500 showed robust headline strength with 14% year-to-date gains and 35% recovery off April lows. Still, 19% losses off highs and 25% on-average member losses off their highs themselves serve as reminders the gains still remain concentrated among select large-cap winners.
NASDAQ: Outperformance Masking Deep Member Drawdowns
YTD: +18% | -49% below April’s low | -24% below YTD’s high | Avg. member: -33% below April’s low / -48% below YTD’s high
The NASDAQ registered the greatest index-level rebound, surging 18% YTD as well as 49% off the lows in April. However, an abrupt 24% decline back from the YTD highs as well as merciless 48% average member decline suggest weakness in the technology-sensitive growth sector.
Russell 2000: Weak Conviction Small-Cap Rally
YTD: +10% | +39% below April low | -24% below YTD high | Avg. member: -23% below April low / -38% below YTD high Despite 39% rally relief from April lows as well as an admirable 10% YTD performance for the Russell 2000, the small-cap index still demonstrates symptoms of distress. 24% drawdown off highs as well as outsized average member losses indicate continued stress on less-liquid, economically sensitive issues.
Dow Jones: Defensive Bias Provided Relative Stability
YTD: +9% | +23% lower than April low | -16% lower than YTD high | Avg. member: -12% since April low / -23% lower than YTD high The defensive composition of the Dow Jones still provides some refuge, higher by 9% so far this year as well as 23% on the rebound from April highs. Rather modest 16% index-level drawdowns suggest health on the strength side, but member-level falls of 23% all the way down from highs indicate stress pockets being present.
We continue to be selective at Zaye Capital Markets but prefer qualitative names with robust balance sheets and defensive streams of income but keep tight attention on breadth measures as well to see if this rally develops into something more sustainable as well as broad-based.
The Strongest Sector in All These Indices
Communication Services and Technology Maintain Year-to-Date Lead
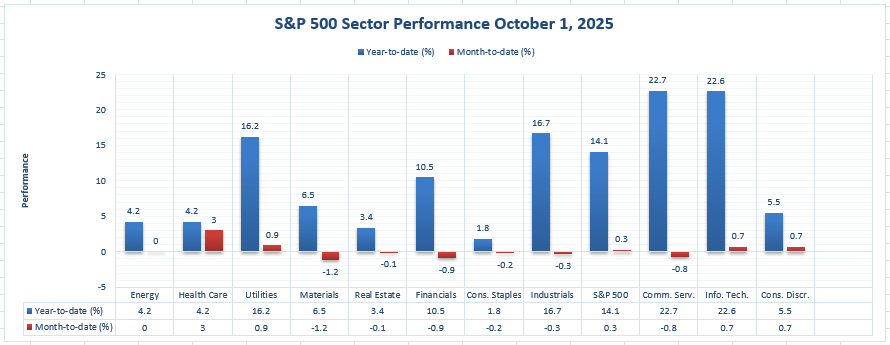
Through October 1, 2025, sector performance within the S&P 500 presents an apparent divide between year-to-date winners and losers amidst increasing rate as well as macro stress. Although headline index performance stays positive on the whole, the sectoral breakdown presents clearer picture on where relative strength happens. According to available data, there are two sectors who have certainly distanced themselves from the rest.
Communication Services: Taking the Lead With 22.7% YTD Return
Communication Services was the best-performing sector year-to-date as it surged 22.7%, the highest of all S&P 500 sectors. Down modestly -0.8% month-to-date but the sector’s stellar YTD performance speaks well of solidly positive earnings, durable ad-recovery trends, as well as enthusiasm for platform-scalable business models. Its leadership also implies ongoing confidence in consumer engagement as well as trends toward digital monetization.
Information Technology: A Close Second at 22.6% YTD
Hot on its heels, the Information Technology sector has recorded a 22.6% year-to-date rise, alongside a 0.7% monthly gain. Tech’s resilience is underpinned by structural demand for AI, cloud computing, and semiconductors. Its steady positive momentum in recent weeks highlights strong capital inflows and improving investor conviction amid an uncertain policy backdrop.
Honorable Mentions: Industrials and Utilities
Aside from techs and telecoms, industrials (+16.7%) and utilities (+16.2%) also demonstrated significant strength during 2025. Nevertheless, both sectors recorded small month-to-date advances—-0.3% and +0.9%, respectively—-. In Zaye Capital Markets, sector rotation continues to be closely followed. Though growth-driven sectors lead year-to-date returns, the rally for Utilities and Industrials reflects increasing balanced risk appetite between defensives and cyclicals. Sectors showing both structural supporting trends as well as durability in earnings remain our preferred sectors, especially amidst shifting rate as well as liquidity trends.
Earnings
Yesterday’s Earnings (02-Oct-2025)
VinFast Auto LTD. (VFS)
Despite being scheduled in some calendars, we found no evidence that VinFast reported earnings on October 2. Its most recent public results date back to its Q2 2025 earnings, released September 4. From those latest results: it delivered 35,837 EVs in Q2 (a 172% year-over-year increase) and reported total revenue of ~ $663 million (up 91.6% YoY). However, it posted a net loss of VND20,341.6 billion (≈ $812 million), with gross margins deeply negative at –41.1%, though improved from the prior year. Key factors from that result include scaling pressures, high cost structures in EV production, and ongoing efforts at cost optimization. The wide loss reflects the challenge of turning scale into profitability.
Angiodynamics, Inc., Park Aerospace Corp., Lifecore Biomedical, Inc.
We could not locate confirmed earnings releases for those names on October 2, 2025, in the sources available.
Today’s Earnings (03-Oct-2025)
No confirmed earnings release for today
Stock Market Summary – Friday, October 3, 2025
The U.S. market started the day on firmer ground as speculation of an autumn Fed policy u-turn accelerated after back-to-back below-estimate readings for labour and manufacturing data. Although the S&P 500 and Nasdaq continue to derive strength among big-cap technology shares, the volatility of the past week has exposed market breadth weaknesses. The Dow Jones and the Russell 2000 show moderate strength as the sector rotation into industrials, energy, and defence plays.
Stock Prices
Geopolitical Events and Financial Data
The market’s positive mood today is significantly led by this week’s lower-than-expected ADP employment report and weak ISM export orders, both of which collectively reaffirmed the notion that the economy’s growth slowdown may just justify Fed interest-rate cuts. While on the sidelines, still-impeded passage of the U.S. government budget contributes an underlying sense of political risk. Internationally, market sentiment continues to be weak due to persistent weakness in Chinese economic indicators and increasing trade tensions between the United States’ trade representatives and those of Europe over the collection of the so-called digital tax.
Latest Stocks News
- Recent market discussion has shifted towards the explosive gains in next-gen innovation stocks for the last couple of years. As noted in the recent investor blog commemorating early conviction bets, space technology, quantum computing, and AI have significantly outran broader indexes. Palantir (PLTR) has spiked 1,163%, Nvidia (NVDA) has risen 322%, from their October 2023 closing prices to current October 2025 prices—reinforcing the long-term surge in AI infrastructure sector demand.
- Quantum computing company IONQ has risen by about 656%, as space launch enabler Rocket Lab (RKLB) has surged 1,140%, led by the need for scalable satellite as well as AI-related applications. Even companies such as Cipher Mining (CIFR), up 270%, and NBIS, have gained traction, despite valuation premium worries. Technical analysts remain attentive to the fluctuating risk-reward equation for the high-growth themes, especially as sector-related flows continue robust. A 2024 MIT report projecting the $13 trillion 2030 potential of AI has bolstered long-term optimist sentiment.
The Magnificent Seven and the S&P 500

The “Magnificent Seven”—Apple, Microsoft, Nvidia, Amazon, Meta, Alphabet, and Tesla—are sending mixed signals this week. While Nvidia and Microsoft have shown pockets of resilience, Tesla and Meta have continued to weigh heavily on the Nasdaq and S&P 500 due to valuation pullbacks and growth fatigue. The group collectively remains down over 18% from their summer peaks, reflecting ongoing investor rotation away from crowded mega-cap trades. This divergence highlights the fragility in index-level performance and suggests that without broad-based support from these leaders, a sustainable rally in the S&P 500 remains uncertain.
Key Index Performance through Friday, October 3, 2025
- Nasdaq: Trading around 22,900 (up ~0.4% intraday)
- S&P 500: Around 6,740, modestly higher (+0.2%)
- Russell 2000: About 2,470, displaying faint strength in small cap
- Dow Jones: 46,520, holding on to gains on the back of industrials and defensives names.
Zaye Capital Markets believes this continues to be a “risk-on but cautious” market. Focus of market leadership remaining concentrated in select names continues to belie underlying weakness on a broader basis. Investors will want to pay attention to forthcoming earnings significantly by select technology and consumer names as well as remain sensitive to additional developments on the domestic policy as well as international trade media fronts. Diversified positioning among quality value and growth continues to be crucial for managing through this stage.
Gold Price
Gold sits at about $3,851.99 per ounce today, maintaining its upward track as political unease and weakening economic cues come together to reinforce its safe-haven attractiveness. Anxiety about a potential Federal Reserve flip toward cutting interest rates has driven the gold rally as the past week saw weak economic data and renewed political wrangling. Trump’s recent comments—involving outlines for large federal agency cuts, possible mass layoffs, and red lines for foreign actors such as Hamas and Iran—have added fresh volatility to the policy picture. Those considerations bring the risk of domestic economic distress as well as geopolitical escalation into the picture—and both tend to boost the appeal of gold. What the White House says about layoffs “likely in the thousands” and intentions for reconsidering inflationary Democrat-led spending only reinforces fears about the disruptiveness of the economy—and investors increasingly bid those fears into the prices of safe-haven assets such as gold. The larger story about budget standoffs, foreign policy tensions, and institutional retrenchment takes risk appetite in the wrong direction—and gold maintains the edge as insurance for the uncertainty. In the financial realm, the market awaits key releases today led by U.S. Non-Farm Employment Change, Unemployment Rate, ISM Services PMI, as well as central bank comments by ECB President Lagarde and BOE Governor Bailey. Should today’s data fall short of expectations, it will solidify the weak lead given yesterday’s weak ADP employment report and the precipitous decline in ISM export orders, supporting another slowdown in both domestic employment as well as international trade. That context could cement gold’s rally, as investors position for the potential Fed easing cycle. Conversely, any surprise strength in today’s prints may temporarily top gold’s rally—but the political tensions surrounding Trump’s fiscal reset agenda as well as ongoing geopolitical uncertainties may insulate gold prices on the downside. In our view at Zaye Capital Markets, gold increasingly acts as a policy indicator–responsive not just to central bank stimulus but also Washington’s fiscal recalibrations as well as foreign policy messaging. In it context, investors should continue to see ongoing purchases of gold, especially should today’s data as well as political events continue to lean toward the unknown.
Oil Prices
Oil prices stabilize after turbulent beginnings for the week, Brent crude trading at $65.72 per barrel and WTI at $62.12 as both stage modest 0.5–0.6% reversals after their steepest three-day sell-offs since early Q2. Support for the bounce comes primarily due to renewed fears surrounding possible tightened Russian crude exports sanctions after their apparent easing in March–April. But technical supports on the levels of $60 for WTI hold firm for now buoying short-term buying. Threats still loom, however: OPEC production increased for the third time in September, fresh surveys showed, stoking fears about supply overhangs. Chinese demand uncertainty also deters sentiment. IEA’s recent commentary also insinuated about possible incongruence between increasing inventories and falling global demand bases for capping upside in the near term. Traders are kept in limbo between supply-side risk due to Russia–Iran considerations as well as possible U.S. policy changes on the one hand, and on the other hand, the demand-side weakness due to weak macro data as well as patchy recovery in main economies.
US political developments are stoking volatility in oil. Trump’s tweets this week—from vows of large federal agency reductions and thousands of layoffs to added pressure on Iran for nuclear negotiations and red-lining in Gaza—are resuscitating geopolitical hedging in the oil marketplace. Any conflict involving Iran or Middle Eastern players could act on crude supply lines at once, particularly through the critical chokepoint of the Strait of Hormuz. Yesterday’s softer-than-expected ADP payroll data and ISM export orders contraction reinforced fears of demand weakness, depressing sentiment and placing a temporary cap on prices. But all eyes now turn toward today’seconomic data releases, especially the United States Non-Farm Payrolls, Unemployment Rate, and ISM Services PMI. Soft readings could embolden more belief in possible Fed easing, buoying oil on broader macroeconomic reflating, whereas any positive surprise could harden the United States dollar and potentially squeeze crude down. In our view at Zaye Capital Markets, this is an environment in which oil remains sharply linked to macro and political cues, with the price action remaining erratic until clearer guidance emerges on both the policymaker side as well as the data side.
Bitcoin Prices
Bitcoin now trades at $120,369.66 after holding firm in high upward momentum amidst larger risk-repricing throughout the financial sector. Institutional inflows have largely fueled the rally as speculative interests in the futures market explode, reaching all-time highs in open interest—and sentiment on the Fed’s dovish turn continues to brighten. While Citigroup lowered its year-end target for Bitcoin to $133,000 due to macro headwinds last week, it sees Bitcoin’s 12-month target at $181,000, reflecting long-term positivity. JPMorgan estimates Bitcoin’s potential higher target at $165,000 on the basis of volatility-adjusted comparison with gold. Bitcoin’s recent 5–6% daily appreciation along with $330 million in liquidated shorts demonstrates speculative positioning as much as larger strategic allocations by mainstream finance professionals. SYZ’s announced plans for the raise of more than $200 million for an entirely dedicated Bitcoin fund demonstrates how much capital now flows into the cryptocurrency sector. Furthermore, as the total market capitalization for cryptos increased 5.6%, Bitcoin asserts its dominance as the macro landscape becomes increasingly weak. Politically, Trump’s confrontational fiscal stance is stoking the fire for Bitcoin’s safe-haven story. Threats of federal agency reductions, layoffs “in the thousands,” and hardline foreign stances on Iran and Hamas are encouraging investors to hedge policy and geopolitical risk on decentralized assets. Bitcoin excels in the unknown, and the developments also underscore its attractiveness as an asset beyond the mainstream financial and political sphere. Yesterday’s weak economic data, starting with weak ADP employment and falling export orders, reinforced the thesis of the U.S. economy’s slowdown, fueling anticipations of a rate cut and encouraging a rally in cryptos. Now it’s all eyes on today’s non-farm payrolls, unemployment rate, and ISM services. A softer-than-expected print may solidify Bitcoin’s rally further by supporting Fed easing bets, but an unexpected surge higher might temporarily dampen inflows. In our view at Zaye Capital Markets, the current ecosystem presents an extremely favorable landscape for Bitcoin in the near term, as macro volatility, political adjustments, and institutional demand coalesce to maintain its upward trajectory.
Eth Prices
Ethereum (ETH) now sits at about $4,546.30 as it continues its upward trajectory in tandem with the larger crypto market strength. This rally finds support not only from renewed risk appetite in the entire digital landscape but also from increasingly apparent institutional buying. Citigroup just bumped up its year-end ETH target to $4,500 saying the revision was due to noteworthy investor flows into Ethereum-specific products, both ETFs as well as crypto treasury plays. Separately, BlackRock’s spot Ethereum ETF (ETHA) made the equivalent of a $154.2 million ETH purchase on Coinbase Prime this week in whale-tracking data sourced on-chain. In effect, this strategic purchase by a market heavyweight lends tremendous credibility to Ethereum’s long-term application as both programmable asset as well as DeFi collateral base. Additionally, on-chain data also indicate Ethereum whales—those wallets holding between 10,000 as well as 100,000 ETH—accumulated over 840,000 ETH in the last fourteen days demonstrating an acute accumulation trend at spot prices. Such purchase behavior as well as ETF-directed flows assisted ETH in firming up well above the $4,500 psychological barrier. The impact of whale and ETF buying on Ethereum’s price system cannot be overstated. As long-term holders and institutional players intervene with large purchases, it not only drains available supply but also reflects increasing conviction in Ethereum’s macro story. Data for this week reveals that whales are not only holding—they’re accumulating hard, potentially positioning for the next leg higher as rate cut hopes and macro liquidity dynamics become more constructive. But in the meantime, analysts issue warning bells about the potential for ETF inflows to stall or turn down, or for whales to move assets onto exchanges for liquidation, potentially forcing ETH back toward the $4,000–$4,200 support range. But with open interest in Ethereum futures also marching higher in tandem, the market structure looks ever more robust. Here at Zaye Capital Markets, we see these developments as structurally bullish: institutional anchoring on the basis of ETF flows as well as whale-level accumulation indicate Ethereum continues well-placed for outperformance, at the very least as broader macro indicators as well as trends toward wider crypto adoption continue turning in its favor.
