Market Today
U.S. and European futures are essentially flat today, following Tuesday’s sharp stock market decline. U.S. futures tied to the Dow Jones are up only 61 points, or 0.1%, while S&P 500 and Nasdaq 100 futures are showing similar levels of activity. European markets such as DAX and Euro Stoxx 50 are also holding up well today, following Tuesday’s sharp sell-off. The major cause for this flat market opening is market indecision. This is because investors are processing a rapid series of aggressive moves by President Trump in the realm of geopolitics, such as his 200% tariff threats regarding Greenland. While the initial market panic appears to have subsided, market uncertainty regarding surprise moves is preventing traders from opening positions.
The Tuesday sell-off was more than a mere market correction, as the market witnessed a systemic re-pricing of political risk. The US markets saw a sharp fall, with the Dow losing over 870 points, the S&P 500 declining 2.1%, and the Nasdaq dropping 2.4% to move into the red for the year. Trump’s comments, where he declared increased tariffs for eight member nations of the NATO alliance, accompanied by a 200% tariff for French wine and champagne following a diplomatic slight, sent shockwaves through risk markets globally. Trump’s Greenland fixation is no longer a mere symbol of his erratic behavior, but markets are now considering this a genuine geopolitical crisis that carries trade implications. The AkademikerPension, a Danish pension fund, announced the sale of its $100 million Treasuries portfolio due to these risks, further fueling the fear of a silent outflow of foreign capital from the US.
The response in the bond markets reflected the nervousness in the market. Yields on the 10-year U.S. Treasury note breached 4.3%, signaling that investors want higher returns to invest in government paper in the face of fiscal uncertainty and increased geopolitical noise. On the other hand, the U.S. dollar eased slightly, signaling the classic ‘safe-haven’ play is being abandoned in favor of a more ‘selective risk-off’ approach. In Europe, the same dynamics are unfolding. While the EU has yet to issue an official response to the tariffs threatened by President Trump, sources say bloc-wide retaliation is being discussed behind the scenes. It’s this tension, in turn, that’s now weighing on European risk assets, helping to explain why futures are stuck in the face of positive earnings sentiment. Currently, market sentiment is dependent on two primary elements: the ability of earnings announcements from the likes of Johnson & Johnson and Halliburton to offer some respite, and the possible injection of volatility by Trump during his Davos address. A positive surprise from earnings announcements could temporarily provide some cushion to the markets, but if Trump chooses to escalate the impasse during his Davos address, the markets may crash once again. At Zaye Capital Markets, our assessment is that the current flat market futures are a result of a temporary ceasefire and not a recovery.
Major Index Performance as of Wednesday, 21 Jan 2026
- S&P 500: ~6,823, down from Tuesday’s levels after extending recent losses.
- Nasdaq Composite: ~23,515, continuing to track lower amid tech selloff.
- Dow Jones Industrial Average: ~48,488, pressured by broad equity weakness.
- Russell 2000: ~2,645, showing sensitivity to risk sentiment in small-caps.
The Magnificent Seven and the S&P 500
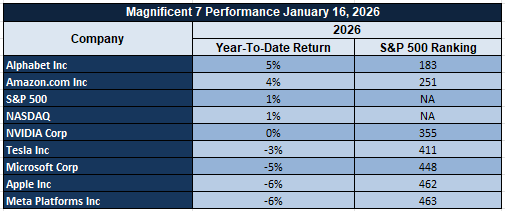
The Magnificent Seven, or the biggest contributors to U.S. equity market action, saw increased selling pressures driven by valuation worries and risk re-pricing. Individual declines among this group of megacap market leaders have been a significant factor in market weakness, having an outsized impact on the S&P 500 Index and Nasdaq Composite. A concentrated market leadership environment is now exacerbating risks, illustrating how a lack of broad-based market participation can increase volatility during periods of macro stress.
Factors Propelling the Market Movement – Wednesday, January 21, 2026
With U.S. and European markets processing a spate of new economic announcements, as well as geopolitical outbursts and monetary policy shifts, investor sentiment is cautious as it has been following a trading day that saw market turmoil not witnessed in a long time. President Trump’s hardening stance on trade, especially with his latest call for a takeover of Greenland and tariffs imposed on NATO countries, has contributed significantly to market uncertainty. Below are the top three factors that are shaping market sentiment today.
1. Rising Tariff Threats and Arctic Power Dynamics
The president’s press conference on Tuesday has introduced immediate geopolitical risk to global markets. His threat to slap 10-25% tariffs on eight NATO countries unless a Greenland agreement can be reached, together with threats of 200% tariffs on French wines, has alarmed European allies and markets alike. The president’s assertion of Arctic territory as part of US national security concerns, together with statements from the White House on Greenland’s strategic importance to global positioning, has alarmed investors about the possibility of an all-out diplomatic split. Markets reacted quickly to the news: stock market indices plummeted across the board, with the Dow shedding over 870 points and the S&P 500 shedding 2.1%, pushing both indices firmly into negative territory for 2026. Safe-haven currencies saw large inflows, gold spiked, and treasury yields broke above 4.3%, signaling to markets that they are now pricing in the possibility of prolonged global conflict.
2. Economic Calendar Surprises Fuel Market Sensitivity
Investors are facing a busy week for economic data, which is adding more complexity to already delicate market sentiment. UK inflation figures were weaker than expected this morning, coming in at 3.2% year over year, versus an expected 3.5%, which could provide some temporary relief for the Bank of England. However, markets remain focused on U.S. pending home sales figures due out later today, which are expected to be down 2.6%, potentially sparking concern about consumer strength. Additionally, U.S. oil inventories and Fed speeches could influence short-term rate markets, adding to volatility in bonds. A combination of poor demand trends and tariff threats has sparked a highly reactive market, with every economic data point being analyzed for directional insight.
3. Investor Positioning Caught Between Risk and Safety
After the selling seen yesterday, institutional investors are re-evaluating their risk exposure, especially in the tech and growth sectors, which are more vulnerable to the impact of a rising rate environment and geopolitics. Trump’s latest move, pushing for a ban on Wall Street investment banks’ purchase of single-family homes, announced within a larger affordability and national rejuvenation strategy, introduces a new risk factor for the real estate and banking sectors. However, European pension funds, such as Denmark’s AkademikerPension, have already begun withdrawing their investments from U.S. Treasurys in a move against Trump’s escalating rhetoric. This is a rather unusual confluence of foreign policy considerations and financial markets, indicating that financial markets may become increasingly subject to political storylines in 2026.
In sum, the current market is reacting to a powerful mix of geopolitics, economic uncertainty, and increasing pressures on interest rates. This leads to a defensive market, highly unpredictable futures, and a waiting-and-seeing approach on both sides of the Atlantic. Until the clouds of tariffs, central bank sentiment, and earnings season are cleared, market sentiment will remain on edge.
Digesting Economic Data
The TRUMP Tweets and Their Implications
In the whirlwind of presidential proclamations to commemorate the first year of being back in the White House, Trump has embarked on a full-scale narrative overhaul, linking the strength of the country to the Arctic, housing, military power, and an innovative brand of economic nationalism. At the forefront, of course, remains the issue of Greenland, with the President declaring the region “vital to the country’s security and Arctic supremacy.” When he says NATO and the US will “work out something very happy” in the Greenland sphere, one suspects he’s foreshadowing coming shifts in the global balance of power, as well as possible tariffs in the event diplomacy doesn’t go as planned. At the heart of the narrative, however, the message could not be more distinct: the Arctic’s resource control will now be seen not only as an energy concern or military one, but as the new dividing line in the world. Markets, as one would imagine, are responding to this geopolitical construct, particularly in the realm of commodities and the defense sector, as investors assess the implications of increased Arctic militarization.
In addition to the situation in Greenland, Trump’s focus is now on restructuring at home. This latest executive order that bans Wall Street banks from acquiring residential homes indicates a dramatic shift in policy direction—housing as a battleground between institutional investors and American citizens. This development is likely to have spill-over effects on REIT and housing stocks. However, in addition to the above, the White House is now promoting a novel affordability initiative in advance of Davos, in addition to its so-called “10 billion green energy infrastructure rollout.” While these initiatives indicate economic stimulus, there is a clear signal that the administration’s policy direction is now interventionist and thus likely to defy the conventional expectations of a deregulatory and non-interventionist approach that was traditionally associated with Wall Street.
Globally, Trump is escalating the pressure on traditional institutional frameworks. His willingness to forgo “soft diplomacy” in China, his disapproval of the UK’s agreement over the Chagos archipelago, and his demand for a new trade order “focused on fairness, not fear” indicate a leader who is not hesitant about dismantling the post-World War consensus-building frameworks. The administration’s suggestion of a new “Board of Peace” that can work in parallel with the United Nations may indicate a parallel diplomacy structure, possibly led by the United States and its allies of choice. This, coupled with the reiteration of the “America First but not America Alone” policy, brings a degree of uncertainty regarding the future of trade mediation, tariffs, and conflict resolution globally.
Finally, the mood emanating from the White House is one of hope tempered with pressure: boasting of “365 wins in 365 days,” noting the reduction in crime rates and the building of the military, while being confronted with increasing protests in areas such as Minnesota and the Pacific Northwest. The internal unrest, together with the impending decision from the Supreme Court regarding the legality of tariffs, makes it clear that the country is in transition. The president’s message regarding “national rebirth,” “energy dominance,” and “record investment flows” is intended to convey strength, but the investor must remain alert to whether that strength is realized in stable policy decisions or more instability.
ETF Flows Highlight Investor Preference for Size, Liquidity, and Earnings Visibility
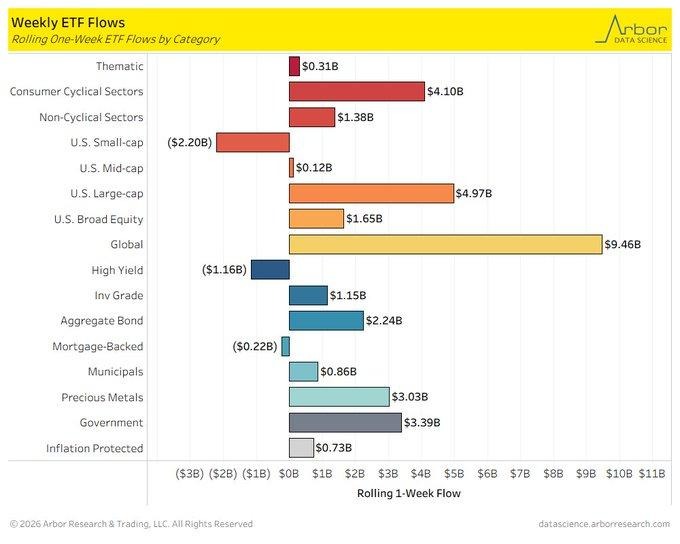
Data on weekly fund flows shows a clear movement of investors towards stability as capital flows decisively into global equities and large-cap investments. The movement of investors shows that they are not withdrawing from risk assets as a whole but moving towards companies that have better balance sheets and higher pricing power. The observation that equity categories as a whole reported net inflows strengthens the impression that investors are merely reshuffling their portfolios rather than withdrawing capital from them. In our view, it is a result of caution about inflation persistence and growth trends.
However, significant outflows in smaller stocks highlight a growing risk divide in equity markets. Smaller stocks are relatively more vulnerable to funding trends, margin trends, and demand uncertainties, thus establishing a rationale for these stocks being tapped for funding reallocations into safer investments. Notwithstanding the growing risk divide, valuation mismatches emerge in smaller stocks where selling pressures outweigh fundamentals. While investment in smaller stocks faces fundamental issues, investment opportunities arise where selling pressures outstrip fundamentals. Fundamentally sound stocks with strong cash flows, low refinancing risk, and high price flexibility should be identified by analysts.
In addition to equity flows, selective allocation into digital asset-related products and regional equity funds indicate that investors are not yet ready to give up on growth but are instead seeking it in a diversified and managed way. The barbell strategy is certainly helpful in making a case for large-cap platforms, which have both defensive qualities and the potential for long-term growth in their outlooks. Given this overall context, Microsoft is seen as an undervalued company in terms of its resilience in earnings, sustainable business model, and overall positioning strategy.
Future Economic Events
GBP CPI y/y, President Trump Speaks, Pending Home Sales m/m, ECB President Speaks
As we enter this period of the macro events on the agenda, markets are gearing up for the combination of inflation numbers, housing data, and policy messaging that may shape markets in the coming days. At this point in the cycle, markets are no longer reacting to data but instead to whether the data fits in or contradicts the existing story of sticky inflation, slowing growth, and flexible policy. Each of the events listed below presents asymmetric risk in the form of surprise versus market expectation.
GBP CPI y/y
The year-on-year inflation print from the United Kingdom will be a key test of whether price pressures are easing fast enough to relieve pressure on household demand and corporate margins.
- If the CPI reading comes in higher than forecast, markets are likely to price in a more restrictive policy outlook, pushing the pound higher while weighing on domestic equities, particularly consumer-facing and rate-sensitive sectors. Elevated inflation would also reinforce concerns that input and wage pressures remain embedded, limiting margin recovery for businesses.
- If the reading comes in below expectations, it would support the view that disinflation is gaining traction, potentially weakening the currency while providing relief to equities tied to domestic consumption, housing, and credit-sensitive activity. Analysts should look beyond the headline and assess services inflation and core components to judge whether easing pressures are sustainable.
President Trump Speaks
Policy communication remains a major sentiment driver, and remarks from Donald Trump will be scrutinized for signals on growth priorities, trade posture, and tolerance for tighter financial conditions.
- A more forceful or confrontational tone would likely reinforce risk-off positioning, support defensive assets while pressuring equities and rate-sensitive sectors. Such messaging could also revive inflation concerns if policy direction implies higher costs or supply disruption.
- On the other hand, a more growth-supportive or conciliatory tone could trigger a relief response across risk assets, particularly cyclical industries that benefit from improved confidence and looser financial conditions. We will be watching for consistency between rhetoric and broader policy direction rather than isolated soundbites.
Pending Home Sales m/m
Pending home sales data provides insight into future demand in housing as well as market confidence.
- A better-than-expected outcome would indicate that housing market conditions are holding up despite high borrowing costs. On the other hand, a robust housing market may re-ignite concerns about inflationary pressures in housing and services.
- On the contrary, a softer outcome would confirm market views about reduced demand due to high borrowing costs. In this regard, market analysts are advised to monitor trends in housing data over several months due to sensitivities to rate decisions and seasonal factors.
ECB President Speaks
Statements by leaders of the European central bank will be closely noted for insight into confidence related to inflation and economic tolerance levels.
- A more prudent message focusing on concerns about inflation will help support the euro but hurt European equities sensitive to higher costs of funding.
- On the other hand, a dovish message acknowledging concerns about growth will ease funding conditions, which will benefit exporters and sectors sensitive to interest rates. We will listen for guidance regarding balancing inflation momentum and economic slowdown concerns.
Stock Market Performance
Indexes Hold Near Flat YTD, Yet Member Drawdowns Show Uneven Participation
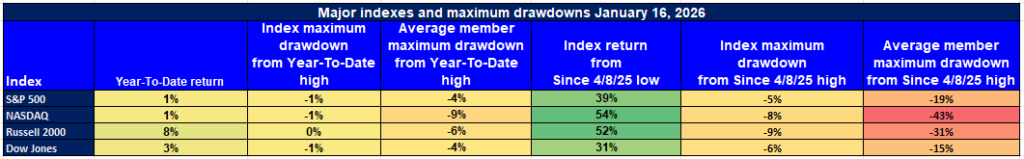
Major equity indexes are barely positive year-to-date, but the rebound from the April 8, 2025 low remains powerful. From our perspective at Zaye Capital Markets, the key message is not the headline YTD number — it is the gap between index strength and what the average stock inside each index is still living through. When the index is up modestly but the average member is still deep in drawdown, it usually means leadership is narrow, stock picking matters more, and “the market” is not the same experience for most portfolios.
Here’s our breakdown of the figures exactly as shown in the chart:
S&P 500: Flat YTD, Solid Rebound — But Breadth Still Thin
YTD: +1% | Index max drawdown from YTD high: –1% | Avg. member: –4%
Return since 4/8/25 low: +39% | Drawdown since 4/8/25 low: –5% | Avg. member: –19%
The index is only up 1% this year, yet it has rallied 39% since the April low, showing a strong recovery profile at the surface. The concern is underneath: while the index itself only pulled back 1% from its YTD high, the average stock has seen a 4% maximum drawdown from that same YTD high and remains –19% off its own post-April path. That spread signals uneven participation and continued fragility in the “typical” constituent.
NASDAQ: Biggest Bounce, Most Pain Beneath
YTD: +1% | Index max drawdown from YTD high: –1% | Avg. member: –9%
Return since 4/8/25 low: +54% | Drawdown since 4/8/25 low: –8% | Avg. member: –43%
This is the clearest example of index strength masking member weakness. The NASDAQ is up just 1% YTD, yet it has surged 54% since the April low — a powerful rebound. But the average member drawdown since that low is –43%, which tells us many names are still far from recovery even while the index looks healthy. In this setup, leadership is doing the heavy lifting, while broad participation remains strained.
Russell 2000: Strong YTD, Yet Average Stock Still Underwater
YTD: +8% | Index max drawdown from YTD high: 0% | Avg. member: –6%
Return since 4/8/25 low: +52% | Drawdown since 4/8/25 low: –9% | Avg. member: –31%
Small caps stand out with the best YTD gain at 8% and a 52% rebound since the April low. Yet the average member drawdown since the April low is still –31%, and the average member maximum drawdown from the YTD high is –6% even as the index shows 0% on that measure. For us, that reinforces a selective environment where index progress can coexist with meaningful stress across many individual companies.
Dow Jones: More Stable Profile, Less Member Damage
YTD: +3% | Index max drawdown from YTD high: –1% | Avg. member: –4%
Return since 4/8/25 low: +31% | Drawdown since 4/8/25 low: –6% | Avg. member: –15%
The Dow’s rebound is more moderate at 31% since the April low, with a 3% gain YTD. What stands out is the relatively smaller member drawdown: the average constituent is –15% since the April low, less severe than the other indexes shown. This suggests a more balanced internal structure, even though the index still experiences drawdowns like the –6% maximum pullback since the April low.
At Zaye Capital Markets, our takeaway is straightforward: the rebound is real, but it is not evenly distributed. Until average-member drawdowns improve meaningfully, we treat index strength as a signal to stay disciplined — prioritising quality, liquidity, and earnings visibility over broad exposure.
The Strongest Sector in All These Indices
Industrials Leads Year-to-Date, While Real Estate Leads on the Day
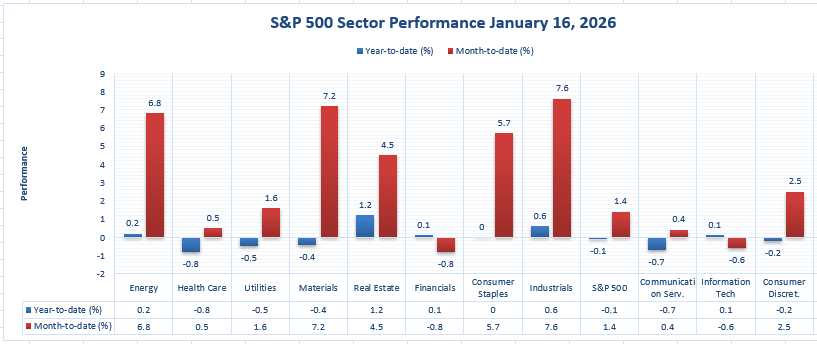
On the basis of sector performance as indicated in the graph, the sector that has been performing best in the year so far is the Industrials sector. This sector has recorded a gain of 7.6 percent, followed by Materials, Energy, and Consumer Staples, which have recorded gains of 7.2 percent, 6.8 percent, and 5.7 percent, respectively. This is in contrast to the index, which has only recorded a gain of 1.4 percent.
Turning to the specific session of 1/16/2026, the best one-day sector performance is led by the Real Estate sector, which was up +1.2% on the day. This was followed by the Industrials sector, which was up +0.6%, and the Energy sector, which was up +0.2%, although other sectors struggled to keep up. The Health Care sector was down –0.8%, the Communication Services sector was down –0.7%, and the Utilities sector was down –0.5% on the day.
In our view at Zaye Capital Markets, what stands out is that industry leaders change depending on the time horizon. The industrials are currently the leaders for the year to date, up 7.6%, while Real Estate is the leader for the day, up 1.2%. We are also paying attention to see if leaders for the year to date can maintain their lead and if sectors like Financials, down 0.8% for the year to date, and Information Technology, down 0.6% for the year to date, can stabilize.
Earnings
Earnings Recap — January 20, 2026 (Yesterday)
- 3M Company reported earnings per share of 1.83 USD versus expectations of 1.80 USD, representing a +1.78% earnings surprise, with a market capitalisation of 82.93 B USD. From our perspective, this confirms steady operational execution across its diversified industrial segments. The relatively modest beat reinforces that investors should focus less on short-term earnings upside and more on forward margin stability, cost discipline, and the company’s ability to protect cash flows in a slower industrial demand environment.
- Fifth Third Bancorp delivered earnings per share of 1.04 USD against an estimate of 1.00 USD, a +4.43% surprise, supported by a market value of 33.13 B USD. The result highlights solid profitability and disciplined balance-sheet management. Analysts should continue to watch net interest income trends, deposit stability, and credit quality as key drivers of earnings durability.
- KeyCorp posted earnings per share of 0.43 USD compared with expectations of 0.39 USD, generating an +11.12% surprise, with a market capitalisation of 22.90 B USD. This was the strongest relative beat among the regional banks reported. From our standpoint, the magnitude of the surprise shifts attention toward sustainability, particularly funding costs, loan demand, and forward guidance rather than backward-looking performance.
- U.S. Bancorp reported earnings per share of 1.26 USD versus 1.19 USD expected, a +5.99% surprise, supported by a market capitalisation of 84.53 B USD. The result reflects balanced revenue streams and scale advantages. Analysts should monitor expense control and credit trends to assess whether earnings strength can persist in a more cautious lending environment.
- D.R. Horton, Inc. delivered earnings per share of 2.03 USD against expectations of 1.93 USD, a +5.45% surprise, with a market value of 44.74 B USD. While execution remains strong, we see margins and order momentum as the critical variables to watch as affordability pressures continue to shape housing demand.
Earnings Preview— January 21, 2026 (Today)
- Disco Corp.’s earnings are due today, with investor focus squarely on demand trends across precision manufacturing and technology-linked equipment. We will be watching revenue momentum and margin stability as indicators of capital spending confidence in specialised industrial applications.
- Johnson & Johnson is scheduled to report today, and attention will be on the balance between pharmaceutical growth and medical technology performance. From our perspective, guidance around organic growth and cost discipline will matter more than headline earnings, given the company’s defensive profile.
- Charles Schwab Corporation’s earnings will be closely examined for net interest income trends, client asset flows, and expense control. Analysts should focus on how profitability is holding up amid shifting rate expectations and investor activity levels.
- Prologis, Inc. reports today, offering an important read on logistics and industrial real estate demand. We will be monitoring occupancy trends, rent growth, and forward guidance to assess whether supply-chain normalisation is translating into stable cash-flow visibility.
From Zaye Capital Markets’ perspective, yesterday’s earnings showed consistent execution with upside surprises, while today’s reports will test whether forward guidance supports sustained confidence across industrial, financial, healthcare, and real-asset segments.
Stock Market Analysis – Wednesday, 21 Jan 2026
The U.S. equity market is trading under pressure amid the continuation of the risk-off environment from the previous trading session. The steep fall in the major equity indexes on January 20th was driven by the rise in trade policy uncertainty associated with the announcement of tariffs, leading to risk-off positioning, increased volatility, and subsequently, increased safe-haven demand. With the current trading session extending the aforementioned trends, the market is reflecting the sentiments of caution associated with the reduction in the leadership breadth. Our analysis at Zaye Capital Markets views the current market scenario as one that is associated with the rise in macro-geopolitical tensions.
Stock Prices
Economic Indicators & Geopolitical Developments
Markets are continuing to process the implications of increased geopolitical uncertainty, with tariff tensions leading to one of the sharpest declines in U.S. markets over the past few months. The risk-off sentiment is further exacerbated by supply chain risks and investor repricings of growth estimates based on policy uncertainty. This is the primary factor shaping equity markets with macro data relegated to secondary status.
Latest Stock News
Artificial intelligence continued to be the biggest story in the market as various large-cap tech and platform firms discussed the shift from testing to implementation with AI. A leading data analytics platform pointed out that true competitive advantage with AI is not gained through access to models, but through possession of the data layer that enables AI to function across various systems and processes. This approach was illustrated through an announcement of a multi-year deal with a leading Asian industrial conglomerate valued at hundreds of millions of dollars.
Meanwhile, the best and brightest in the industry indicated the coming year would see the reality of fully automated software development. Markets are beginning to price 2026 as the year of the breakthrough for agent-based AI, where value propositions increasingly move towards platforms that can deliver autonomous systems safely. This remains a good time for hyperscalers, enterprise software platforms, and data-centric AI players, although concentration risk looms large if the benefits are not broad-based.
Compute supply and geopolitics were also in the mix. Discussion around the export of advanced chips further solidified the notion that compute power is now being regarded as a kind of power in its own right, with leading-edge AI compute hardware being regarded as strategic infrastructure rather than as products. On the other hand, cloud and commerce platforms pointed out the problem of accelerating global demand for compute in AI, outpacing the generation of power and the supply of semiconductors.
From an infrastructure perspective, new commitments for data centers within the Middle East reflected an accelerated pace of global spending, initially scaled to hundreds of megawatts but quickly expanding to meet the growing gap between inference requests and available processing capabilities. Simultaneously, enterprise software vendors further integrated AI through long-term collaborations to weave AI agents directly within business processes, transitioning from monetization models based on product to usage. Mobility vendors furthered their longstanding views for autonomous systems to eventually displace human-operated services over multiple decades.
From our perspective at Zaye Capital Markets, these events only serve to validate the reasons that mega-cap technology and platform companies are being repriced, since the markets are no longer questioning whether AI is effective, but rather who controls the infrastructure, data, power, and deployment layer. This is resulting in winners, but also creating a level of sensitivity in terms of whether the benefits of AI are expanding beyond the current winners.
The Magnificent Seven and the S&P 500
The Magnificent Seven, or the biggest contributors to U.S. equity market action, saw increased selling pressures driven by valuation worries and risk re-pricing. Individual declines among this group of megacap market leaders have been a significant factor in market weakness, having an outsized impact on the S&P 500 Index and Nasdaq Composite. A concentrated market leadership environment is now exacerbating risks, illustrating how a lack of broad-based market participation can increase volatility during periods of macro stress.
Major Index Performance as of Wednesday, 21 Jan 2026
- S&P 500: ~6,823, down from Tuesday’s levels after extending recent losses.
- Nasdaq Composite: ~23,515, continuing to track lower amid tech selloff.
- Dow Jones Industrial Average: ~48,488, pressured by broad equity weakness.
- Russell 2000: ~2,645, showing sensitivity to risk sentiment in small-caps.
As we see in Zaye Capital Markets, we consider that the current market action reflects the fact that headline risk has moved to the forefront in the very short term. Risk management and selective positioning based on balance sheets and defensive franchises will be important until there’s more clarity in the macro and geopolitical environment.
Gold Price: How Trump’s Global Strategy and Housing Clampdown Are Fueling Gold’s Surge
Spot gold prices are currently trading at US $4,866.29 per ounce, which represents a strong follow-through in the rally in 2026 and confirms that gold prices have entered a safe-haven-driven paradigm. This rally is anything but exceptional and represents a clear reaction to geopolitical pressure, presidential uncertainty, and capital flows in global markets. We, at Zaye Capital Markets, attribute this latest rally to President Trump’s broad-spectrum press conference addresses that combined military expansion, Arctic dominance, anti-China rhetoric, and housing market manipulation into one aggressive stance. President Trump’s statement that ‘Greenland is ‘crucial to national security’ and that NATO will ‘work something out’ indicates global rebalancing that may upset alliance politics. The White House’s directive to prevent Wall Street from acquiring family homes indicates direct government intervention in capital allocation—a paradigmatic shift that represents capital’s first reaction to being forced to re-price risk in the real-estate-related asset classes in unprecedented ways. Gold prices are following the rotation and seeing fresh capital flows in the wake of gold’s status as a agnostic, tangible storehouse that cannot be influenced by presidential decrees. With major economic releases lined up, including UK CPI, upcoming U.S. home sales, and press releases from President Trump and ECB President Lagarde, market participants are positioning themselves today to hedge against potential disruptions down the line. Yesterday’s strong market reversal simply added gasoline to the fire, as market sentiment was soured by the threat of tariffs, central bank ambivalence, and overcrowding in the megacap sector. Notwithstanding the strong nominal yields, the gold market’s breakout makes it clear that the market is repricing for a world of persistent policy discord, fiscal nationalism, and institutional upheaval. With the issue of housing affordability now a regulatory agenda item, military buildouts accelerating in the Arctic, and the tariff issue still up in the air, the case for gold is no longer a speculative play but a structural one. Investors are no longer simply responding to the news of the day, but rather making a bet on a multipolar world in which energy routes, defense budgets, and asset nationalization will redefine the investment map. Absent a sharp change in tone across a variety of issues or a significant appreciation in the US dollar, we see no reason why the gold market will relinquish its grasp on levels above US $4,800, potentially challenging record highs in the first quarter. In our view, what is transpiring is more than a market trade, it is a shift in the strategic defense of global capital.
Oil Prices: What Is Behind the Stability of Oil Prices Near $60 Amid Arctic Tensions?
The spot price of spot crude oil is holding steady at $59.91 per barrel after a tumultuous period where prices briefly spiked above $62 before falling back. This development at Zaye Capital Markets indicates a market trying to process rapidly shifting geopolitics, rather than purely economic data. The fundamental story, of course, remains the Arctic, and the increasing posture of President Trump on energy policy via military buildout and Greenland diplomatic maneuvering. His administration’s “energy dominance” policy, coupled with attempts to shift the Arctic trade routes into a new, US-friendly posture, has reignited concerns over the global oil transportation infrastructure. Ongoing reports out of OPEC sources, meanwhile, indicate internal discussions on prolonging the current voluntary output cuts beyond Q1 due to continued drawdown of commercial inventories. This comes on the heels of the IEA’s warning yesterday of a looming market tightness, with spare capacity dwindling at the exact time refined product demand finally stabilizes. Shipping data highlighted by Zero Hedge supports the idea, with vessels being forced to circumvent Red Sea regions incurring rising insurance costs, “delay premia,” on what is rapidly becoming a policy-driven market. Oil, of course, is now factoring a “geopolitical risk premium,” but not one based on the usual war zones, but rather on executive-level policy statements, Arctic military buildout, which cannot be ignored by market participants. Yesterday’s weakness in the market, based on risk-off sentiment, briefly impacted oil prices, but the return to $60 levels indicates that oil remains supported by underlying forces. Today’s major macro releases, including UK CPI and upcoming U.S. home sales, as well as important speeches by Trump and ECB President Lagarde, may provide further direction in the short term. If inflation surprises to the upside or central banks show signs of sustained tightening, demand prospects may moderate slightly, capping oil gains. However, if there are hints about easing or if Trump reiterates energy-related national security rhetoric, oil may advance as markets anticipate supply rigidity and export curbs. In our analysis, this $60 region is no longer a midpoint but a point of equilibrium, where fiscal policies, energy-related national security rhetoric, and supply chain rebalancing meet. Volatility and institutional hedge accumulation are on the rise, and we anticipate that oil will remain sensitive to politics and OPEC’s stance in the month of February. Unless there’s genuine supply-side relief or Trump eases up on his Arctic policy, oil will likely trade with a risk-premium that’s more psychology-driven than refinery-demand based.
Bitcoin Prices: What’s Behind Bitcoin’s Drop During Trump’s Security Efforts and Tariff Dispute?
Bitcoin is now valued at $89,366, reflecting a strong retracement from the $97,000 region. In the past 48 hours, the correction in price has intensified, with the price falling below the $90,000 psychological level as global investors continue to rotate out of risk-on assets in response to increased levels of geopolitical uncertainty. President Trump’s increased emphasis on Arctic dominance, national security, and the realignment of global power, as well as the administration’s tariff-driven pressure on the government of Greenland, has had spill-over effects in the crypto markets, particularly as he promotes deregulation in favor of “energy dominance” and increased military presence. In particular, the narrative of increased geopolitical uncertainty, in the absence of crypto policy guidance from lawmakers, is fueling nervousness in the Bitcoin markets, as investors struggle to price in the uncertainty associated with geopolitical events in the absence of guidance from regulators. President Trump’s comments on blocking the acquisition of family homes by Wall Street also continues to spook institutional investors, fueling further concerns about the unpredictability of the administration’s policies. On-chain analysis reveals long-term investors remaining committed to their positions, but short-term traders continue to fuel sell-offs as the $90K-$89K region comes into focus as the region of support. Larger-scale protests in the Pacific Northwest and other cities in the U.S., in response to anti-Trump rallies, further fuel risk-off sentiment as concerns escalate about the sustainability of markets in the current environment of geopolitical belligerence. The softer-than-expected economic readings from yesterday, such as the deterioration in consumer sentiment and the deceleration in retail sales, dented market confidence. Today, the economic calendar is dominated by the ISM Manufacturing Index and Fed speakers, both of which have the potential to shift interest rate outlooks, in turn affecting Bitcoin’s correlations with yields and the dollar. Disappointing economic readings could see the market continue to rotate towards cash, gold, and safe-havens. But a positive surprise could see Bitcoin experience some short-term respite, given the re-entry of institutions near the lower technical levels. Going forward, Bitcoin is set to remain stuck in the $89,000-$95,000 trading range in the near term until some new, positive catalyst in the form of regulatory support or the de-escalation of the current geopolitics is introduced. Here at Zaye Capital Markets, we see the crypto market environment being driven by the intricate interplay of politics, social unrest, and economic trends, all of which need to be carefully tracked by the trader in order to avoid whiplash during this key period.
ETH Prices: How ETF Buying and Whale Activity Could Shape Ethereum’s Next Price Breakout
The current market value for Ethereum is around $2,967, having retreated from highs of around $3,300 in recent days due to selling pressure in the wider crypto market. However, behind this market action, a more fundamental trend is emerging. Over the course of this week alone, spot Ethereum ETFs have attracted nearly $480 million in fresh capital from institutional investors, according to on-chain tracking reports. This is actually the strongest week for such investments since the first week of Q4 2025 and shows that institutional investors are increasingly keen to access Ethereum through a regulated product. This fresh capital influx serves to support ETH even in periods of market correction and shows that the fundamental base remains sound in spite of this market correction. Other fundamental factors are also sound: Ethereum staking is up, Layer 2 activity is expanding, and development activity in DeFi and NFT spaces is in full swing. These factors indicate a blockchain ecosystem in full use and ready to recover from current market conditions once they abate. However, the actions of the large holders are causing tension beneath the surface. Just this past week, the whale wallets have been seen moving more than $110 million worth of ETH to exchanges, a signal that usually precedes a big sale or a liquidity rearrangement. However, the presence of institutional buyers in the market through ETFs and staking mechanisms is causing a tug-of-war scenario in the market, with the Ethereum price being drawn in opposite directions by the actions of the short-term and long-term buyers. Traders are now waiting with bated breath to see if the price will be supported at the $2,900-$2,850 level. If it does, and the ETF inflows continue, the Ethereum price could be poised to move towards the $3,200-$3,400 level in the coming weeks. However, if the big holders continue to dump, and the macroeconomic conditions continue to be uncertain, then the price could move towards the $2,700 level once more. Currently, the Ethereum price is at a crossroads, with the actions of AI models, big holders, and ETFs colliding in a manner that will determine the market trend for the rest of the quarter.
