Where Are Market Today?
European and U.S. stock futures are trading higher this morning as the global markets digest the wave of positive earnings reports, as well as other macroeconomic data. S&P 500 futures are up by 0.2%, while Nasdaq 100 futures are up by 0.4%, and Dow Jones Industrial Average futures are also trading higher. This comes as the markets follow up on the gains made yesterday. Futures for the STOXX 600, DAX, FTSE 100, and other major indices are also trading higher as the global markets are reflecting the risk-on sentiments. This comes as the U.S. markets are trading higher, led by the technology sector, as well as artificial intelligence-related sectors. This comes as the global markets are digesting the macroeconomic data, as well as the Q4 earnings season. One of the major factors behind the trading of the futures higher is the earnings momentum. This comes as Palantir Technologies traded higher by over 6% in the after-hours session as the company released better-than-expected Q4 earnings, as well as bullish 2026 guidance. This comes as Teradyne also traded higher by over 20% as the company released better-than-expected Q1 revenue guidance. This comes as the U.S. and European markets are seeing higher trading in the artificial intelligence infrastructure, semiconductor, and cybersecurity sectors. With over 100 S&P 500 companies reporting earnings this week, including Advanced Micro Devices, Pfizer, Amazon, Alphabet, the earnings guidance update will play an important role in the determination of the continuation of the bullish setup for the futures.
Outside of the earnings story, macro data continues to provide upward support. Monday’s strong ISM Manufacturing PMI reading marked the first expansion since mid-2022 and supports our view that the US economy continues to gain momentum. The strength has spilled over into global macro markets as European futures have rallied on the view that the US will be an even stronger export partner for the region. In addition, President Trump’s comments that a US government shutdown agreement is near and that Iran talks are progressing diplomatically have reduced risk premiums as concerns about geopolitical tensions have abated. The risk premiums have reduced safe-haven demand and boosted risk asset classes. We also think that today’s release of the JOLTS Job Openings data will be factored into the markets as it may be an important consideration for the Fed’s ability to cut interest rates later this year as we enter Q2.
While the futures markets have clearly responded positively to the events discussed above, volatility remains just beneath the surface. Cryptocurrencies are again under pressure as Bitcoin has fallen to its lowest level since April. Gold and silver futures saw significant declines on Monday night before stabilizing overnight. The equity markets’ rally has not been uniform as Nvidia has fallen almost 3% on reports that investment discussions for OpenAI have stalled. We view the rise in futures as short-term confidence driven by corporate execution and reduced concerns over fiscal policies. We will be watching forward earnings revisions, rate comments, and risk asset class movements as key drivers for the markets’ durability through the rest of February.
Major Index Performance as of Tuesday, 3 Feb 2026
- S&P 500 – Trading at ~6,976, up ~0.5%, boosted by tech and industrials sectors
- NASDAQ – Trading at ~23,592, up ~0.6%, boosted by semiconductors and AI stocks
- Dow Jones – Trading at ~49,408, up ~1.1%, boosted by cyclicals and defensives
- Russell 2000 – Trading at ~2,640, up ~1%, boosted by small-cap rotation
The Magnificent Seven and the S&P 500
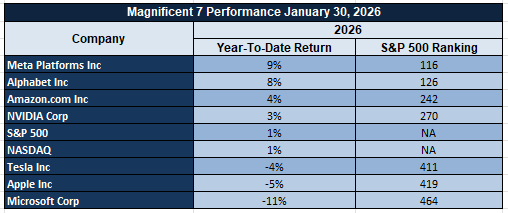
The Magnificent Seven – Apple, Microsoft, Nvidia, Amazon, Meta Platforms, Alphabet, and Tesla – are still adjusting after their strong performance in 2025. The combined stocks are down more than 18% since their highs and face pressure on margins, AI overextensions, and a cyclical shift in leadership. The worst performance has come from Tesla and Meta Platforms, but Alphabet’s AI wins and Microsoft’s cloud story help provide support. Until broadening participation and/or a return of tech leadership occur, the S&P 500 will remain at risk for a leadership fatigue and earnings sensitivity.
Drivers Behind the Market Move – Tuesday, February 3, 2026
In the United States and European markets, which are currently influenced by an array of fiscal activities, macroeconomic indicators, and shifting global geopolitics, three major factors are dictating investor sentiment and futures direction in these regions.
1. Progress Toward Ending the Government Shutdown
President Trump has confirmed that Congress is close to striking a deal to end the partial shutdown of the United States government, with additional comments encouraging Republicans to pass the funding agreement without making any amendments. The White House has reiterated that deadlines for negotiations with Homeland Security are at the core of these negotiations, with President Trump urging Congress to avoid any delays in voting on this agreement. These activities are helping U.S. futures sustain their gains, with European markets benefiting from rising sentiment regarding American fiscal stability. European equity markets are rising in line with this momentum, with investors perceiving this resolution path as a trigger for relief rallies in major equity indices.
2. Iran Diplomacy Calms Geopolitical Fears
Geopolitical risk premiums have eased following confirmation from President Trump that talks with Iran are ongoing, including direct nuclear talks that will include a US envoy. Markets had previously priced in high levels of geopolitical risk related to the Middle East conflict escalation. However, this shift towards diplomacy is having the effect of cooling safe-haven assets, softening energy prices, and lifting risk assets in both US and European equity markets.
3. Economic Data Signals and Rate Path Watch
The strong ISM Manufacturing PMI released yesterday, beating estimates for the first expansion since August 2022, confirmed US factory momentum, driving US futures into the new month. However, the market is now looking towards JOLTS Job Openings due for release today, which could shift market expectations for US labor market conditions, potentially influencing the Fed’s forward guidance. A stronger-than-expected reading could reignite fears of further rate hikes, while a soft reading could sustain equity-friendly liquidity conditions. European markets are also watching these US market signals, given the recent tone from the ECB that points towards easing measures later this year, contingent on US data trends.
In conclusion, the market tone for today is driven by the emerging theme of resolution in US politics, de-escalation of geopolitical tensions, and better-than-expected economic performance. Futures are trading higher, while volatility is lower, indicating that investors are cautiously moving back into growth assets while keeping a close eye on US labor market conditions and the Fed for further validation of market positions.
Digesting Economic Data
The TRUMP Tweets and Their Implications
Since the beginning of February, President Trump’s series of tweets has been dominating capital markets and risk pricing, creating a complicated environment for investor sentiment and asset allocation. At the forefront of market participants’ minds is President Trump’s comment that Congress is near a deal to end the partial shutdown, accompanied by his repeated pleas for Congress to pass funding bills without any changes and prevent a prolonged shutdown. This has helped alleviate near-term concerns regarding fiscal gridlock, but ongoing uncertainty regarding congressional passage remains an issue for risk assets and crypto assets correlated with overall risk sentiment. This, accompanied by signs that deadlines for homeland security funding remain a core part of negotiations, has left market participants seeking guidance from these events regarding US fiscal stability, which underlies risk asset price volatility and yield curve dynamics.
Trump’s diplomatic communications, especially regarding the continuation of talks with Iran and the resumption of discussions regarding the Iranian nuclear deal, including the involvement of the U.S. envoy, are having an immediate effect on the markets, especially in the energy and commodities space. Iran’s willingness to seriously engage in talks with the U.S. has resulted in oil price declines, indicating the easing of geopolitical risk. This is also having an effect on safe-haven assets, which were bid up due to the tension in the region. This is an example of the de-escalation having an immediate effect on the markets. Beyond the Middle East, the Trump administration’s trade deal with India, including the reduction of tariffs and the commitment by India to stop buying Russian oil, indicates the administration’s commitment to de-escalate tensions in the energy space. This has the potential to result in changes to the global demand for commodities, as well as the value of currencies. Oceania and the Gulf markets are responding to the diplomatic developments, indicating the overall market sentiment, which is rebounding as the markets are hoping for de-escalation. While the diplomatic efforts are the focus of the market, Trump has also been promoting the establishment of the critical minerals reserve, indicating the importance of the reserve for the U.S. workforce. This has the potential to result in an increase in the value of the sectors related to the supply of industrial metals, especially considering the Chinese-dominated markets. While the diplomatic efforts are the focus of the markets, the commitment by the Trump administration to not allow the Fed chair nominee to be questioned by lawmakers regarding rate cuts, despite the challenges the nominee is having in terms of reaching a consensus, indicates the administration’s commitment to not reduce rates. This is having an effect on the markets, especially regarding the divisions regarding the Fed’s rate policy. Federal Court blocks regarding immigration, as well as the high volume of communications emanating from the White House, are also indicating the overall risk.
A cursory analysis of Trump’s public comments reveals an interesting phenomenon: political developments, such as negotiations on shutdowns, trade realignments, mineral reserve strategies, and diplomatic engagements, are influencing risk pricing in financial markets. His comments are impacting everything from oil prices to commodity prices, equity markets, and global yield curves. To an investor, this implies an implicit recalculation of risk premia and policy expectations, with an emphasis on understanding how negotiations are influencing market behavior, particularly in sectors where fiscal policy and trade are significant.
Manufacturing PMI Signals Demand-Led Rebound
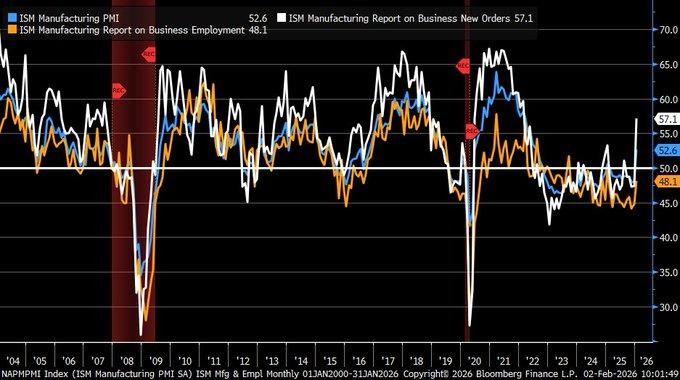
January’s ISM Manufacturing PMI came in much stronger than expected at 52.6 compared to consensus at 48.5 and up from 47.9 in December. The last time it expanded was in August last year. The big driver behind the move was a massive jump in new orders, rising to 57.1 from 47.7 in the last reading, an 18-month high. Historically, such a large move in new orders has been a precursor to a sustained manufacturing recovery and has been accompanied by risk-on sentiment in equities. The move also correlates with a visible uptrend in regional Fed surveys, so it’s not an isolated move. The trend is also more sustainable given the massive jump in new orders and should have positive implications for regional Fed surveys.
However, it’s also important to note that the employment component is still below the line at 48.1, up only modestly from last month, indicating that labor market hesitation is still an issue in the supply chain. Prices paid also rose again to 59, indicating that companies are still trying to absorb input inflation. The twin drivers of a strong manufacturing sector – high demand and input inflation – could have interesting implications for monetary policy easing. The move has already strengthened the dollar and reduced the probability of a rate cut in the derivatives market, indicating that financial conditions will remain tighter than expected. We believe that Rockwell Automation is currently undervalued in this macro scenario. The company is a high-leverage play on digitization and autonomous manufacturing and will benefit disproportionately if there is more capital expenditure on expanding manufacturing capacity without labor costs. Analysts should track new orders above 55 in the next reading and labor below that level to validate the thesis and should also look at book-to-bill ratios and margin increases in product segments and process automation demand. The digitization theme in industrials could decouple from manufacturing volatility if this trend holds.
Upcoming Economic Events
JOLTS Job Openings (January 2026)
This week, one of the most important labor market metrics will be in the spotlight: the JOLTS Job Openings report. As the debate about the direction of interest rates and the underlying economy continues, this important economic report will provide critical insight into the plans of businesses to meet future demand. Job openings are a forward-looking indicator of labor market conditions, and as inflation remains high in certain sectors of the economy, the Fed is extremely sensitive to changes in labor market conditions. This report has taken on added importance as it has come to be used as a proxy for wage pressure and employment strength.
- If the actual JOLTS figure beats the forecast and turns out to be higher, this would imply that the demand for workers is high despite the Fed’s hawkish policy decisions. This would most probably trigger another bond selloff, increasing bond yields, while also diminishing hopes for an imminent rate cut. Equity markets would most probably react differently to this scenario, with growth stocks being negatively affected by the rate increase, while companies that benefit from high consumer demand and pricing power could benefit from the scenario. This scenario would reinforce the view that the labor market is too hot to ease policy, despite the stabilization of manufacturing and housing markets.
- If the JOLTS figure turns out to be disappointing and falls below the forecast, this would most probably be seen as a validation of the view that hiring momentum is losing steam. This would most probably be seen as a dovish signal by the market, boosting risk assets with the hope of an early rate cut. However, investors would need to be cautious as the sharp decline in openings would most probably trigger fears of a demand cliff, especially if the figure is accompanied by an increase in continuing claims the following weeks.
Stock Market Performance
Indexes Continue to Build on April 2025 Low Recoveries, But Member-Level Losses Reveal Weak Spots in Markets
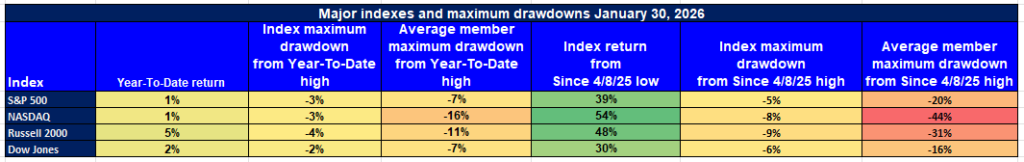
While stock market indexes have continued to build on their April 8, 2025, low recoveries, a look below the surface reveals a weak foundation for the market. Although all four US stock market indexes have a positive year-to-date performance through January 30, 2026, their average member drawdowns reveal a weak foundation for the market’s recent advances.
Our Latest Stock Market Performance Update:
S&P 500: Stable Index, Shaky Internals
YTD: +1% | +39% off April low | -3% from YTD high | Avg. member drawdown: -7%
While the S&P 500 has only fallen 3% from its 2026 high and 39% from its April 2025 low, its average member has fallen 7% from its 2026 high. This indicates that not all members of the S&P 500 have participated in its recent advances. In fact, its members have fallen 20% from their April 2025 low, indicating a weak foundation for its recent advances.
NASDAQ: Strong Recovery, Fragile Underbelly
YTD: +1% | +54% off April low | -3% from YTD high | Avg. member drawdown: -16%
The NASDAQ outperforms all major indexes since April by a whopping 54%. Still, average drawdowns for its members of 16% from the YTD high and a whopping -44% from the April low highlight the volatility in growth and tech stocks. This is a classic case where the index shines while its members are still reeling.
Russell 2000: Outperforming in Headline, Underperforming in Depth
YTD: +5% | +48% off April low | -4% from YTD high | Avg. member drawdown: -11%
The small-cap index has outperformed the S&P and Dow by a significant margin of 48% from its April low. Still, average drawdowns for its members since April stand at a whopping 31%. Even as it posts a respectable 5% YTD gain, volatility and rate risk continue to plague the small-cap sector.
Dow Jones: Most Stable, Least Exuberant
YTD: +2% | +30% off April low | -2% from YTD high | Avg. member drawdown: -7%
The Dow Jones has the shallowest drawdown and the least volatility for its members. Its defensiveness has protected it from the market volatility. Still, an average drawdown of 7% for its members since April highlights the stress in some of its members.
At Zaye Capital Markets, we continue to monitor structural breadth rather than index performance. Until we witness a significant improvement in breadth and average performance for the members of these indexes, we will maintain a watchful eye.
The Strongest Sector in All These Indices
Energy Outpaces All S&P 500 Sectors with Commanding YTD Lead
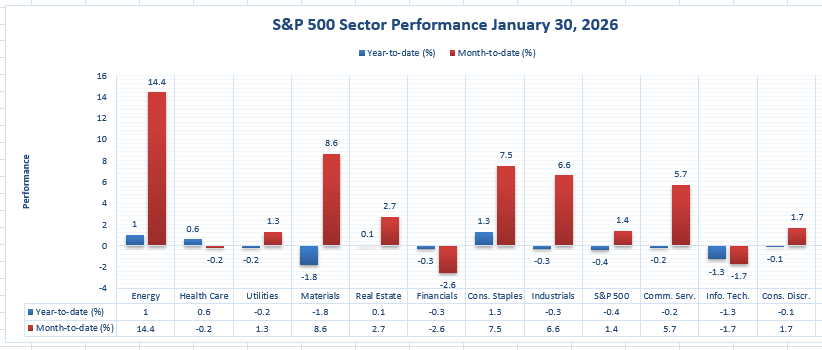
As of January 30, 2026, Energy stands out with a commanding lead over all S&P 500 sectors with a remarkable +14.4% year-to-date lead over all sectors. The S&P 500 has risen a mere +1.4% YTD, with Energy’s lead representing over ten times this S&P 500 average. What this represents is a strong shift into cash-generating businesses with a strong presence of real assets, given the current macroeconomic conditions of sticky inflation and geopolitical tensions.
Even with the latest stock performance over the course of the day, Energy has maintained a positive lead over all sectors with a +1.0% increase over the course of the day. This represents a strong indication that Energy’s lead is not a January phenomenon but a long-term positioning shift. What makes Energy’s lead so remarkable is the fact that this sector has maintained a strong pricing power during a macroeconomic environment that has been so volatile. In contrast, sectors such as Financials and Information Technology, which are rate-sensitive sectors, have a negative YTD return of -2.6% and -1.7%, respectively.
Utilities, which have historically been considered a defensive sector, have only managed to gain +1.3% YTD. Consumer Staples, another traditional safe haven sector, has performed even stronger at +7.5%, though this is still a long way behind Energy. Materials and Industrials have also performed strongly at +8.6% and +6.6%, respectively. However, neither of these sectors is close to challenging Energy’s supremacy. From our perspective at Zaye Capital Markets, this is simply a reversion to form by the resource sectors in a world where inflation protection, re-shoring of supply chains, and leveraging real assets continue to be attractive themes.
Earnings
Yesterday’s Earnings Recap (02-Feb-2026)
- Palantir Technologies Inc. reported an earnings per share (EPS) of $0.25, beating the forecasted $0.23 by +8.60%, signaling continued earnings strength across its defense and enterprise contracts. With a market capitalization of $352.18B, this result supports the firm’s positioning in AI and data analytics infrastructure. The beat confirms Palantir’s ability to convert growing demand into operational leverage and margin delivery.
- The Walt Disney Company (The) came in ahead of expectations as well, posting $1.63 EPS versus an estimate of $1.57, representing a +3.77% upside. Backed by a $185.23B market cap, the earnings surprise suggests solid performance in theme parks and incremental progress in streaming cost efficiency. Margin stability remains the key focus going forward, especially amid evolving media and content cost structures.
- NXP Semiconductors N.V. delivered $3.35 EPS, narrowly beating the expected $3.31 by +1.15%. At $58.16B in market cap, the result reinforces the company’s steady role in the global automotive and industrial chip supply chain. Despite softness in select hardware segments, core end markets like EV and factory automation contributed to solid profitability.
- Julius Baer Group Ltd. significantly outperformed with $2.89 EPS against a forecast of $2.33, producing a sharp +23.78% surprise. With a relatively smaller $17.38B valuation, this result speaks to efficient cost controls and steady asset management flows, even amid tighter global financial conditions. Margin resilience in wealth management was a standout.
- TDK Corp. posted a modest beat with $0.23 EPS versus expectations of $0.22, representing a +9.00% earnings surprise. With a $25.26B market cap, the company’s results reflect steady performance in passive components and specialty electronics, amid broader tech sector volatility. Pricing discipline and niche market strength remain key levers.
Today’s Earnings Preview (03-Feb-2026)
- PepsiCo, Inc. will report its latest results with markets watching pricing strategies and global volume trends. Investors expect the beverage and snack giant to reveal whether higher input costs are being offset by margin-preserving strategies. Attention will focus on organic revenue growth, foreign exchange effects, and forward guidance across North America and emerging markets.
- PayPal Holdings, Inc. is set to release its earnings amid growing scrutiny on user growth, take rate sustainability, and competitive pressures in the digital payments space. Analysts will closely monitor active accounts, transaction margin trends, and any shifts in buy-now-pay-later volumes. Performance in the small business segment and Venmo monetization updates will be key.
- Advanced Micro Devices, Inc. (AMD) enters the spotlight with high expectations for its data center and AI chip segments. Investors will be evaluating performance against Intel and Nvidia benchmarks, especially in hyperscaler server demand and enterprise GPU shipments. Margin trends, inventory levels, and forward guidance on MI300 ramps will dominate attention.
- Electronic Arts Inc. will post quarterly earnings with a sharp market focus on live services monetization, monthly active users, and upcoming release pipelines. Any commentary on engagement, subscription revenues, and esports performance could shift sentiment in an increasingly competitive gaming landscape.
- Merck & Company, Inc. is expected to reveal key pharmaceutical segment updates, including product mix performance and R&D spend allocation. Watch for developments in oncology and vaccine portfolios, along with margin outlook and any pipeline guidance for late-stage assets.
Stock Market Overview – Tuesday, 3 Feb 2026
The U.S. stock market has commenced the month of February on a positive note, with market participants absorbing fresh macro data, strong manufacturing data, and shifting trends in corporate earnings. The U.S. stock market has risen across the board on Monday after a recent rollercoaster ride. However, sectoral risks and precious metals are still a cause of concern for the market. This has resulted in a bifurcated market structure, where growth stocks and value stocks are responding differently to macroeconomic data. According to Zaye Capital Markets, the present market environment is cautiously constructive, with macro data driving the market.
Stock Prices
Economic Indicators and Market Developments
The positive news for the market has been the recent data released on the U.S. factory sector, which reported expansion for the first time in over a year. This has boosted the market, with the U.S. stock market rebounding on Monday. The positive news has been the strong earnings reported by key technology and industrial companies. Global market sentiment has been boosted due to the easing of the precious metals selloff, which has been a cause of concern for the market after the recent wild ride in the prices of precious metals. U.S.-India trade issues and the role of the Reserve Bank of India in the market are adding complexity to the market. The U.S. bond market has risen due to the strong economic environment, which is expected to delay the reduction in interest rates.
Latest Stock News
- Oracle $ORCL is planning a massive funding round, in which it plans to raise $20 billion through an ATM equity offering and another $30 billion in a one-time bond sale to fund the expansion of the cloud business. This will be required to support the massive contract with OpenAI, which involves $300 billion in server rental agreements.
- $SNOW has entered into a $200M+ multi-year partnership with OpenAI, where they will integrate OpenAI models into Snowflake Cortex AI on all major cloud platforms. This will unlock context-aware AI agent deployment for more than 12,600 enterprise customers. This deal will propel Snowflake further into the AI control of the enterprise.
- $HOOD is expanding its global footprint by introducing tax-advantaged ISAs in the UK. This will provide users with access to ~5,000 U.S. stocks and ADRs without any commission fees. There will also be a 0.1% fee on foreign exchange transactions and a 2% cash match on eligible contributions. Cathie Wood has added ~$35M of HOOD stock to her portfolio on Monday.
- $TSLA is expanding its Giga New York factory to 300MW of annual solar capacity. This will mean more solar panel production in-house. Additionally, SpaceX, a company founded by Elon Musk, has entered into a definitive agreement to acquire xAI. This will create a vertically integrated AI compute and space platform. Musk plans to send ~1 million tons of satellites into space every year. This will provide 100 GW – 1 TW of AI compute power every year. This infrastructure will surpass the power of Earth-based computer infrastructure.
- $SNDK is flying under the radar but becoming increasingly popular due to AI data surges and infrastructure builds.
- $GOOGL AI has achieved a breakthrough in sequencing animal genomes in days. This will help in the preservation of endangered species. For context, it took 13 years and $3B to sequence the human genome. This shows that Alphabet is expanding its AI footprint.
- $PLTR continues to dominate the AI industry. $PLTR guided for 61% revenue growth in 2026. This was significantly higher than the expected low 40s. U.S. commercial revenue increased by 137% YoY. $PLTR also added $1.6B in committed contracts via RPO within 90 days. This shows that $PLTR is becoming the bellwether for the enterprise AI industry.
- $INTC and SoftBank have formed a joint venture to speed up Z-Angle Memory (ZAM), a next-generation memory technology providing greater bandwidth and capacity along with lower power consumption.
The Magnificent Seven and the S&P 500

The Magnificent Seven – Apple, Microsoft, Nvidia, Amazon, Meta Platforms, Alphabet, and Tesla – are still adjusting after their strong performance in 2025. The combined stocks are down more than 18% since their highs and face pressure on margins, AI overextensions, and a cyclical shift in leadership. The worst performance has come from Tesla and Meta Platforms, but Alphabet’s AI wins and Microsoft’s cloud story help provide support. Until broadening participation and/or a return of tech leadership occur, the S&P 500 will remain at risk for a leadership fatigue and earnings sensitivity.
Major Index Performance as of Tuesday, 3 Feb 2026
- S&P 500 – Trading at ~6,976, up ~0.5%, boosted by tech and industrials sectors
- NASDAQ – Trading at ~23,592, up ~0.6%, boosted by semiconductors and AI stocks
- Dow Jones – Trading at ~49,408, up ~1.1%, boosted by cyclicals and defensives
- Russell 2000 – Trading at ~2,640, up ~1%, boosted by small-cap rotation
We at Zaye Capital Markets believe the markets are shifting – shifting from a mega-cap growth structure to a more cyclical and broad-based structure. The next significant drivers will be earnings quality and operating leverage and global rotation.
Gold Price: What Is Driving Gold Prices Amid Shutdown Risks, Iran Talks, and Job Data?
The spot gold price currently stands at $4,740 per ounce, a significant recovery from a recent dip below $4,700. From our perspective at Zaye Capital Markets, this represents a strategic re-pricing of risk as a result of recent events both domestically and abroad. While President Trump’s announcement that a shutdown deal is imminent, coupled with his direct appeal to lawmakers to pass a spending bill without changes, has certainly alleviated some short-term concerns regarding a shutdown, it has not alleviated them entirely. In addition, as a strategic play to break China’s grip on rare earth minerals production, a U.S. critical minerals reserve has been proposed. At the same time, as a means of reducing tensions between nations, direct talks regarding nuclear and trade issues with Iran have been initiated from the White House. Today’s release of JOLTS job openings data will prove critical as a means of determining whether gold’s recent advance will continue if job openings come in hotter than expected, or if they come in softer than expected. The gold market has evolved beyond considerations of rate cuts and inflation. Today, it’s deeply tied with considerations of critical minerals and supply chain realignment.
The positive surprise in the ISM Manufacturing PMI report, where the index rose above its 2022 level, caused a positive reaction in the equity markets and put upward pressure on safe-haven assets in the short term. However, from our perspective, this has not changed the fundamental picture that supports the long-term bullish case for the price of gold. As the price of the precious metal remains above $4,700, it is our belief that the price is being influenced by what we call a triple convergence of factors, which include the hedging of geopolitical risks, the nationalization of the precious metal through the expansion of the nation’s strategic reserves, and the investment in the precious metal as a store of value in the face of yield curve uncertainty. As can be seen from the above, the market is no longer concerned with the short-term pullbacks in the price of the precious metal, as the long-term focus is centered around the preservation of capital through the investment in asset classes that are not subject to the risks of fiat currency devaluation and the risks associated with the nation’s foreign policy and the labor market. As can be seen from the above, at Zaye Capital Markets, we believe that the nationalization of the precious metal, as evidenced through the mineral reserve initiative, will continue to support the price of the precious metal as long as the issues of fiscal discord, foreign policy, and the labor market are left unresolved.
Oil Prices: What’s Fueling Oil Price Volatility Amid Iran Talks, Fed Watch, and Job Data?
The current West Texas Intermediate (WTI) oil prices are hovering around $61.90 per barrel, while Brent oil prices are hovering around $66 per barrel. This is a pullback in oil prices after the recent rally. At Zaye Capital Markets, we are monitoring the market momentum that is shifting from fear to fundamentals. The announcements made by President Trump regarding the continuation of the U.S.-Iran nuclear and trade talks have reduced the U.S.-Gulf tensions premium significantly. The de-escalation of tensions in the region, along with the U.S. administration’s broader strategy for stability in the region, including trade concessions for India and the continuation of the U.S.-Venezuela dialogue, has resulted in the unwinding of the oil rally. The announcement made by the U.S. government regarding the establishment of a critical minerals reserve strategy for rare earth has resulted in the unwinding of the oil prices. Furthermore, the OPEC update has indicated that no new production cuts are planned until March. Moreover, the International Energy Agency (IEA) has indicated that the global oil supply is higher than the demand. The reason for the higher oil prices is the high inventory in Asia and Europe. All these factors indicate a market that is shifting from a world in which shocks dominate the news to a world in which the news is dominated by diplomats.
Economic indicators are also shifting the balance. Yesterday’s ISM Manufacturing PMI beat, which saw the indicator return to expansion territory, boosted sentiment towards US industrial demand. However, the effect was insufficient to counteract the bearish energy contributed by the easing geopolitical tensions. The sentiment towards crude oil demand is still heavily influenced by economic indicators such as the JOLTS Job Openings reported today. If the numbers are high, oil demand will be boosted, potentially lifting oil prices. On the other hand, if the numbers are low, oil will fall further. The problem is compounded by the rising US dollar, which is being fueled by the Fed’s statements and yesterday’s manufacturing resilience. The rising US dollar is making oil more expensive for international buyers. The sentiment towards crude oil demand was reported by Walter Bloomberg, with commentary by ZeroHedge stating that large money managers are waiting for the right catalyst before entering the market. In conclusion, we at Zaye Capital Markets are bearish on oil. In the absence of a shift in Iran’s negotiations or an unexpected production cut by OPEC, oil will remain rangebound within the $60-$65 range throughout the month.
Bitcoin Prices: Why Is Bitcoin Falling Amid Fed Uncertainty, Shutdown Politics, and Volatility?
As of now, the price of Bitcoin stands at around $77,000. However, it has fallen below $75,000 earlier this week due to a broad-based deleveraging event that has been witnessed in the crypto markets, just like other global markets. This has been confirmed by market data that suggests billions of dollars in forced liquidations, especially of positions that were overleveraged in Asia and Europe. Moreover, the exchange-traded funds that track Bitcoin have also shown that there was a continuation of outflows. According to analysts, the sell-off that was witnessed on February 2nd was a major inflection point because Bitcoin failed to act as a hedge and instead mirrored the action of high-beta stocks. According to Zaye Capital Markets, the reason for this sell-off in Bitcoin was the sharp increase in macroeconomic uncertainty that was driven by monetary policy direction, labor market strength, and global liquidity conditions. Moreover, the fact that Bitcoin was unable to hold above key support levels also points to the fact that it depends on sentiment. However, when the Asian sessions began thinning and whales began exiting their positions, this led to a cascade of algorithmic selling that resulted in a sharp intraday volatility. This caused Bitcoin to fall to multi-month lows before it began to recover.
Adding to these pressures, however, was a macro environment influenced by Trump’s renewed political urgency, such as comments that Congress is near a resolution on a shutdown, as well as the administration’s shift in diplomatic policy towards Iran. These factors served to reduce short-term geopolitical premiums, thus undermining Bitcoin’s fear hedge appeal. Moreover, yesterday’s ISM Manufacturing PMI outperformance served to reinforce growth resiliency, thus prolonging the anticipation of imminent Fed rate cuts, which will continue to tighten digital asset prices. Today’s release of JOLTS Job Openings will also introduce a directional risk factor, where a strong print will likely drive real yields and thus Bitcoin prices down, while a weak print will slow dollar strength, providing breathing room for digital asset prices. What is important to understand, however, is that Bitcoin is currently a liquidity barometer, not a macro hedge, thus continuing to exhibit high sensitivity to movements in Treasury yields. As such, as investors become accustomed to re-coupling Bitcoin prices with more traditional asset classes, Zaye Capital Markets recommends that investors track macro yields, contract expiries, as well as ETF redemption flows as key indicators for Bitcoin’s price stability as we head into mid-February.
ETH Prices: Why Is Ethereum Dipping as ETF Outflows Increase and Whale Transactions Spark Interest?
Currently, Ethereum (ETH) is trading at $2,332.83, as live data from TradingView confirms for February 3, 2026. The cryptocurrency has significantly dropped from its highs of above $3,400 in January, losing more than 30% in two weeks. The decline accelerated as Ethereum dropped support at $2,600-$2,500. It is now trading in an oversold region. The sentiment for Ethereum is negative, with $308 million in Ethereum ETF outflows this week alone. This is an indication of significant outflows from ETFs such as BlackRock’s ETHA. Additionally, $1.7 billion in redemptions have been recorded for other cryptocurrency funds. At Zaye Capital Markets, we have observed this is not limited to prices, as billions have been lost in liquidations of long positions, placing Ethereum in a leveraged flush similar to last year’s 2022-style flush. Traders have observed an uptick in correlation between Ethereum and tech stocks, indicating Ethereum is behaving more like a tech stock than ever before.
However, at the same time, whales’ behavior is changing, as several large wallets have been accumulating ETH around this price range of $2,200 to $2,300, indicating their belief in the long-term value of ETH, but at the same time, there is reason for concern, as one whale has been moving 85,000 ETH to an exchange, valued at more than $200 million, indicating that this whale is selling, creating fears of an impending liquidation event for this whale.
Additionally, the better-than-expected ISM Manufacturing PMI report released yesterday, coupled with the JOLTS Job Openings report released today, is creating more uncertainty for the market, indicating that the Fed might not cut rates anytime soon, thereby driving real rates even higher, creating more liquidity problems for speculative assets like ETH, as institutional players are moving out of this market, while whales’ behavior is mixed, indicating that ETH is having problems moving beyond $2,500 unless the overall macro environment changes to more dovish levels or ETF inflows pick up, at which point ETH can start moving beyond $2,500. At Zaye Capital Markets, we are keeping an eye on whales’ movement, ETF stabilizations, as well as the ETH/BTC ratio to determine whether ETH is bottoming or merely looking for another leg down.
