Where Are Markets Today?
European and United States stock market futures edged higher on Friday morning, 13th March 2026. This came as a surprise to investors as the market was bracing for key inflation data. Additionally, the market was also concerned about the impact that the latest surge in energy prices has had on the market. United States stock market futures tied to the Dow Jones Industrial Average rose by 0.32%, or 149 points. On the other hand, S&P 500 stock market futures rose by 0.25%, while Nasdaq 100 stock market futures rose by 0.12%. This came on the back of a tough trading session on Thursday that saw equities around the globe decline sharply. On Thursday, the Dow Jones Industrial Average dropped by close to 740 points. This saw the Dow Jones Industrial Average close below the 47,000 level for the first time this year. In addition to that, the S&P 500 dropped by 1.5% on Thursday. This came amid investor concerns over inflation risks and geopolitical tensions.
One major reason for the stabilization of the markets is that the Personal Consumption Expenditures (PCE) price index is going to be announced shortly. This index is considered the most closely watched inflation indicator used by the government to assess price stability in the market. According to market consensus, the headline PCE inflation is expected to increase by 0.3% on a month-to-month basis and by 2.9% on a yearly basis. On the other hand, core PCE inflation is expected to increase by 0.4% on a month-to-month basis and by 3.1% on a yearly basis. Inflation data is a major factor that influences interest rates; hence, investors are adjusting their portfolios carefully before the data is announced. If the inflation data is reported higher than expected, it may be taken as a sign that interest rates will remain high for a longer period of time, which may negatively affect stock market valuations. On the other hand, if the inflation data is lower than expected, it may revive hopes that financial conditions may ease up over time, which may be beneficial for the market. Another major reason for market sentiment is the surge in oil prices due to increasing geopolitical tensions worldwide. The energy market has increased sharply on reports that the Strait of Hormuz will remain closed. This Strait is one of the most important oil shipping lanes in the world. In the last session, West Texas Intermediate oil closed at $95.73 per barrel, while Brent oil closed at $100.46 per barrel. This is the first time that Brent has closed above $100 since August 2022. The increase in oil prices has increased concerns that inflation may pick up again due to increasing transportation and manufacturing costs. This is a major reason for market movements that is affecting both the stock market and the economy.
We, at Zaye Capital Markets, believe that the current market situation represents a complex balance of cautious optimism and underlying macro-economic risk. Investors are trying to stabilize the portfolios after the latest volatility, but the sentiment is still soft as traders are trying to balance the latest inflation numbers with the latest developments from the energy sector around the globe. However, if the energy sector continues to trade at higher levels for the next few months, the spillover effects can have a significant impact on the economy. For now, the minor increase in the futures indicates that investors are positioning for a volatile trading session, with the inflation numbers, energy sector, and geopolitical events dictating the short-term path for the global equity markets.
Major Index Performance as of Friday, 13 Mar 2026
- S&P 500: Trading at 6,672.62, down 1.5%, reflecting pressure from technology stocks and geopolitical concerns.
- Nasdaq Composite: Trading at 22,311.98, down 1.8%, as mega-cap technology names face selling pressure.
- Dow Jones Industrial Average: Trading at 46,677.85, down 1.6%, with weakness across industrial and financial sectors.
- Russell 2000: Trading at 2,488.99, down 2.1%, reflecting volatility among smaller companies sensitive to economic conditions.
The Magnificent Seven & S&P 500
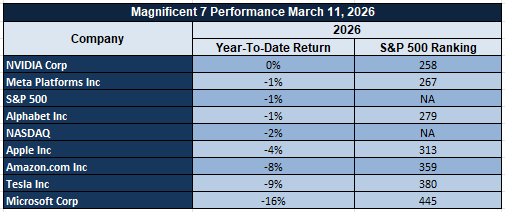
The ‘Magnificent Seven’ group of Apple, Microsoft, Nvidia, Amazon, Meta, Alphabet, and Tesla continue to dominate the S&P 500 movement in terms of direction. These companies have generated a disproportionate contribution of gains in the S&P 500 over the last one year, indicating that any weakness in these companies is likely to affect the overall market movement. Recently, these stocks have witnessed selling pressure owing to their valuations, increased interest rates, and profit-taking after a strong rally in these stocks. These companies are major contributors to the S&P 500 movement, and their performance is likely to decide whether the S&P 500 moves up or not until other companies also join this group of mega-cap technology companies. Until then, market movement is likely to be sensitive to these stocks.
Drivers Behind the Market Move – Friday, March 13, 2026
The US and European markets are witnessing another volatile session of trade, and investors are trying to navigate through a complex mix of geopolitical issues, increasing energy costs, and some very important economic data releases that are scheduled for today. The markets are very sensitive to changes in risk sentiment that have been generated in recent days due to an increase in crude oil prices and escalating geopolitical issues in the Middle East region. In addition, some very important economic data releases are scheduled for today, which are likely to affect investor sentiment regarding inflation and monetary policy issues.
- Geopolitical Tensions and Energy Market Disruptions
Geopolitical issues involving Iran are once again dominating market sentiment, and recent developments involving Iran have increased investor concerns over issues of nuclear weapons development in that country. Recent announcements that highlight the need for ensuring that Iran is not allowed to procure nuclear weapons, coupled with military operations against Iranian missile and naval sites, have increased investor concerns over issues of stability in the Middle East region. The increasing tension between Iran and other major Middle East nations has increased investor concerns over issues of stability in the Middle East region, which is home to some of the most important shipping routes in the world, including the Strait of Hormuz. The recent increase in tension between Iran and other Middle East nations has already led to a sharp increase in crude oil prices, which is likely to increase energy costs in the overall global economy. Increasing energy costs are likely to increase the cost of doing business for companies, which could negatively impact investor sentiment if energy costs remain higher over a period of time. The recent increase in crude oil prices is likely to be a short-term issue, and policymakers are of the view that temporary waivers for shipping through the Strait of Hormuz would be granted.
2. Inflation Expectations & Important Economic Data to be Released
Another important factor contributing to the current market movements is the release of important economic indicators that will shed more light on the inflation rate. Investors are awaiting the release of the Personal Consumption Expenditures Price Index, considered the most important inflation gauge. This index is considered the most important inflation gauge used by the U.S. government to assess the rate of inflation. Together with the inflation rate release, other important economic indicators such as preliminary Gross Domestic Product data, durable goods orders, job openings data, consumer sentiment, inflation expectations, etc. are to be released. This information is important to gauge the health of the overall economy. Stronger-than-expected data may fuel concerns over inflation lingering in the economy, which could extend the timeline for rate cuts and weigh on stocks. On the other hand, softer data may fuel bets on a slowdown in the overall economy, which could boost the case for rate cuts.
3. Policy Messaging & Efforts to Stabilize the Energy Markets
Policy signals emanating from Washington are also currently affecting investor sentiment and market positioning. This is in part because officials have recognized that increased oil prices will result in increased revenues for domestic oil producers, while at the same time emphasizing that the current energy shock is a temporary phenomenon. In light of the recent rise in oil prices, officials are considering a number of measures, such as limited shipping waivers and adjustments in existing energy transportation regulation, in order to stabilize oil supplies. At the same time, officials are making statements aimed at reassuring markets that supply chain disruptions will not result in a structural change in oil supplies. This is aimed at striking a delicate balance between geopolitics and economic policies. For investors, a mix of factors, including policy signals, geopolitical events, and oil price volatility, is currently affecting their perceptions of inflation and economic growth, which explains the cautious market sentiment currently dominating U.S. and European markets.
To recap, markets are currently being influenced by three factors: geopolitical tensions related to energy supplies, important economic data that will inform inflationary expectations, and policy actions aimed at normalizing markets. These factors are creating a cautious investor sentiment, where traders are seeking to gauge whether recent market volatility is a blip or a sign of a larger shift in overall global market dynamics.
Digesting Economic Data
The Trump Tweets and Its Implications
Recent comments from the White House highlight a complex policy environment where energy markets, geopolitical strategy, and domestic political initiatives are intersecting. Statements suggesting that higher oil prices translate into greater national profitability signal a strategic framing of energy economics within the broader geopolitical context. At the same time, policy discussions around potential Jones Act waivers, temporary allowances for certain sanctioned oil shipments, and efforts to calm energy markets indicate that authorities are attempting to manage short-term supply disruptions while preventing sustained price shocks. From a market perspective, these messages send mixed signals: on one hand, higher oil prices can benefit domestic producers and energy-linked revenues, while on the other hand policymakers are clearly concerned about inflationary pressures and transportation costs that can ripple through the broader economy.
Geopolitical messaging surrounding Iran also carries direct implications for global risk sentiment. The emphasis on preventing Iran from acquiring nuclear capabilities and the reference to military operations targeting ballistic missile and naval capabilities reinforce an environment where geopolitical tensions remain elevated. For financial markets, such developments tend to amplify volatility across energy commodities, safe-haven assets, and risk-sensitive sectors. When geopolitical uncertainty rises, investors often shift capital toward defensive assets such as gold or government bonds while energy markets react quickly to perceived threats to supply routes. The commentary about energy disruptions being short-term appears aimed at stabilizing expectations and preventing sustained panic across commodity markets.
Beyond energy and geopolitical issues, several statements highlight domestic policy priorities including election security, voter identification measures, and legislative initiatives such as the proposed Save America Act. Although these developments are primarily political, they can influence market psychology by shaping expectations around regulatory direction, fiscal priorities, and institutional stability. Markets typically respond not only to economic data but also to the perceived durability of governance frameworks. Policy debates related to election systems and legislative reforms therefore play a subtle role in shaping long-term investor confidence and capital allocation decisions.
Finally, the administration’s broader messaging also includes softer diplomatic and social themes, such as preparations for the 2026 World Cup and recognition of Women’s History Month. While these announcements may appear symbolic, they contribute to the overall narrative of political stability and international engagement. Major global events like the World Cup can have economic spillover effects through tourism, infrastructure investment, and global media exposure. In aggregate, the latest series of statements reflects an administration attempting to balance geopolitical firmness, economic reassurance, and domestic political messaging—an approach that markets will continue to interpret through the lens of energy prices, inflation expectations, and geopolitical risk dynamics.
Housing Starts Surge While Permits Fall, Signaling Possible Construction Slowdown
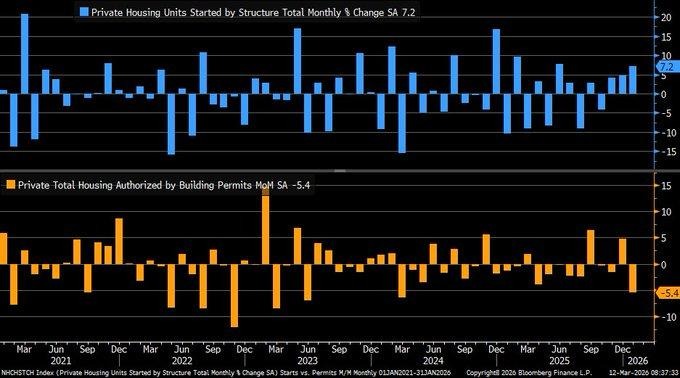
Recent data from the housing sector has shown some interesting trends between housing starts and building permits issued. This data is crucial to understanding the future direction of this sector. In the latest data available, housing starts rose by 7.2 percent month over month. This increase is a continuation of the 4.8 percent increase seen in the last reporting period. On the other hand, building permits issued were down 5.4 percent in the latest data available. This is a reversal from the 4.8 percent increase seen in the last reporting period and is the largest decrease seen in about a year. From our perspective at Zaye Capital Markets, this data indicates that builders are completing projects that were previously permitted while becoming increasingly cautious about initiating new projects to seek building permits for housing developments.
This is particularly interesting given that building permits tend to lead housing starts by about six to nine months. As such, this decrease in building permits could be a harbinger for a slowdown in housing starts later in the year. What is particularly interesting is that builders are likely attempting to address a difficult affordability environment in which interest rates are high and consumers are paying more to finance a home. With mortgage rates currently in the mid-six percent range, consumers are being squeezed by high interest expenses on a mortgage. As such, builders are likely attempting to complete projects that were previously permitted while becoming increasingly cautious about initiating new projects to seek building permits until such time as interest rates and consumer demand improve.
In this environment, D.R. Horton Inc. (DHI), in particular, looks undervalued in relation to the broader housing sector outlook. It should be noted that DHI is one of the biggest residential homebuilders with a diverse geographic presence and scalable building operations. Hence, the company would be able to benefit from the completion of existing housing projects and at the same time have flexibility in new project starts. Analysts should monitor forward-looking indicators such as mortgage rate movements, new building permits, housing inventory levels, and household formations in order to understand whether the recent divergence in starts and permits will lead to a broader construction decline. If mortgage rates stabilize or decline gradually, large homebuilders with efficient building operations would benefit disproportionately from the next recovery phase in residential construction.
Trade Deficit Narrows Sharply As Exports Surge And Imports Decline
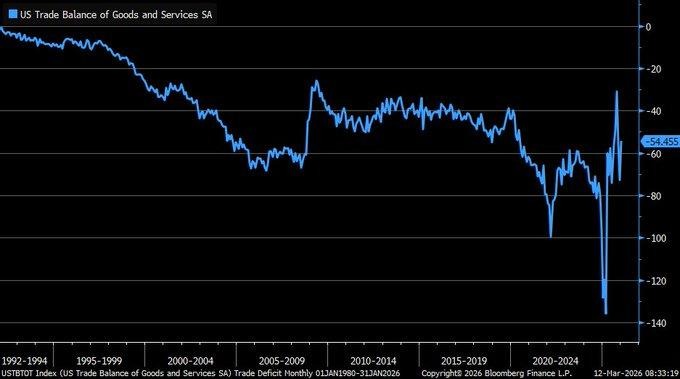
Recent trade data indicates a significant shift in the pattern of international trade as the trade deficit narrows significantly to $54.5 billion during the latest reporting period. This is significantly lower than the market expectation of $66 billion and is a considerable improvement from the revised $72.9 billion trade deficit recorded during the previous period. The trade deficit narrowed significantly due to a 0.7 percent decline in imports and a strong 5.5 percent rise in exports. This indicates that the demand for domestically produced exports rose during the latest month. At Zaye Capital Markets, we see this as a significant short-term development in the context of a much larger and longer-term trend in international trade.
A look at the historical data on trade balances indicates that the trade deficit has risen significantly over the last several decades. The latest development is a rare favorable deviation from the long-term trend. However, the latest trade data indicates that the trade deficit may have narrowed due to trade policy uncertainty. When trade policy uncertainty increases, businesses respond by accelerating or delaying trade in an effort to avoid exposure to tariffs. This causes a spike in exports and a decline in imports on a monthly basis. However, the long-term trend in international trade flows remains unchanged.
In this context, we believe that the company Caterpillar Inc. (CAT) is currently undervalued in relation to the potential increase in global export activity. As a leading manufacturer of construction equipment, mining machinery, and industrial engines, the company would directly benefit from an increase in global infrastructure investment and commodity production. An increase in export demand for heavy machinery would likely be a precursor to a rise in investment in mining, energy, and infrastructure projects in emerging and developed economies. Analysts must keep a watch on export activity trends, global orders for manufacturing, investment in infrastructure, and shipping activity in major global trade routes to gauge if the recent improvement in the trade balance is a precursor to a broader improvement in industrial activity. If export activity is sustained, globally diversified industrial manufacturers with high exposure to export sales could benefit from a potential increase in valuation.
Jobless Claims Dip Once More, Suggesting Ongoing Stability in the Labor Market
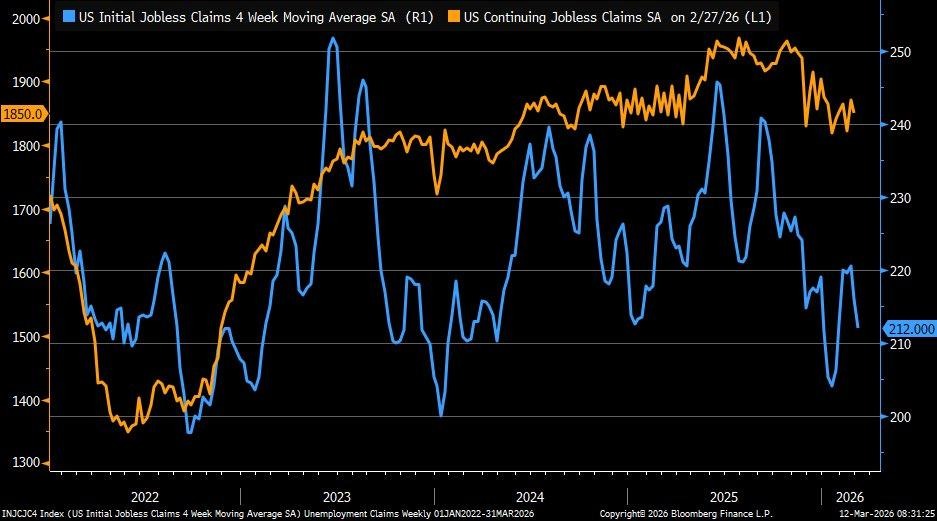
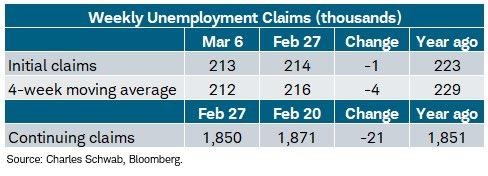
The latest round of labor market data revealed that initial jobless claims came in lower at 213,000 for the week ending March 7. This is a better-than-forecast figure considering that economists were expecting a 215,000 reading and a 214,000 print from the previous week. From our perspective at Zaye Capital Markets, the ongoing trend of declining jobless claims is a testament to the ongoing stability in the labor market despite the ongoing economic uncertainties brought about by the impact of interest rates, the changing global trade landscape, and the high operating expenses of several sectors. A stable labor market often bodes well for the overall economy because a segment of the population with a stable job market is likely to maintain consumption levels in areas such as retail products, housing services, transportation services, and leisure services.
In this regard, it is noteworthy that the four-week average of jobless claims has now dropped to 212,000, which is a record low since late 2023. The average is a more reliable indicator of employment market trends as it smoothens out fluctuations in jobless claims. In addition, continuing jobless claims have also dropped to 1.85 million. This is a sign that workers are able to secure employment more quickly compared to 1.851 million reported during the same period last year. These indicators are a testament to the fact that demand for labor is robust at most industries. However, it is noteworthy that different states reported different employment market trends. In some states, employment markets improved significantly, while others reported only marginal increases in unemployment claims.
In this backdrop, it is of particular importance that we now analyze the stock of Walmart Inc. (WMT) as it is believed that within a scenario of stable employment markets, this particular stock is undervalued as it is a major player in the retail sector that is more likely to be positively impacted by stable employment markets as it has a larger footprint compared to other retailers. The company has a robust pricing strategy that is likely to help it during a period when employment markets are stable. In this regard, it is important that analysts track employment market indicators like wage growth patterns, consumer spending patterns, retail sales data, and jobless claims to ascertain whether employment markets are likely to remain stable. In case employment markets remain stable, retailers like Walmart Inc. are likely to report stable revenue growth patterns despite a scenario of economic uncertainty.
Misery Index Ticks Higher But Remains Historically Low, Signaling Stability in the Economy
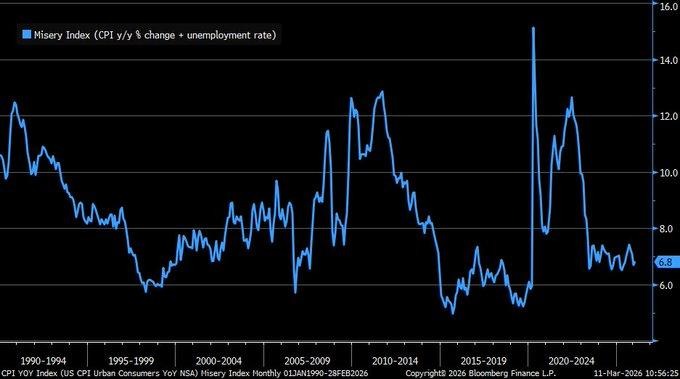
The latest available data on the economy has shown a slight increase in the Misery Index, reaching 6.8 percent in February after experiencing an unforeseen decline in 92,000 non-farm payroll jobs. This index is based on a combination of inflation and the unemployment rate, two of the most significant factors affecting the economy. As the inflation rate is currently at 2.4 percent, and the unemployment rate is at 4.4 percent, the latest data on the Misery Index shows that the economy is experiencing a slight decline in the job market. However, from a macroeconomic standpoint, Zaye Capital Markets believes that the latest data on the Misery Index is historically low, considering previous periods in the economy.
The data available on the Misery Index over the past several decades has shown a historical high in the range of 14 percent during periods of high inflation and a decline in the job market. This has been evident in previous decades, including the early 1990s and during the period of high inflation in the early part of this decade. However, with the latest data on the Misery Index showing a slight increase to 6.8 percent, it is clear that although certain factors in the job market are experiencing a decline, the overall economy is showing a high degree of stability. A slight increase in the Misery Index is a clear indication that the economy is entering a new phase, and inflation is under control. As the inflation rate is currently at 2.4 percent, and the unemployment rate is at 4.4 percent, it is clear that the purchasing power of the average American is slightly affected but has not declined to a level where a significant decline in investment is taking place.
In this backdrop, we are of the view that Procter & Gamble Co. (PG) is a stock that is trading at a discount compared to the prevailing macroeconomic backdrop. The company is a global producer of consumer goods, focusing on day-to-day household and personal care products. The nature of the products ensures that the company generates a consistent level of revenue despite fluctuations in the economy. Products like hygienic items, cleaning agents, and day-to-day consumables are sold in consistent quantities irrespective of a dip in the economy. Analysts are advised to track wage growth, levels of consumer confidence, inflation, and employment rates to understand whether the Misery Index is sustaining a growth trajectory or is plateauing. In case inflation is kept in check and unemployment levels stabilize, stocks from the defensive segment of the market could be a good opportunity for investors.
Economic Pressures Cause Layoffs as a Form of Hiring Intentions
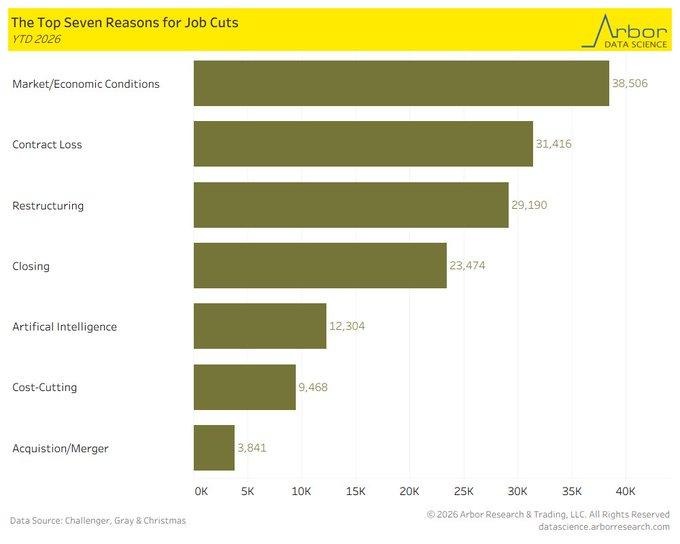
Recent employment data indicates a significant change in the decisions made by companies regarding their workforce, as market and economic pressures have become a major cause of layoffs during the early part of 2026. The year-to-date layoffs due to market and economic pressures have surpassed the layoffs due to contracts, with approximately 38,506 layoffs compared to approximately 31,416 layoffs due to contracts, and are much higher than the layoffs due to the adoption of automation and artificial intelligence. From our perspective as a market analysis firm, it is evident that companies are responding to changing economic expectations and pressures rather than technological changes.
On the other hand, the month-over-month layoffs have significantly decreased, with approximately 48,307 layoffs reported in February compared to approximately 108,435 layoffs reported during the preceding month. Although it may seem from the data that labor market conditions are improving, a further analysis of the data reveals that the labor market is actually a complex phenomenon. During the most recent month, layoffs have decreased, while hiring intentions have fallen by approximately 56 percent year-to-date. A decline in both layoffs and hiring is a significant phenomenon, as it indicates that the overall corporate environment is cautious and that companies are trying to maintain existing workforce structures rather than hiring new people.
In such a backdrop, it is our view that the company, i.e., Accenture plc (ACN), is currently trading at a discount compared to the changing corporate landscape. The company is a global consulting and technology services company that helps clients leverage information technology for digital transformation, operational excellence, and enterprise restructuring strategies. Therefore, it is a good idea for investors to invest in the company as a hedge against a backdrop of a changing corporate landscape, where companies are focusing more and more on cost optimization and productivity enhancements. Analysts need to track the capital spending plans of companies, technology spending trends for companies, productivity, and hiring plans for companies, as it will give a clear indication of whether companies are shifting towards a cost optimization strategy.
Real Wage Growth Slows, Signaling Softer Consumer Momentum Ahead
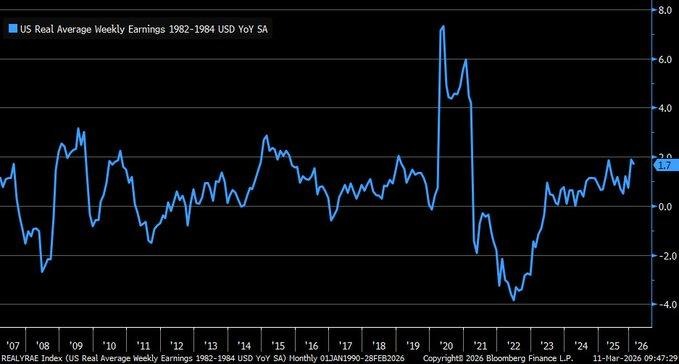
Recent labor market data revealed that real average weekly earnings rose by 1.7 percent on a year-over-year basis in February. However, the recent data revealed a slowdown from the higher rates recorded earlier in the year. The main cause of the slowdown is the 1.4 percent increase in hourly earnings and the stability of work week hours. From our perspective at Zaye Capital Markets, the recent slowdown in real average weekly earnings provides us with a critical sign regarding the balance between the strength of the labor market and the stability of the overall economy. It is a critical sign when the labor market starts to slow down along with the stability of employment. It means that the demand for labor is strong but no longer accelerating at a speed that may cause inflationary pressures to build up in the market.
The recent slowdown in real average weekly earnings may have critical impacts on the momentum of the overall consumer market. Wage growth is the primary engine of consumption. It impacts the way in which consumers spend money in the retail market, housing market, transportation market, and service market. Economic studies revealed that when the real average weekly earnings growth falls below 2 percent, the overall consumption growth may slow down. Although the recent data revealed a slower growth in average earnings, the rates are still favorable for workers. However, the slowdown may cause a gradual slowdown in the market as the overall economy may try to cool down after the strong recovery recorded over the last year.
In this context, the firm that we think is undervalued in relation to the changing landscape of consumers is the Costco Wholesale Corporation (COST). This is because the firm is a large-scale retailer that operates on a membership basis and deals in essential products. It is likely to thrive during a time when consumers become more price-conscious. It is able to offer discounts on purchases through economies of scale and operates on relatively lower margins. Analysts need to look out for a number of key metrics that are likely to affect the firm in the future. These include the levels of consumer spend, retail sales growth rates, wage growth rates, and the levels of savings. Analysts need to look out for a time when the easing of real wage growth might start to impact the larger landscape of consumption. However, when the easing of wage growth continues and employment levels remain stable, the firm may benefit from the changing landscape.
Upcoming Economic Events
GBP GDP m/m, Core PCE Price Index m/m, Prelim GDP q/q, Core Durable Goods Orders m/m, Durable Goods Orders m/m, Prelim GDP Price Index q/q, JOLTS Job Openings, Prelim UoM Consumer Sentiment, Prelim UoM Inflation Expectations
As the world’s financial markets await the latest slew of economic announcements, investors will be keeping an eye on various economic indicators that will be released. This will include economic growth rates, inflation rates, labor market conditions, and consumer sentiment. From an investment perspective at Zaye Capital Markets, the aforementioned announcements will be important as they will shed light on the state of the balance between economic growth and inflation. A positive announcement will be seen as an increase in economic confidence; however, it will also be perceived as an increase in the risk of interest rates remaining higher for longer. Conversely, an announcement that misses expectations will be seen as an indication of the economy cooling off and could potentially impact interest rates being lowered sooner rather than later.
GBP GDP m/m
The monthly Gross Domestic Product announcement for the United Kingdom will be an important announcement as it will shed light on the short-term economic activity within the service sector, manufacturing sector, and the construction sector.
- If the actual Gross Domestic Product comes in higher than forecast, it will be an indication of an improving economy and an increase in economic expansion. This will likely be positive for the British Pound and various stocks that track the aforementioned sectors.
- However, it will also be perceived as an increase in the risk of interest rates remaining higher for longer. Conversely, if the Gross Domestic Product comes in below forecast, it will be an indication that the British economy is slowing down.
Core PCE Price Index m/m
The Core Personal Consumption Expenditures Price Index is one of the most closely watched inflation data releases as it reflects the underlying inflationary pressure within the US economy.
- In case this data release comes out higher than expected, it could be a sign that inflationary pressures are still lingering within the US economy. In this case, investors may expect that the Federal Reserve will be more careful in reducing interest rates. As a result of this, bond yields could increase while other sectors such as housing and technology could become more volatile.
- However, if this data release comes out lower than expected, it could be a sign that inflationary pressures are easing off within the US market. In this case, the equity market could become more positive as investors expect that economic policies could become more favorable for economic growth within the country.
Preliminary GDP q/q
The preliminary gross domestic product data release reflects economic expansion within the US market as it covers various aspects such as consumer spending, government spending, as well as business spending.
- In case this data release comes out higher than expected, it could be a sign that economic growth is expanding within the US market. In this case, the equity market could become more positive as it reflects economic growth within various sectors of the market.
- However, if this data release comes out lower than expected, it could be a sign that economic growth is slowing down within the US market. In this case, investors could expect that economic policies will become more favorable for economic growth within the country.
Core Durable Goods Orders m/m
The core durable goods orders data measures business investment in long-lasting capital items, excluding transportation items. This data is highly correlated with corporate sentiment and capital investment plans.
- If the data is stronger than expectations, it would be a clear indication that businesses are still confident enough to invest in capital items. This would be a very positive move for industrial and manufacturing stocks, and would further support the outlook for economic growth.
- On the other hand, if the data is weaker than expectations, it would be a clear indication that businesses are becoming cautious about capital investment, possibly due to uncertainties in demand conditions.
Durable Goods Orders m/m
The durable goods orders data measures orders for long-lasting manufactured products, including transportation items.
- If the data is stronger than expectations, it would be a clear indication that businesses and consumers are becoming more confident in the outlook for the economy. This would be a very positive move for manufacturing stocks, and would further support the outlook for economic growth.
- On the other hand, if the data is weaker than expectations, it would be a clear indication that businesses and consumers are becoming less confident in the outlook for the economy. This would be a negative move for the economy and would be a clear indication that businesses are becoming cautious about investments.
Preliminary GDP Price Index q/q
The GDP price index tracks inflation in all domestically produced goods and services in the economy.
- If the actual reading exceeds the expected reading, it would imply that inflation pressures are embedded in the overall economic landscape. This reading may support the notion that policymakers are remaining cautious in loosening monetary policy. Higher inflation readings have a tendency to impact bonds and currency as investors react to interest rate projections.
- If the reading falls below the expected reading, it would imply that inflation pressures in the overall economy are easing. This reading may support risk assets as investors become more confident that inflation pressures are stabilizing without the need for policymakers to implement further restrictive measures.
JOLTS Job Openings
The Job Openings and Labor Turnover Survey tracks labor demand by measuring available labor across industries in the overall economy.
- If the reading of available labor exceeds the expected reading, it would imply that labor demand remains strong in the overall economy. While a strong reading in available labor would support consumer spending prospects, it may also imply that labor demand may remain strong and sustain labor costs.
- If the reading falls below the expected reading, it would imply that labor demand in the overall economy may be weakening. This may impact investor perceptions of economic growth.
Preliminary UoM Consumer Sentiment
Consumer sentiment tracks the attitudes of consumers regarding the overall economy, labor market, and financial market conditions.
- If the reading of consumer sentiment exceeds the expected reading, it would imply that consumers remain positive regarding future economic conditions. Strong consumer sentiment would support retail spending, travel, housing, and service sector activity.
- If the reading falls below the expected reading, it would imply that consumers are becoming more cautious regarding future economic conditions. A decline in consumer sentiment typically precedes a decline in consumer spending activity, which drives overall economic growth.
Preliminary UoM Inflation Expectations
Consumer inflation expectations give us a clue about what consumers think about changes in prices.
- If inflation expectations are running higher than forecasts, it could mean that consumers are expecting sustained changes in prices. This could mean that spending habits are being affected by this phenomenon, which could mean that inflation psychology is taking root in the economy.
- If inflation expectations are running lower than forecasts, it could mean that consumers are becoming more confident that inflation is gradually coming back to normal. This could mean that financial markets could be bolstered by this phenomenon as it could mean that inflation is gradually returning to normal.
Stock Market Performance
Major Indexes Show Diverging Momentum While Underlying Breadth Remains Fragile
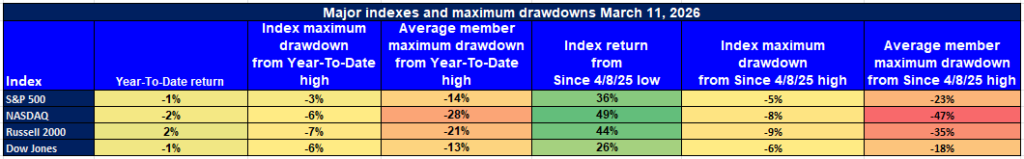
Equity markets continue to display a complex structure where headline index performance does not always reflect the experience of the average stock. From our perspective at Zaye Capital Markets, the latest index data highlights a clear divergence between benchmark resilience and the deeper drawdowns experienced by many individual constituents. While major indexes have recovered significantly from the April 8, 2025 market lows, year-to-date performance remains mixed and the average stock within each index still reflects deeper declines. This pattern suggests that market leadership remains concentrated in a relatively small group of stronger companies, while broader participation across the market continues to lag.
Here is our breakdown of the latest performance across the major indexes based strictly on the figures provided in the chart:
S&P 500: Strong Recovery From Lows, But Participation Remains Narrow
YTD: -1% | 36% since 4/8/25 low | -3% from YTD high | Avg. member: -14%
The S&P 500 currently shows a modest decline of 1% year-to-date despite delivering a powerful 36% rebound since the April 8, 2025 market low. The index has experienced a relatively shallow 3% drawdown from its year-to-date high, suggesting that large-cap leaders have continued to support the benchmark. However, the average constituent within the index has declined 14% from its own high, highlighting that the recovery has not been evenly distributed across the broader market. This divergence indicates that institutional capital is still concentrating in stronger companies with resilient earnings visibility rather than spreading evenly across the entire market.
NASDAQ: Powerful Index Rebound Masks Deeper Underlying Losses
YTD: -2% | 49% since 4/8/25 low | -6% from YTD high | Avg. member: -28%
The NASDAQ shows one of the strongest recoveries among the major benchmarks, rising an impressive 49% from the April 8 market low. Despite this powerful rebound, the index remains down 2% year-to-date and has experienced a 6% drawdown from its peak levels during the year. More importantly, the average stock within the NASDAQ has fallen 28% from its own high, reflecting significantly deeper declines beneath the surface. This pattern highlights how a smaller group of large technology and growth companies can drive index performance while many smaller constituents remain under pressure.
Russell 2000: Small Caps Lead Year-to-Date Gains But Show High Volatility
YTD: 2% | 44% since 4/8/25 low | -7% from YTD high | Avg. member: -21%
The Russell 2000, which represents smaller companies more sensitive to economic cycles, shows a modest gain of 2% year-to-date while delivering a strong 44% rebound since the April 8 low. However, the index has still experienced a 7% pullback from its year-to-date high, illustrating the higher volatility typically associated with small-cap stocks. The average constituent has declined 21% from its own high, reinforcing the idea that the small-cap universe continues to experience uneven recovery patterns even as the index itself shows modest improvement.
Dow Jones: Defensive Structure Supports Stability
YTD: -1% | 26% since 4/8/25 low | -6% from YTD high | Avg. member: -13%
The Dow Jones index reflects relatively stable performance compared with some growth-oriented benchmarks. The index is currently down 1% year-to-date but has risen 26% since the April 8, 2025 low. Its maximum drawdown from the year-to-date high stands at 6%, while the average constituent has declined 13% from its peak. This narrower dispersion compared with other indexes reflects the Dow’s composition of established companies with more stable earnings profiles, which can provide some resilience during periods of market uncertainty.
At Zaye Capital Markets, we continue to monitor market breadth indicators closely because the divergence between index performance and average stock performance often provides important signals about underlying market strength. While the recovery from the April 2025 lows has been substantial across major indexes, the deeper drawdowns experienced by many individual companies suggest that investors remain selective and cautious. Sustained improvement in market breadth—where a larger number of stocks begin participating in the rally—would likely be required to confirm a more durable and balanced advance in global equity markets.
The Strongest Sector In All These Indices
Energy Leads Sector Performance by a Wide Margin as Defensive and Hard-Asset Themes Dominate
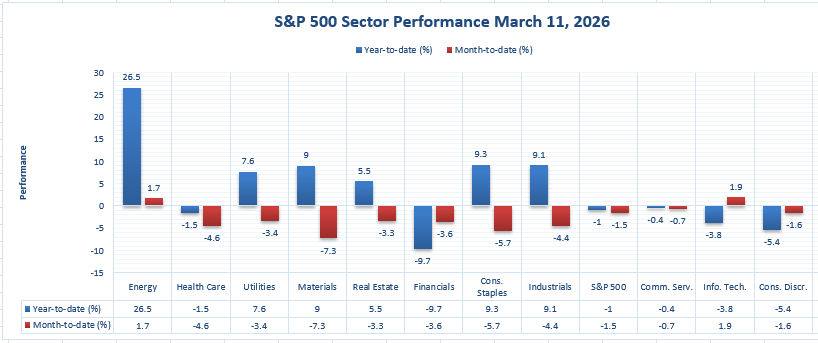
From our perspective at Zaye Capital Markets, the latest sector performance data shows a very clear leader: Energy remains the strongest sector on this chart by a significant margin. Based strictly on the figures provided, Energy is up 26.5% year-to-date and 1.7% month-to-date, making it the only sector with both a very strong annual gain and a positive monthly move. That combination stands out sharply against the broader S&P 500, which is down 1.0% year-to-date and down 1.5% month-to-date. This tells us that leadership in the market is not broad. Instead, capital has been moving into a narrower group of sectors tied to pricing power, commodity strength, and resilient cash flow generation.
The gap between Energy and the rest of the market is substantial. The next-best year-to-date performers on the chart are Consumer Staples at 9.3%, Industrials at 9.1%, and Materials at 9.0%, followed by Utilities at 7.6% and Real Estate at 5.5%. However, unlike Energy, each of those sectors is negative on a month-to-date basis. Consumer Staples is down 5.7% for the month, Industrials are down 4.4%, Materials are down 7.3%, Utilities are down 3.4%, and Real Estate is down 3.3%. This matters because it shows that while a few sectors have held onto positive year-to-date performance, near-term momentum has weakened across most of the market. Energy is the only area on this chart still showing strength across both time frames, which reinforces its position as the strongest sector in the current setup.
Other parts of the market remain clearly under pressure. Financials are down 9.7% year-to-date and down 3.6% month-to-date, making them the weakest sector on a year-to-date basis. Consumer Discretionary is down 5.4% year-to-date and down 1.6% month-to-date, while Information Technology is down 3.8% year-to-date despite gaining 1.9% month-to-date. Health Care is down 1.5% year-to-date and 4.6% month-to-date, and Communication Services is down 0.4% year-to-date and 0.7% month-to-date. At Zaye Capital Markets, we interpret this structure as a market still favouring selective leadership rather than broad confidence. Based only on the figures in this chart, Energy is the strongest sector by far, both in terms of absolute year-to-date performance and consistency of current momentum.
Earnings
At Zaye Capital Markets, corporate earnings remain one of the most important indicators for understanding the strength of different sectors of the economy. Earnings reports provide direct visibility into revenue growth, profitability trends, consumer demand patterns, and corporate strategy. The results released on March 12, 2026 and the companies reporting on March 13, 2026 together offer a broad snapshot of how technology platforms, precious-metal producers, discount retailers, telecommunications firms, and consumer brands are navigating the current economic environment.
Yesterday’s Earnings Recap – March 12, 2026
- Adobe Inc. (ADBE) reported Q1 FY2026 revenue of $6.40 billion, with GAAP diluted EPS of $4.60 and non-GAAP EPS of $6.06, while net income reached approximately $1.856 billion. The results confirmed continued strength in the company’s digital media and subscription software ecosystem. Over the trailing twelve months through FY2025, Adobe generated $23.769 billion in revenue and $7.130 billion in net income, with diluted EPS between $16.70 and $16.73. Investors remain focused on subscription growth across the creative cloud ecosystem and how artificial-intelligence tools integrated into Adobe’s platforms may support future monetization.
- Wheaton Precious Metals Corp. (WPM) released Q4 FY2025 results, highlighting record annual performance for the company. Earnings per share ranged roughly between $0.88 and $1.22, beating estimates near $1.03–$1.08. The company generated trailing twelve-month revenue of about $1.83 billion and net income near $1 billion, with diluted EPS around $2.20. Profitability remained strong, with margins around 54.72%, supported by favourable precious-metal prices and the company’s streaming royalty business model.
- Dollar General Corporation (DG) reported Q4 FY2026 revenue of $10.91 billion, representing year-over-year growth of about 5.9%, while diluted EPS reached $1.93, beating market expectations. Net income totaled approximately $426.3 million. On a trailing basis, the company produced $42.12 billion in revenue and $1.28 billion in net income, with diluted EPS of $5.79. Investors are closely watching same-store sales trends, pricing strategies, and how value-oriented consumers continue shifting spending toward discount retail channels.
- Ulta Beauty, Inc. (ULTA) reported Q4 FY2025 revenue of $3.90 billion, with diluted EPS of $8.01, slightly below some expectations near $8.03–$8.10. For the full fiscal year ending January 31, 2026, the company generated $12.4 billion in revenue, representing 9.7% annual growth, while operating income reached $1.5 billion, equal to 12.4% of net sales. Full-year diluted EPS reached $25.64, rising 1.2% year-over-year. The results highlight continued demand across cosmetics, skincare, and beauty products supported by store expansion and loyalty program growth.
Today’s Earnings Preview – March 13, 2026
- VEON Ltd. (VEON) is expected to provide insight into subscriber growth trends across its telecommunications markets. Investors will be watching mobile data consumption, revenue expansion across emerging markets, and average revenue per user. Telecom earnings often reveal broader demand trends in digital connectivity and infrastructure investment.
- RLX Technology Inc. (RLX) is scheduled to release results that investors will analyze for product demand trends and international expansion progress. Market participants will focus on revenue growth, margin stability, and regulatory developments that could influence long-term market access for electronic consumer products.
- Buckle Inc. (BKE) is expected to deliver earnings that provide signals about discretionary retail demand. Investors will be closely monitoring comparable store sales performance, inventory turnover, and apparel demand trends as consumer spending patterns evolve across the retail sector.
- Kyivstar (KYIV) is expected to report earnings near $0.32 per share, which will serve as an early benchmark for evaluating performance. Investors will focus on subscriber growth, telecommunications infrastructure investment, and revenue stability within the company’s core markets.
From our perspective at Zaye Capital Markets, these earnings collectively provide insight into several key themes shaping the market today: the strength of software subscription models, profitability within precious-metal streaming businesses, resilience in discount retail demand, continued growth in the beauty sector, and evolving telecommunications demand across emerging markets.
Stock Market Overview – Friday, 13 Mar 2026
The U.S. stock markets are trading with a cautious sentiment as investors digest the latest geopolitical tensions, ongoing inflationary concerns, and mixed economic data. The latest jump in oil prices due to rising tensions in the Middle East has further raised concerns that inflation might persist for a longer period than expected. On the other hand, mixed economic data and weaker wage growth have raised concerns that the overall pace of economic growth might be slowing down. At Zaye Capital Markets, we are seeing a market environment where capital is being selectively deployed rather than broadly. We believe that investors are becoming increasingly focused on earnings sustainability and exposure to structural growth themes such as artificial intelligence and energy security.
Stock Prices
Economic Indicators and Geopolitical Developments
The overall sentiment in the markets is being driven by a combination of geopolitical and macroeconomic factors. The latest jump in energy prices is affecting the overall cost structure for transportation and manufacturing activities. The overall economic data suggests a delicate balance between economic growth and moderation. The markets are being driven by a combination of two factors: the potential for ongoing inflation due to a rise in commodity prices and the possibility that overall economic growth might slow down over a period of time. The overall volatility in the markets remains high, and institutional investors are becoming increasingly cautious and defensive in nature.
Latest Stock News – March 12 Developments
- $NVDA | Nvidia continues to be a leader in the artificial intelligence infrastructure market based on the increasing demand for data center chips worldwide. The company is expanding its artificial intelligence ecosystem from graphics processing units to include networking solutions, software frameworks, and computing systems that will be used for next-generation artificial intelligence systems. In addition, the company has invested heavily in infrastructure development for artificial intelligence development projects, which further cements its position as a backbone provider for hyperscale computing systems. Despite the company’s strong fundamental position, the stock has experienced fluctuations based on investor concerns over whether the major cloud computing companies will be able to design their own artificial intelligence chips for future systems.
- $MSFT | Microsoft continues to be a major investor in artificial intelligence infrastructure development. The company is expanding its cloud computing ecosystem to meet the increasing demand for generative artificial intelligence services from enterprises. The company is aggressively integrating artificial intelligence into all of its software solutions, which further positions the company’s technology stack as a backbone provider for artificial intelligence systems used by enterprises. This requires a significant capital expenditure on data centers and computing systems that further cements the company’s position in the market.
- $GOOGL | Google is aggressively integrating artificial intelligence into all of its products, cloud computing solutions, and enterprise solutions. The company is expanding its artificial intelligence capabilities and integrating them into all of its solutions. Based on increasing competition in the artificial intelligence market, Google is aggressively integrating artificial intelligence into all of its solutions as a major driver for future growth, particularly in the enterprise market for machine learning infrastructure solutions.
- $AMZN | Amazon is rapidly growing its cloud infrastructure and developing its own artificial intelligence chips to meet the increased demand for generative AI services. The company is growing its data centers and incorporating its AI capabilities in its cloud infrastructure to compete more aggressively in the market against other hyperscale cloud providers. This is a broader trend for technology giants to build their own AI infrastructure to manage computing costs and maintain a competitive edge in the future.
- $META | Meta is investing significantly in the development of its own artificial intelligence chips to power its own artificial intelligence capabilities. The company is developing its own chips to minimize its dependence on third-party chip manufacturers and to boost its capabilities in machine learning algorithms, advertising optimization, and generative AI development.
- $AAPL | Apple is a company that is being closely watched by investors to determine how the company can leverage advanced artificial intelligence capabilities in its overall portfolio of devices and software platforms. The company is being closely watched by investors to determine how its overall strategy in artificial intelligence computing can differentiate itself from other cloud-based AI computing providers.
- $TSLA | Tesla is rapidly advancing its overall capabilities in artificial intelligence through the development of its overall autonomous driving capabilities and robotics technology. The company’s investments in AI computing infrastructure and neural network training capabilities highlight its overall ambitions to become a technology leader in the AI computing space.
- $PLTR | Palantir is benefiting from the increasing demand for data analytics and artificial intelligence platforms for both government organizations and business enterprises. Its software platforms are continuously gaining traction for organizations seeking platforms that can effectively integrate data and implement artificial intelligence decision-making systems throughout operations.
- $AMD | AMD continues to be a major player in the artificial intelligence semiconductor market due to cloud computing organizations diversifying their hardware supply chains. Its high-performance computing semiconductors are increasingly being used as alternatives for artificial intelligence processors, enabling cloud computing organizations to expand computing capacity while controlling hardware expenditures.
- $HIMS | Hims & Hers Health continues to expand its digital platform for healthcare services, generating investor interest as the company expands telehealth services and seeks deals for weight management treatments. Its business strategy is centered on expanding digital platform-based subscription healthcare services.
- $ANTHROPIC | Anthropics has become one of the major players in the continuously evolving artificial intelligence market. It is expanding the development of artificial intelligence systems while competing with other technology companies for computing infrastructure and business enterprises.
- $OPENAI | OpenAI continues to be at the center of the global artificial intelligence technology development market due to the increasing demand for generative artificial intelligence systems for both enterprise and consumer markets. Its development of powerful artificial intelligence systems has accelerated the need for computing infrastructure and semiconductor technology.
The Magnificent Seven & S&P 500

The ‘Magnificent Seven’ group of Apple, Microsoft, Nvidia, Amazon, Meta, Alphabet, and Tesla continue to dominate the S&P 500 movement in terms of direction. These companies have generated a disproportionate contribution of gains in the S&P 500 over the last one year, indicating that any weakness in these companies is likely to affect the overall market movement. Recently, these stocks have witnessed selling pressure owing to their valuations, increased interest rates, and profit-taking after a strong rally in these stocks. These companies are major contributors to the S&P 500 movement, and their performance is likely to decide whether the S&P 500 moves up or not until other companies also join this group of mega-cap technology companies. Until then, market movement is likely to be sensitive to these stocks.
Major Index Performance as of Friday, 13 Mar 2026
- S&P 500: Trading at 6,672.62, down 1.5%, reflecting pressure from technology stocks and geopolitical concerns.
- Nasdaq Composite: Trading at 22,311.98, down 1.8%, as mega-cap technology names face selling pressure.
- Dow Jones Industrial Average: Trading at 46,677.85, down 1.6%, with weakness across industrial and financial sectors.
- Russell 2000: Trading at 2,488.99, down 2.1%, reflecting volatility among smaller companies sensitive to economic conditions.
We believe that the present market movement is selective rather than bullish, given that leadership is coming only from a few technology companies, whereas geopolitics and macroeconomic factors are also affecting overall market movement. We are focused on companies that demonstrate strong earnings visibility, strong cash flow generation, and strong growth fundamentals as major indicators of movement in the overall stock market scenario.
Gold Price: What Drives Gold Prices During Geopolitical Risk And Inflation Data Shifts?
Currently, the spot gold price is trading around $5,112 as of Friday, 13th March 2026. The gold price is trading near historically high levels as investors are trying to understand the geopolitical risks as well as the economic data releases that can impact interest rate expectations. The latest statements from the White House on the military operations against Iran’s missile and naval capabilities, along with the repeated assertion that preventing Iran from acquiring nuclear weapons is a top priority, are raising security concerns around the globe. However, the statements that higher oil prices can result in higher economic benefits, along with the statements on the shipping waivers to address the fuel price increases, are making the energy market outlook more complex. The fact that the current oil prices are higher due to the tensions over the energy supply routes is leading to a rise in the inflation expectations within the financial markets. Geopolitical tensions, along with the rise in commodity prices, are usually favorable for assets like gold, which are considered safe-haven assets, as they are expected to protect investors from currency, energy, as well as financial market volatility. The gold price is being influenced by the geopolitical factors, as well as the macroeconomic factors related to the economic releases on inflation.
Economic indicators released over the past week and those to be released today are also playing a significant role in the overall market dynamics of the gold market. Recent economic indicators suggest that the overall momentum of the economy is stable but gradually losing steam as the initial phase of the economic recovery observed in 2025 comes to a close. Today’s upcoming indicators such as the Core PCE Price Index, preliminary GDP data, durable goods orders, JOLTS job openings, and consumer sentiment surveys will provide investors a gauge on the overall inflation situation. If the inflation indicators such as the Core PCE Price Index are higher than expected, the bond yields may increase, causing a temporary decline in the prices of gold. However, under the current overall market dynamics, the overall gold market can be said to be dictated by the following factors: geopolitical issues associated with the energy markets, inflationary pressures associated with the movements of the prices of commodities, and the monetary policies associated with the overall macroeconomic indicators. With all these factors playing a significant role in the overall dynamics of the gold market, the overall institutional investment in bullion is still high.
Oil Prices: Why Are Oil Prices Volatile Amid Geopolitics And Economic Data Risks?
Currently, the price of Brent crude oil is around $100.72 a barrel, whereas the price of WTI crude oil is around $95.51 a barrel as of Friday, 13th March 2026, after a sharp rebound that brought the price back to the psychological level of $100 a barrel. The sharp rise in the price of crude oil can be attributed to a mix of factors, including the geopolitical situation and the energy supply situation, which are focused on the Middle East. The rise came after the White House announced that the prevention of Iran from acquiring nuclear weapons was a top priority, as well as the confirmation of military operations against Iran’s missile and naval capabilities, which caused investors to fear the disruption of energy shipping routes. However, the subsequent statement from the White House, which stated that higher oil prices could result in higher revenues, as well as the shipping waivers that are meant to address the fuel price increases, brought a layer of complexity to the situation. The energy traders are, therefore, caught between the geopolitical tensions, which are a threat to the energy supply, and the government’s efforts to calm the energy market. In the context of the overall crude oil market, the statements from the international energy organizations are a significant factor. OPEC is managing the energy supply by regulating the energy supply levels through a coordinated production strategy, with the aim of keeping the energy market stable. The International Energy Agency, on the other hand, stated that the geopolitical tensions affecting the shipping routes are a threat to the energy supply, as they are likely to tighten the energy supply if the exports are impaired.
The economic data announced earlier in the week and the key economic indicators that will be announced today are also affecting energy markets. The mixed signals from the labor market and the moderation in wage growth suggest that the world economy is stable but may be entering a period of slower growth after the strong growth experienced in 2025. Oil demand is correlated to industrial production, international trade, and transportation. Any sign of a slowdown in the world economy will impact oil prices. The key economic indicators that will be announced today include the Core PCE Price Index, preliminary GDP data, durable goods orders, JOLTS job openings, consumer sentiment, and inflation expectations. If the economic data announced today is strong, it will reinforce the view that oil demand will remain strong in the future and that prices will remain at current and higher levels. On the other hand, weaker economic data will suggest weaker oil demand in the near future but will reinforce the view that the world economy will grow and that policymakers will do whatever it takes to ensure that the world economy grows. In the current environment, oil prices are being driven by a combination of factors that include geopolitical risks and energy policy responses.
Bitcoin Prices: What Is Driving Bitcoin Prices During Geopolitical Risk And Oil Shocks?
The price of Bitcoin is currently trading at around $71,100 as of Friday, 13th March 2026. It has continued to trade in a band between $69,000 and $71,700 amid ongoing global macro influences on the price of the cryptocurrency. The price has continued to face challenges in breaking above the $72,000 resistance point despite ongoing institutional interest in the digital currency. This has largely been driven by geopolitical risks that are unfolding in the oil market. Recent comments by officials that the ongoing efforts to prevent Iran from acquiring a nuclear weapon remain a top priority for the country, along with confirmation that military operations against ballistic missile sites and naval assets are ongoing, have increased geopolitical tensions in the market. This has seen oil prices surge sharply, reaching levels above $100 per barrel earlier in the week. This has had a ripple effect on the price of Bitcoin and other assets. In the Bitcoin universe, the surge in oil prices has additional implications for the price since the mining operations for the digital currency are energy-intensive. Therefore, when oil prices surge sharply in the market, it has a corresponding effect on the cost of operations for mining operations for the digital currency. This explains why the price of Bitcoin dipped below $69,500 earlier in the week before recovering to trade in the $70,000 region amid the oil price surge that was triggered by the tanker attacks. According to analysts, the fact that Bitcoin has continued to trade close to record levels amid geopolitical risks in the market points to the underlying strength that is being shown by institutional investors for the digital currency. This is particularly true since the trading volumes in the Bitcoin futures market remain much larger than those in the spot market.
Meanwhile, macroeconomic data and monetary policy expectations also remain an important factor for the price movement of Bitcoin. The macroeconomic data released earlier this week showed signs of a slowdown in real wage growth and mixed signals for the job market. The data suggests that the global economy is shifting from the strong recovery seen during 2025 to a balanced growth rate. The macroeconomic data is creating both positive and negative factors for the price movement of Bitcoin. The slowdown in the global economy can be positive for the price movement of Bitcoin since investors are increasingly considering it a safe haven against financial crisis and currency devaluation. At the same time, inflation risks due to an increase in crude oil prices can also be a negative factor for the price movement of Bitcoin since it can lead to an increase in interest rates, thereby making traditional financial assets attractive. The macroeconomic data released today includes the Core PCE Price Index, preliminary gross domestic product data, durable goods orders, job openings data, consumer sentiment data, and inflation expectations. The price movement of Bitcoin is also becoming macro-sensitive since it is becoming increasingly related to geopolitical events, changes in the global energy market, and trends in global monetary policies.
Why Ethereum Price Moves Depend on Whale Activity and ETF Flows?
Ethereum is currently trading at $2,104.5 as on Friday, 13th March 2026, based on the latest weekly market data. This indicates a period of consolidation for Ethereum after a robust uptrend over the last few years. The above chart indicates that Ethereum has maintained a strong structure above its 200-week moving average price level at $2,432.9. This price level is a major institutional trend indicator for the overall cryptocurrency market. When Ethereum is trading near or below this price level, it is a period where the market is re-evaluating the price levels rather than a major trend reversal. At Zaye Capital Markets, we believe that Ethereum’s price movement has been influenced by institutional investors’ sentiments over the last few months. Over the last week, market analysts have indicated that capital flows into digital asset investment products and crypto ETFs remain one of the most significant price-moving indicators for Ethereum. When these investment products pick up Ethereum holdings, the overall ETH supply on the market decreases, which helps maintain a relatively stable price for Ethereum during a period of market uncertainty. At the same time, Ethereum’s position as a major infrastructure for decentralized finance, smart contracts, and tokenized financial assets continues to remain a major price-supporting factor for Ethereum.
Another important factor that is affecting the price movements of Ethereum is the actions and movements of the large holders known as whales. The blockchain transaction records over the last several days indicate that large holders of Ethereum, who are known as whales, have continued to make transactions involving large quantities of Ethereum. When these large holders transfer Ethereum from exchange accounts to private wallets, this can help stabilize the prices in the market. On the other hand, the transfer of large quantities of Ethereum back to exchange accounts can create price instability in the market. According to analysts who track the blockchain transaction records and movements of the whales, the activities and movements of the whales tend to pick up during times when the market is testing key technical levels such as the 200-week moving average, as shown in the chart. The movements and activities of the whales can be one reason why the price movements of Ethereum are at a relatively defined range and why the prices have not moved in either direction. At Zaye Capital Markets, we believe that the ETF capital flows, activities and movements of the whales, and the overall global liquidity conditions are the three factors that can affect the price movements of Ethereum in the future.
