Where Are Market Today?
Global equity futures are trading higher today, with both European and U.S. markets positioned to open on a positive note as investor sentiment improves. U.S. futures are leading the move, with S&P 500 futures up 0.68%, Nasdaq 100 futures rising 0.71%, and Dow futures gaining 352 points, or 0.75%, while European futures are following the same upward direction. This rebound comes after a weaker prior session where major indices closed lower, showing that markets are still highly reactive to incoming headlines. The primary reason behind this shift is renewed optimism surrounding a potential resolution in the Iran conflict, which is reducing immediate geopolitical risk and encouraging a move back into risk assets.
The first major driver behind this upward positioning is the change in geopolitical expectations. Reports that a structured peace plan has been delivered to Iran, combined with confirmation of ongoing negotiations, have significantly reduced fears of further escalation. This is particularly important because the Middle East remains central to global energy supply, and any reduction in conflict risk directly impacts oil price expectations. As a result, investors are becoming more comfortable increasing exposure to equities. However, the situation remains fluid, as conflicting signals around direct talks and ongoing military activity mean that markets are still pricing in uncertainty alongside optimism.
The second key factor is the continued dominance of oil prices and interest rates in driving market behavior. Recent market dynamics show that equities are moving largely in response to energy prices and borrowing costs rather than traditional growth indicators. While oil prices remain elevated, the absence of further escalation is helping stabilize expectations, which supports equities in the short term. At the same time, concerns around persistent inflation and high interest rates continue to limit valuation expansion, particularly in growth sectors. This creates a situation where futures can rise on improved sentiment, but upside remains constrained by macroeconomic realities.
Finally, upcoming economic data and earnings releases are reinforcing a cautious but constructive tone. Investors are closely watching inflation-related indicators and corporate earnings for confirmation of economic resilience. Stronger data could validate the current rebound and support further gains, while any signs of persistent inflation or weakening demand could quickly reverse the move. This leaves markets in a highly reactive state, where direction is being shaped by the interaction between geopolitical developments, energy prices, and policy expectations. For now, futures are pointing higher, but sustainability will depend on whether these supportive factors can hold.
Major Index Performance as of Wednesday, 25 March 2026
- S&P 500: Trading at 6,606.49, down 0.27%, reflecting continued pressure from inflation concerns and sector concentration.
- Nasdaq Composite: Trading at 22,091.00, down 0.28%, as weakness in mega-cap technology continues to weigh.
- Dow Jones Industrial Average: Trading at 46,021.43, down 0.44%, showing mild weakness despite rotation into defensive sectors.
- Russell 2000: Trading at 2,495.00, up 0.65%, indicating relative resilience in small-cap stocks.
The Magnificent Seven and the S&P 500

The Magnificent Seven — Apple, Microsoft, Nvidia, Amazon, Meta, Alphabet, and Tesla — continue to dominate overall market direction, but they are also a key source of pressure. While Nvidia has led gains due to strong AI demand expectations, other names like Alphabet and Tesla are facing increased scrutiny around spending, margins, and growth sustainability. This divergence is creating instability within the group, and because these stocks carry significant weight in the S&P 500, their weakness continues to limit broader index performance. The market remains heavily dependent on this group, and without broader participation, upside momentum is likely to remain constrained.
Drivers Behind the Market Move – Wednesday, March 25, 2026
As U.S. and European markets navigate through a rapidly evolving environment shaped by geopolitical developments, inflation pressures, and key economic data releases, investor sentiment remains cautious but opportunistic. The current market tone reflects a shift toward conditional risk-taking, where optimism around easing tensions is balanced by persistent macroeconomic concerns. Several key factors are influencing market direction today.
- Geopolitical Negotiations vs Ongoing Military Pressure
The evolving situation around Iran remains the most immediate driver of market sentiment. Recent statements confirm that negotiations are actively underway, with a structured peace plan reportedly delivered and signals that a deal could be reached. This has reduced immediate fears of escalation, supporting equity futures and risk assets across both regions. However, this optimism is being tempered by continued military activity, including troop deployments and ongoing operations targeting strategic infrastructure. This dual narrative—progress toward diplomacy alongside active conflict—creates a fragile environment where markets are pricing both de-escalation and unresolved risk, keeping volatility elevated.
- Energy Prices and Inflation Pressures
Energy markets continue to play a central role in shaping equity performance. Oil price movements remain a key transmission channel for inflation expectations, with recent volatility reflecting shifting geopolitical risk. While signs of negotiation have helped stabilize prices, uncertainty around supply routes and ongoing military developments continues to support a risk premium in energy markets. At the same time, recent economic data showing rising labor costs and slowing productivity reinforces concerns that inflation may remain persistent. This combination keeps pressure on central banks to maintain tighter policy for longer, limiting valuation expansion and contributing to cautious positioning in equities.
- Focus on Inflation Data and Central Bank Signals
Investors are closely monitoring today’s economic releases, particularly inflation-related data and central bank communication, for clearer direction on policy outlook. Key events such as inflation readings and remarks from central bank leadership are expected to influence expectations around interest rates and liquidity conditions. A higher-than-expected inflation print would reinforce the case for prolonged tight financial conditions, potentially weighing on equities and risk assets. Conversely, softer data could support a more accommodative outlook, improving sentiment and supporting market gains. This anticipation is leading to a measured approach among investors, with markets remaining highly sensitive to incoming data.
In summary, the combination of geopolitical developments, energy-driven inflation pressures, and the anticipation of key economic data is shaping today’s market landscape. Investors are navigating these crosscurrents with caution, resulting in a market that is stabilizing but still vulnerable to rapid shifts in sentiment.
Digesting Economic Data
The TRUMP Tweets and its Implications
The latest sequence of statements presents a clear dual narrative—continued military pressure alongside active diplomatic engagement. On one side, there is confirmation that operations are advancing, additional troop deployments are underway, and strategic infrastructure has been targeted. On the other, there is repeated emphasis on negotiations, ceasefire proposals, and signals that a deal is both possible and actively being pursued. From a market perspective, this combination creates a highly unstable expectation framework. Investors are forced to price both escalation risk and de-escalation potential at the same time, which leads to sharp and frequent swings across commodities, equities, and currencies. This is why markets are not trending cleanly in one direction but instead reacting to each headline in real time.
The repeated focus on negotiations with Iran, including claims that discussions are productive and that a deal could be reached, is a critical driver of short-term risk sentiment. These signals reduce immediate fears of prolonged conflict, particularly around energy supply disruption, which directly impacts oil and inflation expectations. However, these reassurances are being offset by continued references to military readiness and operational progress, meaning that markets cannot fully remove the geopolitical risk premium. This creates a situation where any confirmation of a deal could trigger a rapid risk-on move, while any breakdown in talks could quickly reverse sentiment and push markets back into defensive positioning.
Another important layer comes from domestic policy signals, including references to government shutdown negotiations and broader institutional actions. While these may appear secondary, they contribute to overall uncertainty around fiscal direction and policy stability. Markets tend to react negatively to uncertainty in governance, particularly when combined with geopolitical tension. At the same time, symbolic actions and proclamations, while not directly market-moving, reinforce the broader narrative of a highly active policy environment, where multiple fronts—domestic and international—are evolving simultaneously. This adds to the complexity investors must navigate when positioning capital.
Overall, the key implication is that markets are currently operating in a headline-driven regime where expectations can shift rapidly based on political communication. The balance between conflict and negotiation is the central theme, and until there is clear resolution on either side, volatility is likely to remain elevated. Investors are not reacting to confirmed outcomes but to probabilities, which are constantly being reshaped by new information. This environment favors short-term positioning and cautious risk management, as clarity remains limited and the potential for sudden sentiment shifts remains high across all major asset classes.
Richmond Fed Manufacturing Rebounds to Neutral, Signaling Early Stabilization
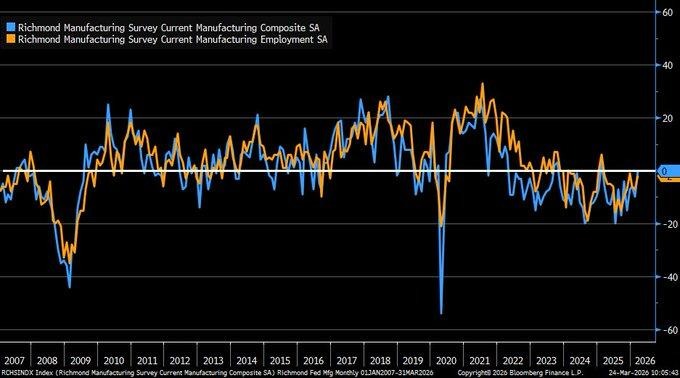
The Richmond Fed Manufacturing Index improved significantly in March 2026 to 0, beating expectations of -8. This was a notable improvement from the previous reading of -10. This represents a transition from a contracting to a more neutral or stabilizing trend within the Fifth District’s industrial base. This is important since it represents a pause in the downward momentum that has characterized regional manufacturing activity over recent months. This was driven by a significant improvement in new orders, which moved into positive territory. This represents a situation where demand is no longer deteriorating at a similar rate. There were also signs of a slowdown in employment conditions, as well as a moderation in wage growth. This represents a situation where costs associated with labor are no longer rising.
A closer look at these underlying components further reinforces this notion that this is not yet a full recovery, but an early-stage normalization of economic conditions. This improvement in new orders is a strong indication of a gradual recovery of demand, while still slightly negative in capital expenditure, indicating that businesses are still apprehensive about entering into any capital expenditure commitments in the future. This apprehensiveness is a direct result of still unclear future growth prospects, while current conditions are improving. Historical data show that such a recovery from a very low level is often a precursor to a broader-based stabilization of economic conditions, but still lackluster investment spending is a clear indication that confidence is still an issue and not yet resolved. This moderation in wage pressures further reinforces our notion that inflationary pressures in the manufacturing sector are likely to ease in the coming periods, providing a much-needed breather to company margins.
Against this backdrop, Caterpillar Inc. (CAT) is currently undervalued, in our opinion, and is likely to benefit from a gradual recovery in industrial and infrastructure-related spending, which is directly correlated to a recovery in manufacturing conditions. It is imperative that analysts track this improvement in new orders and capital expenditure in future periods, as this would further reinforce a recovery trend in manufacturing conditions. It is also important to track industrial production and confidence data to ascertain whether this is a broader-based recovery or a mere rebound in economic conditions.
Labor Cost Surge and Productivity Slowdown Indicate Margin Pressure Risks
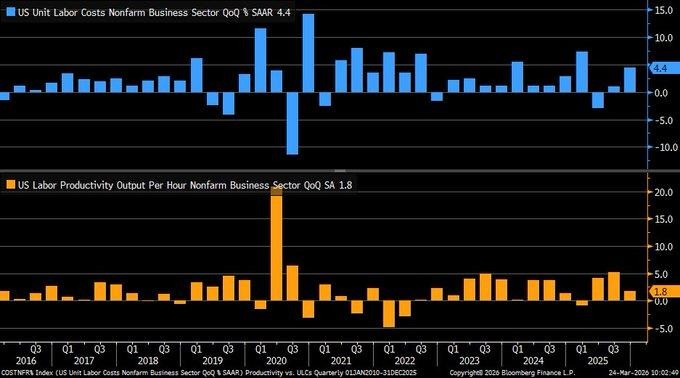
The latest revisions to the Q4 2025 nonfarm business sector data show a more worrying inflation trend than previously reported. The latest revisions to the data show a sharp increase in unit labor costs to 4.4% from 2.8%. At the same time, labor productivity growth has also been cut to 1.8% from 2.8%. This indicates a worrying trend where labor costs are rising faster than output, implying that businesses are paying more for every unit of output without a corresponding increase in productivity. This is a worrying trend because it directly influences inflation, especially in a service-based economy where labor is a major cost driver, making it difficult for inflation to fall sustainably.
Upon considering the macroeconomic implications, this divergence in labor costs and productivity creates a direct squeeze in corporate profitability. In this scenario, companies have two options. Either companies have to absorb the costs and compromise profitability, or they have to increase prices, thereby negatively impacting demand. Furthermore, this persistence in high labor costs also has macroeconomic implications for monetary policy. Central banks might have to maintain higher interest rates to control inflation. According to historical trends, in cases where labor costs have grown much higher than productivity, economic growth becomes less efficient. This leads to a higher risk of stagflation unless this situation is addressed by improvements in technology.
Under this macroeconomic scenario, we have identified Alphabet Inc. (GOOGL) as being undervalued due to its high dependence on digital infrastructure and automation-based revenues. This business model has high operating leverage, where revenues can grow without a direct increase in labor costs. Analysts should also focus on future productivity trends, labor costs, and corporate profitability trends. Based on these trends, either costs may increase or start to ease. Another area that analysts should focus on is technology spending trends. This area has the potential to become a key offset to rising labor costs and inefficiencies in the future.
Philadelphia Fed Services Collapse Indicates Weak Demand and Labor Risks
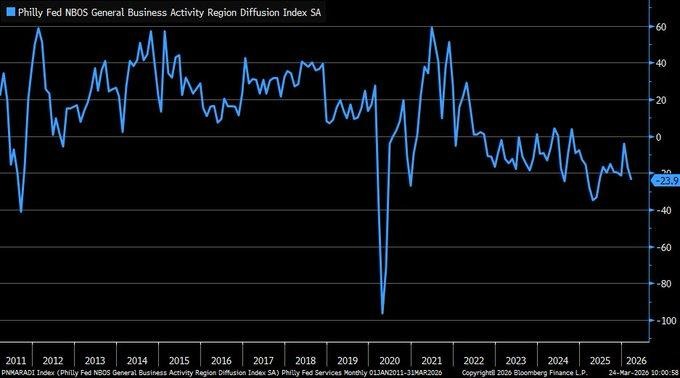
The March 2026 Philadelphia Fed Nonmanufacturing Business Outlook Survey reported a significant downside surprise, as the general activity index fell to -23.9, well below expectations of -15.7 and declining even more from February’s -17.3. This is one of the lowest readings since mid-2023 and indicates that the service sector, which has been a major driver of economic strength, is experiencing a deepening decline. The magnitude of the decline suggests that the weakening in demand is happening more quickly than anticipated, and there is concern that the weakening is spreading beyond the manufacturing sector to the broader economy. As the service sector is such a large part of the economy, there are significant implications for economic growth expectations.
A deeper examination of the sub-components reveals a more nuanced but still disconcerting trend. While new orders improved slightly and sales activity was resilient, employment was the standout figure, recording a sharp deterioration and arguably the most important figure in the report. Full-time and part-time employment indicators both registered significant contractions, implying businesses are increasingly looking to cut costs and become more efficient, rather than expand, in response to lower demand expectations. In the past, trends like this have presaged a broader slowdown, as reduced hiring activity eventually filters into lower consumer spending, perpetuating the downturn.
Under these conditions, we believe that Walmart Inc. (WMT) is a good investment opportunity as it is currently undervalued and well-positioned to take advantage of changes in consumer spending during a time of economic stress. As consumers change their spending patterns, value-oriented retail businesses like Walmart benefit from trade-down effects, ensuring a steady stream of revenue even in a time of reduced demand. Analysts should keep a keen eye on future releases of the services PMI, employment, and consumer spending trends, as these will determine whether the current trend of contraction accelerates or stabilizes. In particular, employment trends warrant close attention, as a continuation of weak hiring activity will confirm a broader slowdown in the services sector and reinforce the importance of a defensive stance in portfolios.
Happiness Index Points to Strong Social Structure and Economic Stability
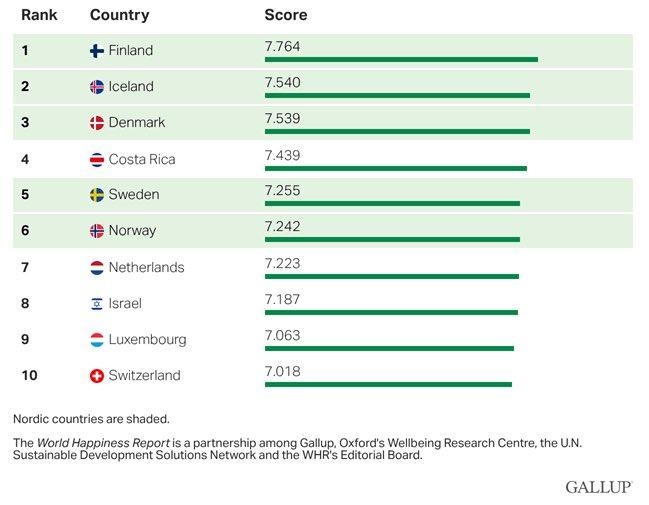
The recently released 2026 World Happiness Report again points to Nordic economies as having the highest levels of life satisfaction in the world. Countries such as Finland, Iceland, Denmark, Sweden, and Norway continue to dominate the list. These results are not derived from purely economic measures, but rather from long-term data on how individuals rate their own lives. The fact that these economies continue to dominate the list points to a number of strengths, from a strong social structure to high levels of income and macroeconomic stability. Perhaps most importantly, it points to the fact that macroeconomic stability is not derived from purely economic measures, but also from structural elements such as income distribution, access to healthcare, and trust in governance.
From this analytical perspective, the underlying factors behind these rankings offer significant insight into the concept of sustainable economic performance. In this case, economies with high GDP per capita, strong social support structures, and minimal levels of perceived corruption represent environments where economic consumption patterns are relatively stable and less susceptible to economic shocks. In this respect, even in the face of economic challenges like rising unemployment and geopolitical tensions, these economies have shown significant levels of economic resilience due to their high social trust environments.
From this perspective, we have identified Novo Nordisk A/S (NVO) as being significantly undervalued due to its presence in one of the most stable economic environments in the world. In this case, the company has benefited significantly from being in an environment with high demand for healthcare services due to strong public structures. Analysts are encouraged to focus their research efforts on policies affecting healthcare spending in these regions, demographic trends, and the stability of local currencies. In this respect, analysts are also encouraged to track social policy and labor trends to gauge whether these high social trust economies can sustain their economic structural advantage.
ETF Inflows Jump for Large Caps as Investors Re-Enter Risk
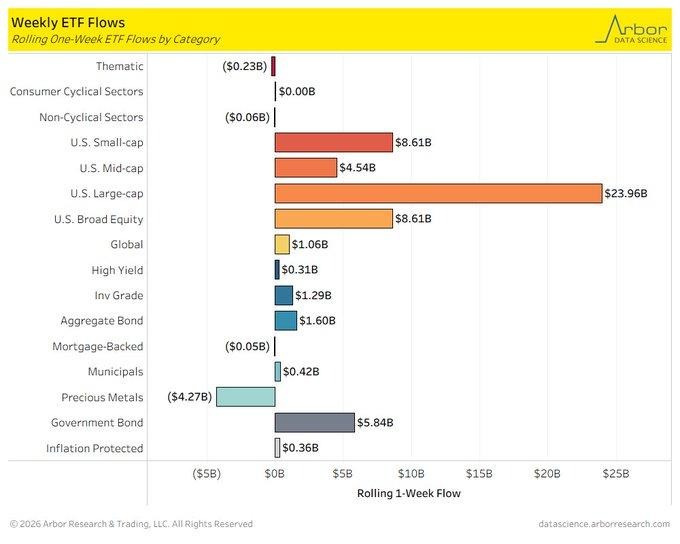
The latest flow data points to a significant change in market sentiment, with large-cap equity ETFs seeing inflows of about $24 billion for the week ending March 21, 2026. This represents a significant change from the outflows seen previously and points to investors becoming more confident in mega-cap stocks as the equity market stabilizes. In addition, broad-based equity and small-cap ETFs saw significant inflows of $8.6 billion each, suggesting that the inflows are not limited to large caps. Global equities also saw positive movement, suggesting that investors are gradually becoming comfortable and moving out from defensive positions to growth assets.
However, a more in-depth analysis of this trend indicates that investors are reacting to a decrease in near-term risks and a general improvement in market sentiment, particularly with regards to economic stability and policy expectations. The fact that both large caps and small caps are experiencing synchronized inflows indicates that investors are seeking stability as well as potential upside in the market. The significant $4.3 billion outflow from precious metals ETFs, as well as a sharp fall in gold ETF holdings, indicates a significant decrease in safe-haven demand. This usually occurs when there is a significant improvement in the confidence level regarding prevailing economic conditions. However, this also poses a potential threat to the market as a whole, as it becomes more vulnerable to unexpected shocks.
In this context, we believe that Apple Inc. (AAPL) is significantly undervalued considering its robust balance sheet position, its ability to generate cash flow on a consistent basis, and its position as a dominant player in the large caps ecosystem that continues to attract more and more institutional money as investors increasingly favor mega caps. Analysts need to keep a close eye on the prevailing trends in fund flows, volatility levels, and other macroeconomic announcements that are likely to determine the sustainability of the prevailing risk-on sentiment in the market. Particular attention needs to be given to a potential shift in safe-haven demand as a sudden shift in this trend may indicate a renewed level of uncertainty in the market that may pose a significant challenge to prevailing equity valuations.
Household Wealth Near Cycle Highs but Concentration Signals Uneven Growth
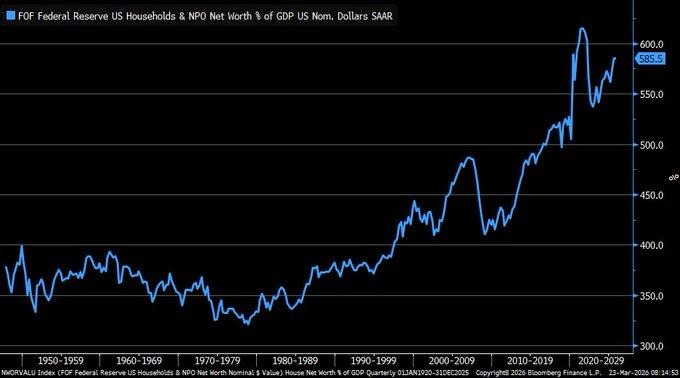
Recent Federal Reserve data shows household net worth rising to 585.5% of GDP in Q4 2025, marking a strong recovery from 2023 lows and approaching historical peak levels. This rebound has been largely driven by approximately $6 trillion in gains across equity markets and real estate, reflecting the impact of asset price appreciation rather than broad-based income expansion. While this level remains slightly below the all-time high near 595% recorded in early 2022, the current trajectory highlights the resilience of financial markets despite ongoing volatility and macroeconomic uncertainty. The scale of this recovery reinforces the importance of asset ownership in driving overall economic wealth.
However, a deeper structural issue emerges when analyzing the distribution of this wealth. A significant concentration remains among the highest-income households, with the top 10% controlling more than 70% of total assets. This imbalance suggests that while aggregate wealth metrics appear strong, the broader economic benefit is not evenly distributed across the population. Such concentration can limit the transmission of wealth gains into widespread consumer spending, as higher-income groups tend to have lower marginal consumption rates. This dynamic introduces a divergence between strong asset markets and potentially softer underlying demand, which is critical when assessing future growth sustainability.
Within this framework, we identify BlackRock Inc. (BLK) as undervalued, given its direct exposure to rising global asset values and its leadership in asset management and exchange-traded fund platforms. As household wealth expands, even if concentrated, asset managers benefit from higher assets under management and fee-based income growth. Analysts should closely monitor equity market performance, real estate trends, and wealth distribution data, as these will influence both asset inflows and long-term demand for investment products. Particular attention should also be paid to shifts in consumer spending patterns, as any disconnect between wealth growth and consumption could signal emerging economic fragility despite strong headline figures.
Chicago Fed Index Turns Negative as Growth Slips Below Trend
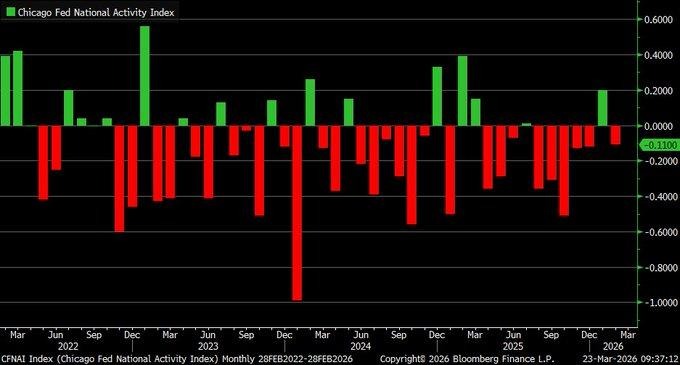
The February 2026 Chicago Fed National Activity Index (CFNAI) declined to -0.11 from January’s +0.20, signaling that economic activity has fallen below its long-run trend for the first time this year. This index, which aggregates 85 different indicators across production, income, employment, consumption, and housing, provides a broad snapshot of economic health. The shift into negative territory is important because it reflects a slowdown in overall momentum rather than isolated weakness in one sector. Historically, such moves below zero indicate that growth is cooling, even if the economy has not yet entered a full contraction phase.
A closer breakdown of the data shows that employment-related indicators were the primary drag, with only 31 out of 85 components registering positive movement. This suggests that labor market conditions, which have been a key pillar of economic resilience, are beginning to soften. When employment weakens, it typically feeds into lower income growth and reduced consumer spending over time, creating a ripple effect across the broader economy. Additionally, the volatility seen in the index since 2022 highlights an environment of unstable growth, where periods of expansion are increasingly interrupted by signs of slowdown, reinforcing uncertainty in forward-looking expectations.
In this environment, we identify Procter & Gamble Co. (PG) as undervalued due to its defensive positioning and consistent demand for essential consumer goods regardless of economic cycles. Its strong brand portfolio and pricing power allow it to maintain stable revenues even when growth slows. Analysts should closely monitor future labor market data, including job creation and wage trends, as well as consumer spending indicators, to assess whether this slowdown deepens or stabilizes. Particular attention should also be given to subsequent CFNAI readings, as continued negative prints would confirm a more sustained below-trend growth phase and strengthen the case for defensive investment strategies.
Upcoming Economic Events
GBP CPI y/y, ECB President Lagarde Speaks
As markets continue to navigate a fragile balance between inflation pressures and slowing growth momentum, attention now shifts toward key European economic signals that could influence global sentiment. The release of the UK’s inflation data alongside remarks from the European Central Bank President comes at a time when investors are highly sensitive to any shift in policy direction. These events are not just regional in impact—they carry broader implications for currency movements, interest rate expectations, and global equity positioning. Here’s what analysts should be watching closely and how different outcomes could shape market behavior:
GBP CPI y/y
The UK inflation reading remains one of the most critical indicators for understanding how persistent price pressures are within the economy.
- If the actual CPI figure comes in higher than forecast, this would signal that inflation remains stubborn, increasing the likelihood that the central bank maintains or even tightens its policy stance. In such a scenario, the British pound could strengthen due to expectations of higher interest rates, while equities—particularly rate-sensitive sectors—may come under pressure as borrowing costs remain elevated. At the same time, bond yields are likely to rise, reflecting expectations of prolonged restrictive policy conditions.
- On the other hand, if the CPI reading comes in lower than forecast, it would suggest that inflation is easing more quickly than expected. This could open the door for a more accommodative policy outlook, potentially weakening the pound while supporting equity markets through improved liquidity expectations. Lower inflation would also ease pressure on consumers and businesses, potentially supporting growth-sensitive sectors.
However, analysts should remain cautious, as a sharp decline in inflation could also reflect weakening demand conditions, which may cap the upside for risk assets.
ECB President Lagarde Speaks
The European Central Bank President’s speech will be closely scrutinized for signals regarding future monetary policy direction.
- If the tone leans hawkish—emphasizing persistent inflation risks and the need for higher rates—markets may react with a stronger euro, rising bond yields, and pressure on equities, particularly in interest rate-sensitive sectors. Such a stance would reinforce expectations that policy easing is not imminent, keeping financial conditions tight across the eurozone.
- Conversely, if the tone is more dovish—highlighting slowing growth or easing inflation pressures—this could support risk assets and weaken the euro as markets begin to price in potential rate cuts or a pause in tightening. Equities may benefit from improved liquidity expectations, particularly in sectors that are sensitive to borrowing costs.
Analysts should pay close attention to any guidance on inflation outlook, growth concerns, and policy timing, as even subtle changes in tone can shift market expectations significantly.
Stock Market Performance
Indexes Rebound from April Lows, But Weak Breadth Keeps Risks Elevated
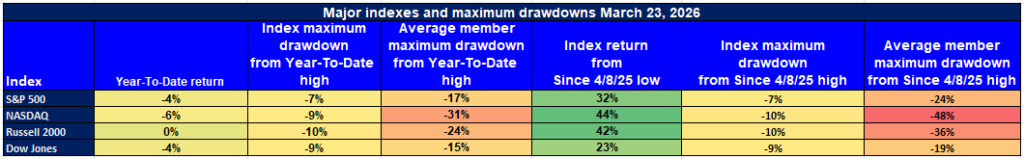
Equity markets have staged a notable recovery from their April 8th lows, with all major indexes posting strong rebounds. However, year-to-date performance remains negative or flat across most benchmarks, highlighting that the recovery is still incomplete. More importantly, the gap between index-level performance and average member returns continues to signal weak market breadth, suggesting that gains are being driven by a limited number of large-cap names rather than a broad-based rally across sectors.
Here’s our breakdown of the latest performance across key indexes:
S&P 500: Strong Rebound, But Participation Remains Narrow
YTD: -4% | +32% off April low | -7% from YTD high | Avg. member: -17%
The S&P 500 has rebounded 32% from its April lows, showing strong headline recovery. However, it remains down 4% year-to-date, and the relatively shallow 7% drawdown from its peak masks a deeper issue—average members are still down 17% from their highs and 24% from the April low recovery phase. This highlights narrow leadership and limited participation beneath the surface.
NASDAQ: Powerful Recovery, But Deep Internal Damage
YTD: -6% | +44% off April low | -9% from YTD high | Avg. member: -31%
The NASDAQ has delivered the strongest rebound, rising 44% from April lows. Despite this, it remains down 6% year-to-date, and the average stock tells a much weaker story, with a 31% decline from highs and a 48% drawdown since the April recovery phase. This divergence underscores continued fragility in growth stocks despite strong index performance.
Russell 2000: Flat Year, Weak Confidence in Small Caps
YTD: 0% | +42% off April low | -10% from YTD high | Avg. member: -24%
The Russell 2000 shows no year-to-date progress, sitting flat despite a 42% rebound from April lows. A 10% drawdown from its peak and average member losses of 24%—widening to 36% since April—highlight ongoing pressure in small-cap stocks, reflecting weaker confidence in economically sensitive segments.
Dow Jones: Relative Stability, But Underlying Weakness Persists
YTD: -4% | +23% off April low | -9% from YTD high | Avg. member: -15%
The Dow Jones has rebounded 23% from its April lows but remains down 4% year-to-date. While its average member drawdown of 15% is less severe compared to other indexes, losses deepen to 19% since April, indicating that even defensive sectors are not immune to underlying stress.
At Zaye Capital Markets, we remain cautious on headline strength and continue to focus on market breadth as a key confirmation signal. The current setup suggests that while momentum has improved, the lack of broad participation keeps downside risks active, reinforcing the need for selective exposure to high-quality, resilient companies.
The Strongest Sector in All These Indices
Energy Leads the Market by a Wide Margin Despite Broad Sector Weakness
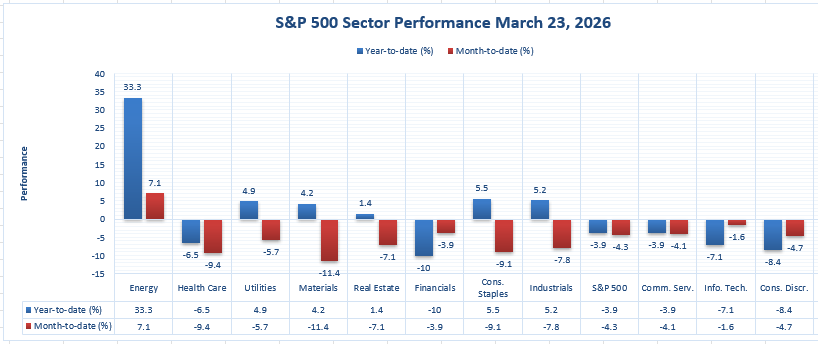
The latest sector performance data makes one point very clear: Energy is the strongest sector on the board by a substantial margin. While most sectors remain negative on both a year-to-date and month-to-date basis, Energy stands apart with a year-to-date gain of 33.3% and an additional month-to-date rise of 7.1%. From our perspective at Zaye Capital Markets, this is not just relative strength — it is outright leadership in a market where most sectors are still struggling to regain stability. The scale of this outperformance becomes even more striking when compared with the broader S&P 500, which is down 3.9% year-to-date and 4.3% month-to-date.
What strengthens the case further is the contrast between Energy and the next-best performing sectors. Utilities are up 4.9% year-to-date but down 5.7% month-to-date. Consumer Staples have gained 5.5% year-to-date, yet they are down 9.1% month-to-date. Industrials are up 5.2% year-to-date, but they have fallen 7.8% month-to-date. Materials have advanced 4.2% year-to-date, though they are down 11.4% month-to-date. This tells us that while several sectors still hold positive year-to-date returns, their short-term momentum has weakened sharply. Energy is the only sector showing strong gains across both timeframes, which makes it the clearest source of strength in the current market structure.
The weakness elsewhere reinforces this conclusion. Health Care is down 6.5% year-to-date and 9.4% month-to-date. Financials are down 10.0% year-to-date and 3.9% month-to-date. Information Technology has fallen 7.1% year-to-date and 1.6% month-to-date, while Consumer Discretionary is down 8.4% year-to-date and 4.7% month-to-date. Communication Services has also slipped 3.9% year-to-date and 4.1% month-to-date. Based strictly on the figures in this chart, Energy is the strongest sector across all these sectors and time horizons. At Zaye Capital Markets, we view this as a clear sign that leadership is concentrated, and that analysts should closely watch whether Energy can continue carrying market strength while the rest of the sector landscape remains under pressure.
Earnings
Yesterday’s Earnings – March 24, 2026
- KB Home (KBH) – Total revenues came in at $1,077.0 million, down 23% year-over-year from $1,391.8 million, reflecting continued pressure in the housing market. Homes delivered declined to 2,370 from 2,770, while the average selling price dropped to $452,100 from $500,700, highlighting affordability constraints driven by elevated borrowing costs. Housing gross profit margin compressed to 15.3% from 20.2%, with operating income falling sharply to $33.0 million from $127.3 million. Net income declined to $33.4 million from $109.6 million, and diluted EPS dropped to $0.52 from $1.49. Despite these pressures, the company maintained liquidity of approximately $1.20 billion and repurchased $50.0 million in shares, signaling financial stability amid demand weakness.
- McCormick & Company (MKC) – Q4 net sales increased to $1,850.4 million, up 2.9%, with net income rising to $226.6 million and diluted EPS reaching $0.84. However, gross profit margin declined to 38.9%, indicating ongoing cost pressures. For the full year, net sales stood at $6,840.3 million, with net income at $789.4 million and diluted EPS at $2.93. The company generated $962.2 million in operating cash flow, reflecting strong cash generation despite modest top-line growth. Segment performance showed consumer demand resilience, though volume growth remains limited as pricing continues to drive performance.
- GameStop (GME) – Net sales declined to $1,104.3 million from $1,282.6 million, yet profitability improved significantly. Gross profit rose to $386.8 million with margin expansion to 35.0%, while operating income increased to $135.2 million from $79.8 million. Net income reached $127.9 million, supported by disciplined cost management, with adjusted net income at $291.4 million. The company also reported a strong liquidity position, holding $9.0 billion in cash and marketable securities alongside additional digital asset exposure, reinforcing balance sheet strength despite declining revenues.
- AAR Corp. (AIR) – Sales increased to $845 million, up 25% year-over-year, driven by strong demand across aviation services, including parts supply, repair operations, and software platforms. GAAP net income reached $68 million, with diluted EPS at $1.71 and adjusted EPS at $1.25, up 26% year-over-year. Adjusted EBITDA rose to $102 million with a margin of 12.1%, while the company continued to improve its financial position, reducing net leverage to 2.17x and generating solid operating cash flow.
- Bruker Corporation (BRKR) – The company’s performance reflected stable demand in scientific instruments and diagnostic solutions, with investors focusing on capital expenditure trends and research funding cycles. While growth remains supported by long-term innovation demand, spending visibility remains sensitive to broader economic conditions, making forward guidance and order trends key indicators.
- Banco De Chile (BCH) – Earnings reflected the influence of interest rate dynamics on profitability, with performance tied closely to lending margins and regional economic stability. The banking environment continues to depend on credit demand, funding costs, and macroeconomic conditions, with analysts focusing on margin sustainability and loan growth trends.
Today’s Earnings Preview – March 25, 2026
- PDD Holdings Inc. (PDD) – Investors are closely watching this release for signals on global e-commerce demand, particularly in price-sensitive segments. Key focus areas include user growth, cross-border expansion, and margin trends, which will indicate the strength of consumer activity and the company’s ability to scale efficiently in a competitive environment.
- Cintas Corporation (CTAS) – This report serves as a direct indicator of business activity and employment conditions. Analysts will monitor revenue growth tied to workplace services, as well as client retention and expansion trends. Any slowdown could signal reduced corporate spending and weaker labor demand.
- Paychex, Inc. (PAYX) – As a payroll and human capital management provider, Paychex offers real-time insight into hiring activity and wage trends. Investors should focus on client growth, payroll processing volumes, and guidance on small and medium-sized business conditions, which are critical for assessing labor market strength.
- JBS N.V. (JBS) – The company’s earnings will provide a global view of food demand and supply chain cost pressures. Key metrics include pricing power, input cost management, and export demand trends, all of which are essential in understanding how inflation and global consumption patterns are evolving.
From our perspective at Zaye Capital Markets, the combined earnings landscape highlights a clear divergence between sectors under demand pressure and those benefiting from operational efficiency or structural demand. Analysts should prioritize forward guidance, margin sustainability, and demand signals, as these will ultimately determine whether the broader economy is stabilizing or transitioning into a slower growth phase.
Stock Market Overview – Wednesday, 25 March 2026
U.S. equity markets are attempting to stabilize after recent volatility, but underlying sentiment remains cautious as investors digest persistent inflation pressures, elevated borrowing costs, and ongoing geopolitical uncertainty linked to energy markets. While short-term relief has emerged from easing tensions, the broader macro backdrop continues to limit upside momentum. At Zaye Capital Markets, we see a market that is stabilizing on the surface, but still lacks the depth and conviction required for a sustained rally.
Stock Prices
Economic Indicators and Geopolitical Developments
The market tone today reflects a delicate balance between improving sentiment and structural risks. Recent economic data continues to point toward slowing growth momentum, particularly in services activity and labor indicators, while rising labor costs are keeping inflation elevated. This combination reduces the likelihood of near-term policy easing, keeping financial conditions tight. At the same time, energy market uncertainty remains a key driver of inflation expectations, meaning markets are highly reactive to both economic data and geopolitical developments.
Latest Stock News
- $NVDA | Nvidia briefly spiked in late trading as its CEO revealed expectations of more than $1 trillion in purchase orders for its next-generation AI chips through 2027, while also signaling a likely pullback from direct investments in major AI labs once they go public.
- $PLTR | Palantir shares rose about 7% after being selected by a major financial regulator for a three-month pilot using its Foundry platform, while also partnering with Anduril to develop software for a next-generation missile defense project.
- $META | Meta granted senior executives new stock awards as part of efforts to retain top talent amid intensifying competition in artificial intelligence and technology sectors.
- $ARM | Arm introduced its first data center chip, marking a direct challenge to established players in the AI infrastructure space as competition intensifies.
- $AMZN | A major hedge fund significantly increased its Amazon stake by over $2.5 billion, bringing total exposure above $3.2 billion, while also expanding its position in Nvidia as part of a broader AI-focused strategy.
- $HIMS | Hims & Hers announced a strategic collaboration with Novo Nordisk, ending prior tensions and enabling the offering of branded weight-loss treatments on its platform starting at $149 per month.
- $PAYX | Paychex is set to report earnings with expectations of strong revenue growth driven by artificial intelligence integration and client retention strength.
- $PDD | PDD Holdings is among the most closely watched earnings releases, with investors focusing on global e-commerce demand and platform expansion trends.
- $CTAS | Cintas is scheduled to report earnings as part of this week’s key business services updates, offering insight into corporate activity and employment conditions.
- $GOOGL | Alphabet has seen mixed performance alongside other mega-cap names, with investor sentiment impacted by rising scrutiny over AI spending efficiency.
- $TSLA & $AAPL | Both Tesla and Apple were among positions reduced by a major tech-focused investment fund in prior quarters, reflecting a shift toward higher cash allocations amid valuation concerns.
The Magnificent Seven and the S&P 500
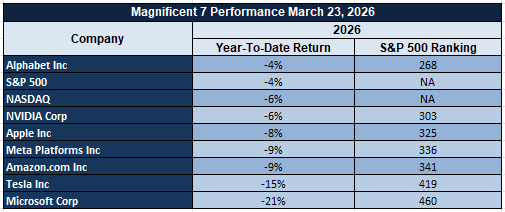
The Magnificent Seven — Apple, Microsoft, Nvidia, Amazon, Meta, Alphabet, and Tesla — continue to dominate overall market direction, but they are also a key source of pressure. While Nvidia has led gains due to strong AI demand expectations, other names like Alphabet and Tesla are facing increased scrutiny around spending, margins, and growth sustainability. This divergence is creating instability within the group, and because these stocks carry significant weight in the S&P 500, their weakness continues to limit broader index performance. The market remains heavily dependent on this group, and without broader participation, upside momentum is likely to remain constrained.
Major Index Performance as of Wednesday, 25 March 2026
- S&P 500: Trading at 6,606.49, down 0.27%, reflecting continued pressure from inflation concerns and sector concentration.
- Nasdaq Composite: Trading at 22,091.00, down 0.28%, as weakness in mega-cap technology continues to weigh.
- Dow Jones Industrial Average: Trading at 46,021.43, down 0.44%, showing mild weakness despite rotation into defensive sectors.
- Russell 2000: Trading at 2,495.00, up 0.65%, indicating relative resilience in small-cap stocks.
At Zaye Capital Markets, we maintain a selective approach. While headline indices appear stable, underlying weakness and concentration risk remain key concerns. Investors should continue to focus on quality, earnings visibility, and balance sheet strength while closely monitoring macro data and market breadth for confirmation of a more durable trend.
Gold Price: How Do Inflation Data and Geopolitical Risks Shape Gold Price Trends?
Spot gold is currently trading near $4,573.60 per ounce, reflecting a market that continues to price in elevated uncertainty despite shifting geopolitical signals. At Zaye Capital Markets, the latest developments around active negotiations with Iran, alongside statements suggesting potential de-escalation, are reducing immediate safe-haven urgency. However, ongoing military positioning, uncertainty surrounding the Strait of Hormuz, and the absence of a confirmed resolution are keeping a structural risk premium embedded in gold. This explains why prices remain elevated rather than correcting sharply. At the same time, today’s key economic triggers—particularly inflation data and central bank communication—are critical. A higher-than-expected inflation print would likely push yields higher, increasing the opportunity cost of holding gold and potentially leading to short-term consolidation. In contrast, softer inflation data or a more accommodative policy tone would weaken currencies and support gold further, reinforcing its role as a hedge in an environment where real returns remain uncertain.
At the same time, yesterday’s economic data continues to reinforce the underlying drivers behind gold’s strength. The upward revision in labor costs alongside slowing productivity signals persistent inflation pressures without corresponding efficiency gains, while weakening activity indicators suggest that economic momentum is softening. This combination creates a powerful but conflicting backdrop—one that supports gold as a hedge against inflation and economic uncertainty, while also introducing resistance through elevated interest rates. The result is a market where gold is not reacting to a single catalyst but rather holding firm due to overlapping risks across inflation, growth, and geopolitics. As long as this imbalance persists, gold is likely to remain supported at elevated levels, with its next major move depending on shifts in real yields, confirmation of policy direction, and whether geopolitical tensions fully resolve or re-escalate.
Oil Prices: Why Are Oil Prices Volatile Amid Geopolitics and Inflation Data?
Oil is currently trading with heightened volatility, with WTI crude at $88.72 per barrel and Brent crude at $99.77 per barrel, reflecting a market caught between easing geopolitical headlines and persistent structural risks. At Zaye Capital Markets, recent developments around negotiations with Iran and signals pointing toward a possible de-escalation have introduced short-term downside pressure, as markets begin to price in the potential return of disrupted supply. However, this is far from resolved. Continued military positioning, uncertainty around the Strait of Hormuz, and the strategic importance of this shipping route continue to embed a geopolitical risk premium in prices. Market commentary across macro desks highlights that even partial disruption in this region can significantly tighten global supply, which explains why oil has not corrected sharply despite improving headlines. At the same time, supply-side dynamics remain tight, with major producers maintaining disciplined output strategies and limited spare capacity, reinforcing a market structure where expectations drive price swings more than actual changes in supply flows.
At the same time, yesterday’s economic data and today’s upcoming releases are playing a decisive role in shaping oil sentiment through demand expectations and policy outlook. Rising labor costs and slowing productivity are reinforcing inflation pressures, which tend to support oil prices as energy costs feed directly into broader inflation trends. However, weakening activity indicators signal that economic momentum is cooling, which introduces downside risk to demand projections. Today’s inflation data and central bank communication are critical—if inflation comes in higher than expected, it could keep interest rates elevated for longer, slowing economic activity and capping oil demand, potentially leading to price consolidation. On the other hand, softer inflation data or a more accommodative tone would support growth expectations and lift demand outlook, providing upward pressure on prices. Additional guidance from global energy bodies continues to highlight tight inventories and supply discipline, limiting downside risks. This leaves oil in a highly reactive state, where prices are being driven by the interaction between geopolitical developments, macroeconomic data, and policy expectations rather than a single dominant factor.
Bitcoin Prices: Why Is Bitcoin Moving With Geopolitics and Inflation Data Trends?
Bitcoin is currently trading near $70,845, holding firmly above the key $70,000 psychological level as global markets react to a mix of geopolitical developments and shifting macro expectations. At Zaye Capital Markets, the latest sequence of statements pointing toward active negotiations with Iran, alongside signals of a temporary pause in escalation, has played a direct role in supporting Bitcoin’s recent strength. These developments reduced immediate global risk, triggering a “risk-on” rotation where capital flowed back into higher-risk assets such as cryptocurrencies. This explains the rebound and stabilization above $70,000, supported by derivatives positioning, short liquidations, and renewed institutional attention. However, the backdrop remains fragile. Continued military positioning, uncertainty around energy routes, and the absence of a confirmed resolution mean sentiment can reverse quickly. As a result, Bitcoin is trading in a headline-sensitive environment, increasingly moving in line with equities and behaving as a macro-driven asset rather than a purely independent hedge.
At the same time, yesterday’s economic data continues to influence Bitcoin through the liquidity and policy channel. Rising labor costs alongside slowing productivity reinforce inflation pressures, while weaker activity indicators suggest that economic momentum is cooling. This creates a dual dynamic—one that supports Bitcoin if markets begin to price in future easing of financial conditions, but also limits upside if interest rates remain elevated. Today’s economic data becomes critical in this context. A softer inflation print or a more accommodative central bank tone would likely support Bitcoin further by improving liquidity expectations and strengthening risk appetite. Conversely, stronger inflation data would reinforce tighter financial conditions, potentially capping gains as higher yields attract capital away from speculative assets. This places Bitcoin at the intersection of geopolitics, macro data, and liquidity expectations, where its next move will depend on how these forces evolve rather than any single driver.
ETH Prices: How Do ETF Flows and Whale Activity Shape Ethereum Price Trends?
Ethereum is currently trading near $2,163, holding within a relatively tight range as the broader crypto market stabilizes but fails to generate strong follow-through momentum. At Zaye Capital Markets, Ethereum’s price action reflects a market that is supported by improving risk sentiment but still constrained by uneven institutional participation. Over the past week, ETF-related flows tied to Ethereum exposure have shown a mixed pattern, with inflows during periods of optimism offset by outflows as investors rebalance after recent price moves. This indicates that institutional demand remains present but lacks sustained conviction, preventing Ethereum from establishing a clear upward trend. Unlike Bitcoin, which is benefiting from stronger positioning and broader market leadership, Ethereum continues to trade as a secondary allocation, reacting to overall crypto sentiment rather than driving it. This dynamic keeps Ethereum supported at current levels but limits the potential for a sharp breakout unless stronger capital inflows emerge.
At the same time, whale activity is playing a defining role in shaping Ethereum’s short-term direction, reinforcing a market that is active but not yet trending. Recent on-chain data shows that large holders are strategically accumulating during periods of price weakness while distributing portions of their holdings into rallies, creating a balanced but volatile structure. This pattern suggests positioning rather than exit, with large players preparing for future moves while managing risk in the current environment. Additionally, notable transfers between exchanges and private wallets point to ongoing repositioning rather than aggressive selling pressure, which helps maintain stability but caps upside momentum. Combined with yesterday’s macro data showing persistent inflation pressures and slowing economic momentum, Ethereum remains sensitive to shifts in liquidity expectations and broader financial conditions. If institutional inflows begin to strengthen and whale accumulation outweighs distribution, Ethereum could build momentum; however, if macro conditions tighten further, the asset is likely to remain range-bound as investors balance opportunity with caution.
