Where Are Markets Today?
On Friday, September 12, 2025, European and U.S. stock futures are tentative, reflecting investor ambivalence ahead of the Federal Reserve’s interest rate announcement later in the week. Futures on top U.S. indices, i.e., the S&P 500, Dow Jones Industrial Average, and Nasdaq 100, are near the flatline, reflecting investors taking a wait-and-see approach. European futures are mixed, some indices up fractionally and others unchanged, as markets continue to absorb recent economic figures and geopolitical developments.
One of the main drives behind that defensive market approach is the recent U.S. economic data. August’s Consumer Price Index (CPI) rose 0.4% month-over-month, slightly higher than the forecasted 0.3%, indicating inflationary pressure is ongoing. The year-over-year CPI, however, stuck at 2.9%, as forecasted. The more important data was that weekly jobless claims spiked to 263,000, the largest level since October 2021, indicating possible softening within the labor sector. The mixed signs have prompted investors to believe that the Federal Reserve would choose a rate cut during its next meeting, hoping to stimulate economic growth amid weakening employment signs.
In Europe, economic signs are better. Recent figures point to stabilisation in key economies, with rates of manufacturing increasing fractionally and consumer confidence increasing. Despite that, geopolitical threats, and those from trade policy and energy security particularly, continue to be a danger to the economic recovery. Investors are looking at those developments very closely, and a turn for the worse would depress investor confidence and economic growth prospects on the continent. Overall, the mixed European and U.S. futures are a result of a balance between favorable economic data and inflation and geopolitical risks. Volatility in markets is likely to continue leading up to the Federal Reserve interest rate decision next Wednesday as investors await central banks’ likely approach to the complex economic situation.
Main Index Performance Up to Thursday, September 11, 2025
- S&P 500: Trading at 5,841.52, up 0.8% on the day.
- Nasdaq Composite: Currently at 18,220.78, up 0.7%, led by gains in technology stocks.
- Dow Jones Industrial Average: up 1.4% to 46,000, propped up by the financial and industrials.
- Russell 2000: Flat at 2,378.01, underperforming due to rate sensitivity in small-cap equities.
The Magnificent Seven and the S&P 500

The “Magnificent Seven”—Apple, Microsoft, Nvidia, Amazon, Meta, Alphabet, and Tesla—are showing signs of fatigue. A recent sector breakdown shows the group averaging a drawdown of over 18% from their recent highs, with Tesla and Meta leading the decline. This signals a valuation recalibration, especially in AI-driven growth stories that have run ahead of fundamentals. The S&P 500 remains under pressure as tech leadership wavers. While energy and industrials are offering some support, the index is unlikely to rally sustainably without renewed participation from its core mega-cap drivers.
Drivers Behind the Market Move – Friday, 12th September, 2025
In Asian markets due to open on Friday, September 12, 2025, investor sentiment has been shaped by a combination of current economic data, political developments, and central bank expectations. European markets are optimistic, while U.S. futures are close to the flatline as investors temper expectations ahead of a potential interest rate hike at the Federal Reserve later in the week.
1. Mixed Economic Data Fuel Cut-Rate Speculation
U.S. economic figures reported in the week have been mixed, and as such, markets have been in a state of indecision. The Consumer Price Index (CPI) for August climbed 0.4% on a month-to-month basis, a slight increase above the estimated 0.3%, reflecting continuing inflationary pressures. The year-to-year CPI, however, remained at 2.9%, within expectations. The larger story, though, was that weekly jobless claims increased to 263,000, a level that was seen in October 2021 and signaling possible weakening in the labor category. The mixed indications fanned speculation that the Federal Reserve may deliver a rate cut in its next meeting, aiming to spur economic growth with hints that jobs are softening.
2. Comments by Trump Impact Political Perception
President Trump’s latest remarks at the 9/11 event have attracted a host of reactions, with reverberations for various areas, such as financial markets. His posthumous conferment on Charlie Kirk of the Medal of Freedom as a “champion of liberty” has the effect of reinforcing current political alignment and polarisation. The use by Mr. Trump of such language has the effect of activating his base, especially junior right-wing supporters, while at the same time indicating a continuing desire to lead the charge for rightwing causes. The political rhetoric may impact voter attitudes, particularly in pivotal swing states, and may affect market activity in politically sensitive areas.
3. Managing Geopolitical Risks in European Markets
In Europe, economic indicators are brighter, and recent data indicated that core economies stabilized. Manufacturing output is increasing at a moderate rate, and consumer confidence is improving. However, geopolitical risks, particularly those surrounding trade policy and energy security, continue to pose a threat to the economic recovery. Investors are vigilant and concerned that a sharp escalation would be negative for market attitudes and economic growth prospects on the continent.
Overall, the mixed European and U.S. futures are a result of balancing economic optimism versus inflation, jobs, and geopolitical concerns. As investors are hoping for the Federal Reserve to make their interest rate announcement later in the week, financial markets are set to be volatile and markets are eager to see central banks navigate a fragile economic outlook.
Digesting Economic Data
The TRUMP Tweets and Its Implications
President Trump’s recent comments during the 9/11 ceremony have sparked a range of reactions, with both symbolic and practical implications for various sectors, including financial markets, public sentiment, and even geopolitical concerns. One of the central focuses of his remarks was the posthumous awarding of the Medal of Freedom to Charlie Kirk, a prominent conservative voice, whom Trump described as a “champion of liberty” and a “giant of his generation.” This act of honoring Kirk, combined with Trump’s proclamation that his legacy will resonate especially among young people, serves to reinforce the ongoing political alignment and polarization in the country. By positioning himself as a protector of American values, Trump’s rhetoric aims to galvanize his base, particularly younger conservative supporters, while also signaling a continued commitment to championing right-wing causes.
Moreover, Trump’s focus on the legacy of Charlie Kirk and his endorsement of nonviolent responses to Kirk’s assassination—despite his previous strong rhetoric against the “radical left”—reflects the ongoing tension in the nation’s political discourse. Trump’s call for peace amid this tragedy, even as he emphasizes the need to stand firm against radical ideologies, suggests a nuanced strategy in responding to domestic challenges and maintaining his image as a strong but responsible leader. This could influence voter sentiment, especially in key swing states where the political divide remains stark. Investors, particularly in sectors sensitive to political rhetoric, could see fluctuations in market behavior based on Trump’s influence in shaping political narratives.
Trump’s comments also echoed strong themes of resilience, particularly when he reiterated the vow to never forget the September 11, 2001, attacks and honored first responders and military personnel. His proclamation of September 11, 2025, as Patriot Day serves as both a remembrance of national sacrifice and a strategic effort to rally patriotism during a politically charged period. The act of lowering flags to half-staff, combined with his reminder of America’s unwavering resolve, may also resonate with the stock market, particularly in sectors tied to national security and defense. It aligns with broader market sentiment around stability and patriotism, potentially impacting companies in the defense, infrastructure, and security sectors.
In the geopolitical context, President Trump’s framing of national sacrifice and strength is poised to influence market sentiment as global tensions, particularly with adversaries like China and Iran, persist. As markets often react to political developments, Trump’s rhetoric could shift investor expectations, especially within industries sensitive to international policy. As the nation approaches the 2025 presidential election cycle, these remarks may strengthen his position among his base, creating ripple effects throughout the broader political landscape. How these dynamics play out in the stock markets, particularly in sectors like defense, technology, and energy, will be crucial to monitor as political volatility often correlates with shifts in market behavior.
US Household Net Worth Boom and Wealth Disparities
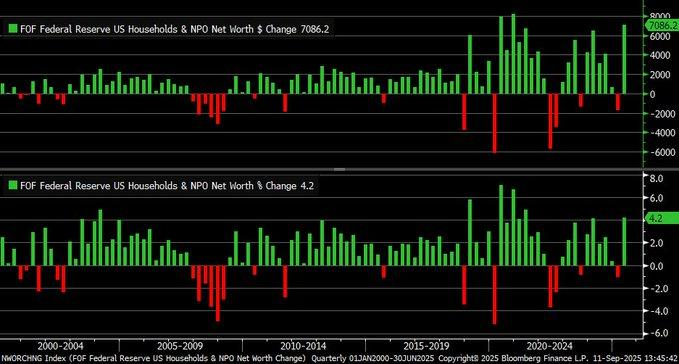
In Q2 2025, net worth for U.S households increased by $7.086 trillion, a stellar growth that surpassed the $6.5 trillion increase recorded in Q4 2020. This increase, which mainly results from higher asset prices, such as stocks and property, is an indication of robust recovery within the financial sector. Nevertheless, if the distribution of wealth were analyzed, it will be apparent that the advantage is never evenly enjoyed. Federal Reserve statistics imply that the bottom 80% of households within the United States can record minimal growth because the concentration of affluence continues to favor the higher tiers of the social hierarchy. As analysts, we must therefore scrutinize critically the effect of the foregoing trend upon spending within the retail and discretionary sectors because these sectors register significant importance based on the expenditure recorded by middle and poorer households. Stocks such as Costco and Walmart, who target such households, could record dampened growth if the imbalance in affluence continues.
In historical context, the latest wave of net worth provides a striking contrast with the subprime mortgage crisis of 2007-2009, where net worth for households decreased by $13 trillion, or 20%. The recent vulnerability of housing markets the past highlights the strength of the contemporary recovery but also warns of prudence. Analysts must look beyond the short-term fiscal impact of asset bubbles, including property bubbles, where appreciation of property prices can lead to unsustainable growth unless supported by earnings growth and wage growth. In the cases of Realty Income Corporation or Zillow, analysts need to be especially vigilant for signs of overheating markets or housing markets’ correction. 2022 Federal Reserve Survey of Consumer Finances also provides more insight into the lopsided nature of the growth in the nation’s wealth. According to the survey, net worth growth favors older households and those who are paying off debt, and the 4.2% quarterly growth tends more to reflect appreciation of assets than general increases in incomes. This means that the Q2 2025 increases in reported wealth could not directly translate into general prosperity for the economy but more of a concentration of the benefits among narrow groups of the population. Investors should be on the lookout for signs the pattern could spill over and impact aggregate consumer confidence and spending ability. Stocks among those industries that serve the more affluent older demographics like Lowe’s and Home Depot could be the winners, and those with broader target markets could lose out if the inequality of the nation’s wealth continues an upward trajectory.
Supercore CPI and Inflation Patterns
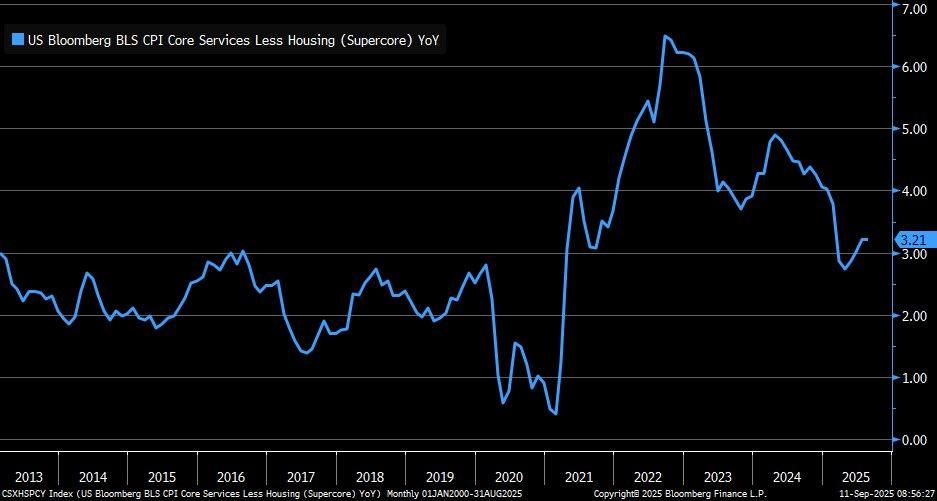
In August of 2025, the “Supercore CPI” (non-housing core services) remained steady at an annual pace of 3.21%, an indicator of prime importance watched by Federal ReserveChair Jerome Powell. This reading has been identified as an essential gauge for gauging the persistence of inflation, especially since it gauges the price pressures within non-housing services that can dramatically affect the behavior of consumers. Powell’s particular interest in supercore inflation highlights its significance for charting tomorrow’s monetary policy moves. Stasis in supercore inflation, though steady, implies that inflationary pressure continues to be deeply entrenched, even though core goods inflation merely increased by 0.13% for the month of August. To analysts, it may mean the Fed can turn more cautious and maintain rates higher for longer than markets expect as the broader disinflationary trend begins to materialize.
Latest information reveals a striking difference between supercore services inflation and other sectors of the economy. The growth in the price of supercore services, such as healthcare and transport, eased to 0.33% in August from the previous month’s 0.48%, and shelter and housing prices relentlessly went up, inching up by 0.4% month-to-month. This reveals that although there is some relaxation of inflationary pressure in some services, the persistent surge in shelter prices continues to be an influential stimulator of overall CPI rises. Market analysts should be keenly watching the shares related to housing, for example, Realty Income Corporation and Zillow, since additional increases in shelter prices could increasingly dampen consumption spending, more for lower and middle-income households. In comparing these trends to the Eurozone, inflationary pressures are also being determined by services, although regionally divergent. The Eurozone’s inflation level has registered a sharper decline in core inflation, which was partly motivated by a slower pace of energy prices and a less lasting increase in housing prices than the United States. The Eurozone’s latest inflation level is at 3.5%, slightly higher than the United States’ supercore CPI, and the cost of services accounts for most of it. This inflationary trend divergence implies that the Eurozone could experience different monetary policy and growth problems, and the United States could need to be more cautious with its rate-setting policy, particularly since housing and service-related inflation are ongoing.
Food and Energy Price Trending
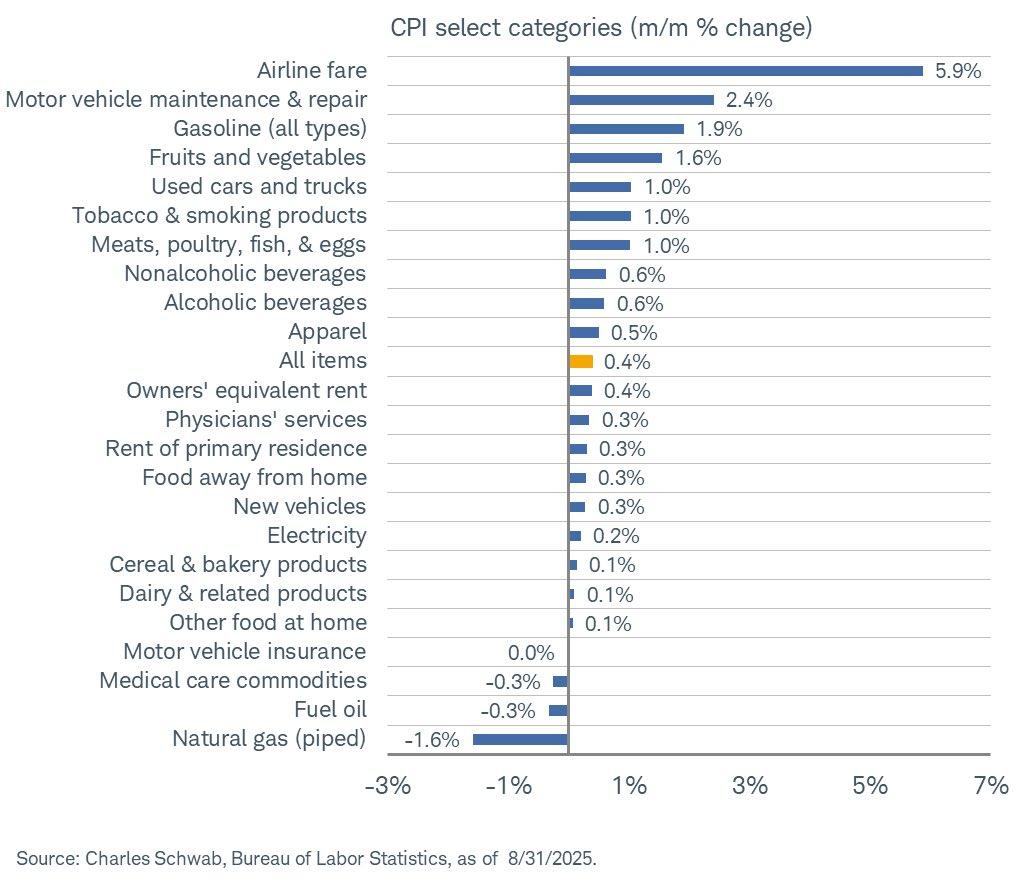
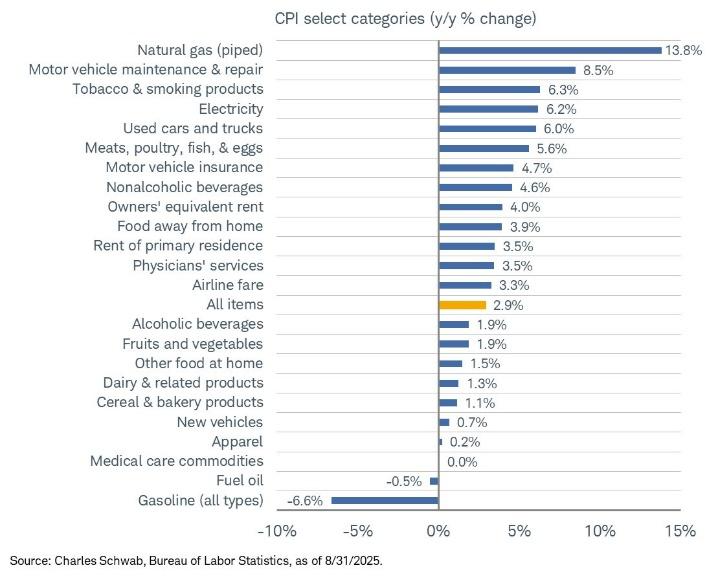
August 2025 CPI data shows an alarming 4.6% year-over-year jump in the prices of foodstuffs, with meats, poultry, fish, and eggs rising by 5.6%. This jump can be attributed mainly to the disruption of the supply chains, primarily the 2024 outbreak of the avian flu, which decreased the production of eggs by 10%, the USDA reported. Supply chain disruptions like these put upwards pressure on the prices of food items, especially the staples such as eggs, which are the main target for analysts studying the movement of prices among consumers. Ongoing firming up of delivery channels for food could mean ongoing inflation of prices for food items, impacting the ability of consumers to purchase items. Investors need to track stocks related to the beverage and food sectors like General Mills or Tyson Foods for signs of rising costs, which can translate into pressure on margins if suppliers are not able to turn the rising input costs into higher selling prices.
In addition to the food price increases, monthly CPI data shows a 0.4% rise in overall prices, driven by a sharp 2.4% spike in airline fares and a 1.9% increase in alcoholic beverages. This suggests that travel demand recovery and shifting consumer preferences are contributing to higher inflation in the leisure and hospitality sectors. A 2023 Federal Reserve study indicated that leisure spending often correlates with CPI fluctuations, which points to potential future volatility in consumer prices, especially if demand for travel and experiences continues to surge post-pandemic. Analysts should monitor stocks in the travel and hospitality sector, such as Delta Airlines and Booking Holdings, for signs of continued inflationary pressures driven by consumer demand. On the energy front, natural gas prices decreased by 1.9% month-to-month, a rare deflationary reading for energy prices. The drop can be blamed on a mild summer for the year 2025, which reduced the consumption of heating and weakened natural gas prices, the Energy Information Administration said. The drop goes against the narrative of sustained energy-driven inflation and gives a breather for consumers, particularly industries whose businesses are quite energy-intensive. The trend can impact the energy share forecast for analysts, and shares like ExxonMobil and Chevron can experience pressure on profits if the prices for natural gas stay lower throughout the autumn and winter months. Secondly, the deflationary reading can be an early sign for broader energy market stability and would be bullish for inflation outlook for the future.
Joblessness and Labour Market Reallocations
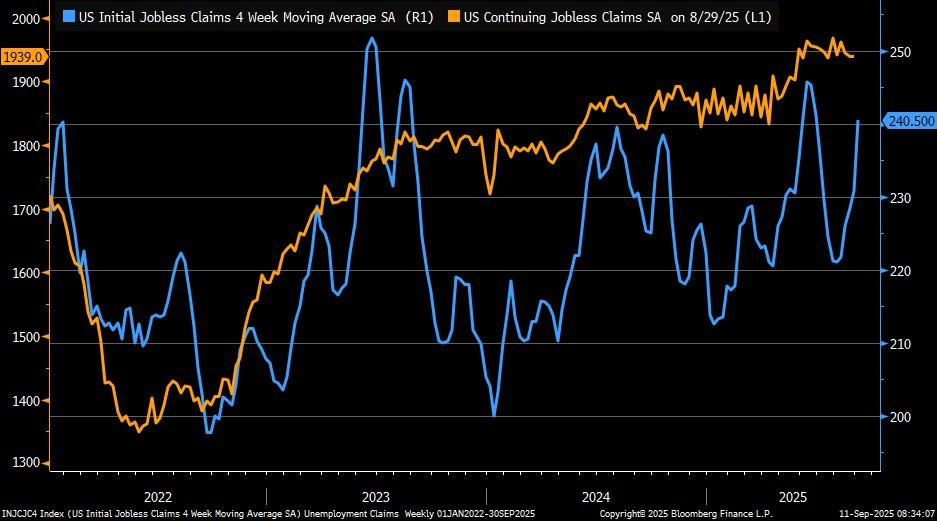
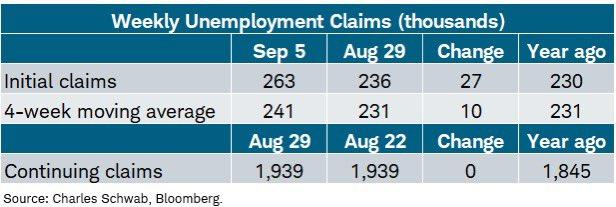
The US jobs market appears to be experiencing a cooling period as initial jobless applications jumped for the week up to September 5, 2025, hitting 263,000 versus the estimated 235,000. The surge, combined with the four-week moving average hitting 241,000, is a sign that the labor market might be tested by upcoming stressors. Though initial applications remain relatively light compared to historical levels, the upward trajectory signifies potential headwinds, especially among sectors hurt by ongoing global economic reconfigurations, such as the US-China trade disputes. A slow labor market might relieve wage pressure, which would facilitate the fight versus inflation. The development might prompt analysts to make growth projections more optimistic and interest rate cuts more probable if the labor market declines further.
Regional differences in jobless claims further highlight the overall labor market cooling trend. Texas increased by 15,300 claims, and New York decreased by 3,500. This deviation confirms results of a National Bureau of Economic Research analysis released in 2023, where the authors indicated that regional industrial output declines frequently accompany increases in jobless claims. As the different industries experience diversified amounts of strain within the economy, analysts need to focus specifically on industries prone to global supply chain disruptions. Manufacturing sectors and industries reliant on trade, especially those most affected by international commerce within their region, may experience continuing cuts in jobs. Firms such as Caterpillar and Boeing, which are heavily reliant on manufacturing and international commerce, need to be tracked for signs of slowing down. In light of these labor market developments, the Federal Reserve could increasingly be pressured into easing off its existing restrictive stance and embracing a more neutral or even dovish stance itself. As the inflationary pressures overall have been relatively contained, as we can see from the recent CPI reading that indicated just a 3.98% year-to-date increase in underlying inflation, the Fed could potentially make some leeway for itself in the monetary policy arena. This would ease up on both businesses and consumers and could be especially welcome if external shocks, such as the ongoing U.S.-China trade war, are continuing to impact growth back home. Planners should be on their guard, however, since any policy change by the Fed could reverberate broadly across asset classes and especially those that are interest-rate sensitive like the Real Estate Investment Trusts (REITs) and utilities.
U.S. Rent Growth and Housing Market Dynamics
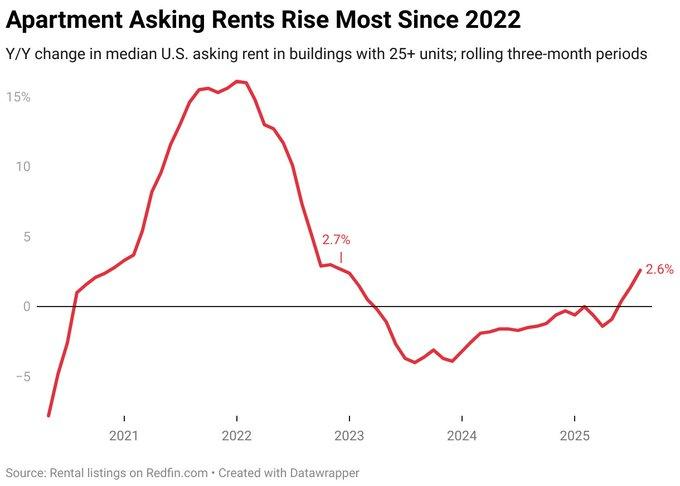
The 2.6% year-over-year jump in US apartment asking rents through August 2025, reported by Redfin, is the largest since December 2022. The increase is the result of a decline in apartment building, as seen through the rolling three-month median of listings within buildings of 25+ units. This signal is an indication that the prolonged housing shortage, especially within rental markets, continues to push rents upward despite more moderate growth or cooling signs reported by other trackers like CoStar and Yardi. Redfin’s data, based on new listings only, can be reflecting demand spikes occurring within high-supply markets and thus reflecting regional differences for rent growth. The fundamental point for analysts is that higher rents, especially within markets where the combination of high demand and constrained supply is pronounced, can be one of the drivers of the inflationary signs being experienced within the broader economy.
This increase in rents also corresponds with overall inflationary indicators since, according to a Federal Reserve study released in 2023, rent growth frequently leads broader increases in prices and thus the recent increase is an interesting indicator for the direction of inflation. If rent continues to increase, it could stoke overall inflation, however, since housing expenses is one of the biggest sectors of the Consumer Price Index (CPI). For investors, it would mean that housing-related sectors like Realty Income and Apartment Investment and Management Company (AIV) would be demanded more and perform better, and other asset classes sensitive to inflation like consumers’ staples or utilities could experience an increase in costs if the housing and rental inflation continues. Considering historical context, rent growth increased dramatically in 2022 amid pandemic-era supply deficiencies, and although the April rents subsequently flattened throughout the nation, the recent increase could be indicative of a market adjustment. CoStar’s forecast for the completion of new units dropping by 30% from 2024 levels only serves to augment the supply-demand mismatch and make rent growth potentially more stubborn within specific high-demand locations. Strategists will want to monitor regional disparities continuing, since the rents might not temper evenly throughout the United States housing marketplace. Trends within the housing marketplace are shifting because the pace of construction drops, and shares associated with real estate and building stocks, such as Lennar Corporation and D.R. Horton, might suffer if the supply-demand mismatch continues.
U.S. Mortgage Refinancing Surge and Federal Reserve Policy Impacts
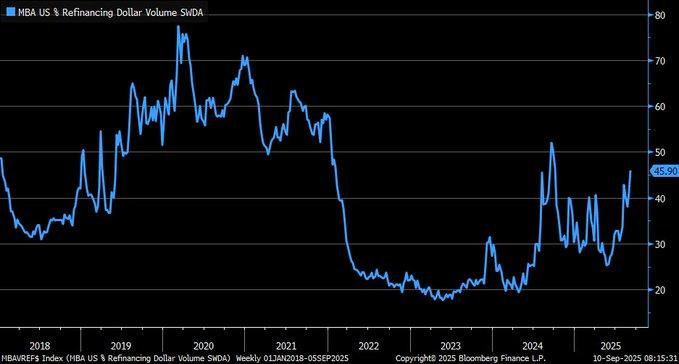
The recent surge in U.S. mortgage refinancing, reaching a 45.9% share of mortgage applications in September 2025, reflects a significant shift driven by the Federal Reserve’s rate cuts earlier this year. With mortgage rates now between 5% and 6%, many homeowners are seizing the opportunity to refinance. This spike mirrors previous refinancing booms, such as the $4.1 trillion peak in 2003 (inflation-adjusted), which was similarly driven by low interest rates. However, the current refinancing boom may also be driven by an uptick in cash-out refinancing, fueled by the $25 trillion in homeowner equity recorded in Q3 2021. Homeowners appear to be leveraging their home equity, possibly to mitigate broader economic pressures, including inflation and rising living costs. This trend may signal an increase in consumer spending, particularly in housing-related sectors, as homeowners tap into their equity for investments, home improvements, or debt repayment.
Historical context highlights the cyclical nature of refinancing surges. In previous cycles, such as in 2003, low rates helped stimulate economic activity by lowering monthly payments and increasing disposable income. A 2023 study in the Journal of Housing Economics found that refinancing spikes often led to a 30-40% reduction in monthly payments, driving economic growth. However, analysts must remain cautious, as the extension of loan terms (e.g., from 5 to 15 years) may offset some of the immediate savings, making the long-term financial benefits less impactful. As refinancing activity continues into 2025, it will be crucial to assess whether homeowners are opting for longer loan terms and whether these changes are contributing to sustained savings or potentially extending debt burdens.
The rise in refinancing activity could have mixed effects on the housing market. On the one hand, it offers homeowners greater financial flexibility, potentially boosting consumer confidence during periods of economic uncertainty. On the other hand, the increase in refinancing, particularly in markets with high home equity, could place further strain on housing supply and demand dynamics. Analysts should monitor for signs of overheating in housing markets, especially in areas where equity extraction is becoming more prevalent. As Federal Reserve policies continue to shape mortgage rates, the long-term effects on housing affordability and buyer behavior will be crucial to assess. Stocks linked to housing, such as Lennar and D.R. Horton, may face volatility depending on how these refinancing trends impact the demand for new homes and homeownership.
Upcoming Economic Events
Headed into an important week for American economic data, there are a number of significant reports that will impact sentiment and provide insights into the growth of the economy, the confidence of consumers, and inflation expectations. With GDP data, sentiment figures for consumers, and inflation expectations upcoming, the interest will be intense because these releases can make or break the intentions of the Federal Reserve and make or break the performance of the markets’ assets. Below is a rundown of what to expect and what impact the individual data could make on market behavior:
GDP m/m
The GDP growth figure is one of the most closely watched indicators of economic health.
- If the actual GDP growth exceeds forecasts, it would signal a stronger-than-expected economic performance, likely prompting a rally in equities as investors price in sustained growth. A robust GDP reading may lead to expectations of continued consumer spending and business investment, and could fuel speculation that the Federal Reserve will maintain a hawkish stance on interest rates to manage any inflationary pressures.
- On the other hand, if the GDP number comes in lower than expected, it could raise concerns about slowing economic activity, potentially prompting a risk-off sentiment in the markets. In such a scenario, stocks might pull back, bond yields could drop, and investors may seek safe-haven assets like gold or the U.S. dollar.
Prelim UoM Consumer Sentiment
Consumer sentiment is a significant indicator of economic confidence, and a surprise deviation from the forecast could have a disproportionate impact on sentiment within markets.
- If the consumer sentiment comes in stronger than anticipated, it could provide evidence of euphoria within the economy, supporting the case for continued spending and growth among consumers. This could boost equities, particularly those within the consumer discretionary sector, as well as stoke hopes for sustained demand within the overall economy.
- A lower-than-anticipated reading within the consumer sentiment index could, however, provoke concerns over dampened consumer confidence and could trigger risk asset pullback. In such a situation, markets would react with caution, and stocks could drop, along with defensive sectors like healthcare or utilities.
Prelim UoM Inflation Expectations
The UoM Inflation Expectations are significant for knowing the consumers’ perspective regarding the future direction of prices, and it directly affects the Fed’s inflation forecast.
- An inflation expectation reading higher than expected could trigger worry regarding the possibility of elevated price pressure, and the Federal Reserve could engage in more pronounced hikes. This could lead to higher volatility within the equities, particularly the growth sectors such as technology, since higher rates could squeeze valuations.
- In contrast, if the inflation expectations are lower than expected, markets could react positively, equities could surge, and the chances of cuts could increase since investors factor in a dovish Fed policy stance. In such a situation, growth stocks stand to win through reduced borrowing cost, and there could be a general market upswing since the concerns over inflation could subside.
STOCK MARKET PERFORMANCE
Index Gain Back April Bottoms, But Breadth Still Unbalanced
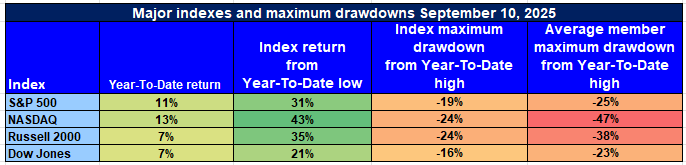
Zaye Capital Markets is vigilant for a continuance in U.S. equity markets recovering from April 8th, 2025 bottoms. The headline performance for core indexes is strong, yet underlying participation and drawdown data show continuing weakness. Investors should be attentive to patchy breadth and selective leadership in indices.
Here is our recap for the latest performance on leading indexes:
S&P 500: Robust Topline, Weak Bottom
YTD: +11% | From April low: +31% | Maximum drawdown: -19% | Average member drawdown: -25%
The S&P 500 has logged a reasonable 11% YTD performance and rebounded 31% from its April low. The 19% correction from its YTD high and average constituent decline of 25%, though, demonstrate that performance is bunched, with a huge number of constituents performing poorly.
NASDAQ: Spectacular Recovery with Cautious Notes
YTD: +13% | From April low: +43% | Maximum drawdown: -24% | Average member drawdown: -47%
NASDAQ outpaces all leading indexes by a 13% YTD and a torrid 43% spike from April bottoms. But its constituent average has dropped by 47% from top, illuminating the weakness behind its high-flying parts.
Russell 2000: Sharp Rebound, Lingering Skepticism
YTD: +7% |Apr 8 low: +35% | Maximum drawdown: -24% | Average member drawdown: -38% Despite a 35%-recovery in April, the Russell 2000 has gained a meager 7% for the year, a testament to continuing investor doubts about small-cap equities. The typical stock remains well underwater.
Dow Jones: Value Tilt Offers Relative Stability
YTD: +7% | Since April 8th low: +21% | Max drawdown: -16% | Avg. member drawdown: -23% Dow’s defensive tilt has delivered consistent, if unexciting, performance. The 7% YTD and narrowest -16% drawdown on a large-cap basis are a testament that investors are calling for quality and stability in earnings.
Zaye Capital Markets is disciplined and selective, preferring those companies that possess durable earnings and healthy balance sheets and looks at breadth indicators for signs that a bigger and more enduring rally is building.
STRONGEST SECTOR Among All THESE INDICES
Communication Services Continues Clear Market Leadership Throughout 2025
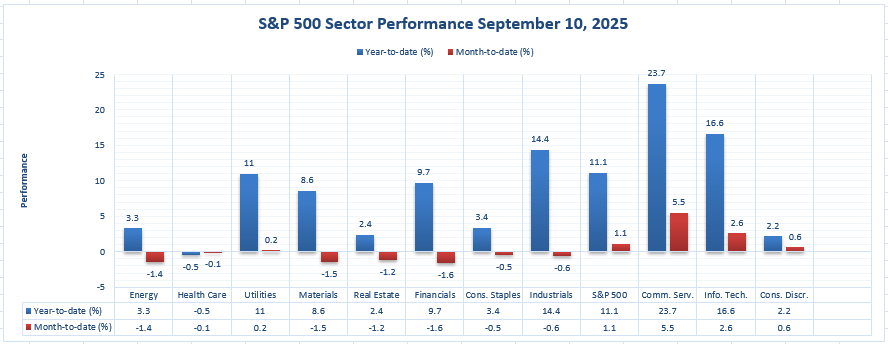
Zaye Capital Markets also monitors sector leadership as an indicator for underlying strength within the marketplace and rotation patterns. Ahead of 2025, thus far, Communication Services has been the leader outright on both year-to-date and month-to-date among the S&P 500 sectors.
Communication Services: Clear Sector Alpha
YTD Performance: 23.7% | MTD Performance: 5.5%
Driven by strong earnings and renewed investor enthusiasm for digital media and entertainment, Communication Services has logged a whopping 23.7% advance year-to-date—at nearly twice the rate of the S&P 500 itself (11.1% YTD). On a short-term basis as well, the group takes the lead, up 5.5% month-to-date, and top performer on both periods.
Other movers that drew notice were:
- Information Technology: 16.6%
- Industrials: 14.4%
- Utilities: 11.0%
Yet none approach the steady strength of Communication Services in both near and long-term periods.
Since sector leadership often pushes indices higher on a day-in-day-out basis, we believe Communication Services strength may provide necessary support to general market advances – and beyond a few mega-cap stalwarts – if and when breadth begins to flow. Zaye Capital Markets is overweight on this sector and keeps a close eye on valuation and earnings stability while macro environments shift.
Earnings
Earnings Recap: September 11, 2025
- Adobe Inc. (ADBE)
Adobe reported Q3 FY2025 earnings of $5.31 per share on $5.99 billion in revenue, surpassing analyst expectations of $5.18 EPS and $5.92 billion in revenue. The company highlighted a 21% year-to-date decline in stock price due to AI competition concerns but emphasized gains in enterprise AI adoption, with 99% of Fortune 100 companies utilizing Adobe’s AI tools. Adobe raised its full-year EPS guidance to $20.80–$20.85 and revenue guidance to $23.65–$23.70 billion, reflecting strong performance in AI-driven annual recurring revenue (ARR).
- Kroger Co. (KR)
Kroger reported Q2 FY2025 adjusted EPS of $0.91, up from $0.64 in the same period last year. Revenue for the quarter was $33.5 billion, slightly missing expectations. The company raised its full-year identical sales (excluding fuel) and EPS guidance, citing strong consumer demand and operational efficiencies.
- National Beverage Corp. (FIZZ)
National Beverage posted Q1 FY2026 EPS of $0.60 on revenue of $331 million, missing analyst estimates of $0.61 EPS and $336 million in revenue. Despite a record for the company, the results were impacted by a $2.1 million drop in interest income due to a special dividend in July 2024.
- Kestra Medical Technologies Ltd. (KMTS)
Kestra Medical Technologies reported Q1 FY2026 revenue of $19.4 million, a 52% year-over-year increase, surpassing expectations of $17.9 million. However, the company posted a net loss of $25.8 million, widening from a loss of $20.3 million in the prior year. Operating expenses rose to $37.7 million, reflecting investments in expanding the sales force and infrastructure.
Earnings Preview: September 12, 2025
- QuantaSing Group Ltd. Sponsored ADR (QSG)
QuantaSing is scheduled to report its Q4 and full fiscal year 2025 earnings on September 12, 2025, before market open. Analysts will be looking for updates on the company’s growth in the online education sector and any impacts from regulatory changes in China. Key metrics to watch include revenue growth, user engagement, and profitability trends.
- Barnes & Noble Education, Inc. (BNED)
Barnes & Noble Education is expected to report Q1 FY2026 earnings on September 12, 2025, after market close. Investors will focus on enrollment trends, textbook sales, and the performance of digital platforms. The company’s ability to adapt to the evolving education landscape, including the shift to online learning, will be critical factors influencing its financial performance.
- OFS Credit Company Inc. (OCCI)
OFS Credit Company is anticipated to release its Q3 2025 earnings on September 12, 2025, before market open. As a closed-end fund investing in collateralized loan obligations (CLOs), key areas of interest will include net investment income, distribution coverage, and the impact of interest rate changes on its portfolio. Analysts will also assess the sustainability of its dividend payouts and any changes in the credit quality of its holdings.
- Golden Matrix Group, Inc. (GMGI)
Golden Matrix Group is expected to report its Q3 2025 earnings on September 12, 2025. Investors will be looking for updates on the company’s performance in the online gaming and eSports sectors, including user growth, revenue from gaming platforms, and any new partnerships or product launches. The company’s ability to scale its operations and maintain profitability in a competitive market will be key points of focus.
Stock Update – Friday, 12th September, 2025
U.S. stock markets closed at records on Thursday, September 11, 2025, due to expectations for a near-term Federal Reserve interest rate cut. The Dow Jones Industrial Average rose above 46,000 for the first time, while the S&P 500 and Nasdaq Composite closed at new highs. Investor optimism was supported by a combination of favorable factors, including a weakening labor market, low-key inflation data, and strong corporate earnings. Developments have fanned higher belief in the robustness of the economy and the chances that the Fed would ease monetary policy.
Stock Prices
Economic Indicators and Geopolitics Developments
The upward momentum in the market was also supported by the latest economic data. The CPI for August inched up 2.9% compared to a year ago, a slight gain from July’s 2.7%, but within the Fed’s target range. Additionally, jobless claims increased to their 2021 high, indicating a deteriorating labor marketplace. Consequently, investors were optimistic that the Federal Reserve would announce interest rate cuts later in the near term, continuing to spur gains in the market.
Recent Stocks News
- $OPEN Now Up Over 50%: Opendoor Technologies ($OPEN) took a massive leap upward by more than 50%, as the company’s business continues to bask in favorable times within the residential real estate space. Investors are once again becoming optimistic about the company’s platform that is increasingly being recognized for its revolutionary digital means of transacting in real estate.
- $TEM® Receives FDA Clearance for Next Generation Pixel Platform: Tempus ($TEM) has gained FDA approval for its latest Pixel platform, and with that comes the feature to produce T1/T2 cardiac MR maps on scanners that are not natively equipped to perform them. The development greatly increases the penetration for Tempus within the cardiac imaging segment, providing greater diagnostic value and putting the company in a position to continue growing within the healthcare tech sector.
- $HOOD Recently Published August Monthly Stats Robinhood Markets: ($HOOD) delivered robust August numbers, seeing platform assets reach above $304 billion, and cash sweep at $34 billion. Deposits and margin action rose into triple digits, indicating robust growth trajectory for the firm. As its base grows, Robinhood’s report likely means that the company is gaining speed on its “flywheel” effect, and that should drive more upside in the quarters ahead.
- $MSFT & OpenAI Celebrate Preliminary Agreement: Microsoft ($MSFT) and OpenAI have agreed on a tentative deal that would see Microsoft buy a $100 billion+ equity stake in the AI leader. The deal gives Microsoft actual ownership in a piece of OpenAI for the first time beyond their earlier alliance. As one of the most valuable pieces of AI intellectual property for the modern generation, the acquisition ensures Microsoft’s leadership at the forefront of AI development and use.
- $TEM Receives FDA Clearance for Enhanced Pixel Platform (Again): In another notable development, meanwhile, Tempus ($TEM) has also received FDA approval for its expanded Pixel platform that now has the ability to produce T1/T2 cardiac MR maps on non-native scanners as well. The feature-bolstered functionality is poised to expand Tempus’ penetration in the medical imaging marketplace, and has bright prospects for development within the healthcare tech segment.
The Magnificent Seven and the S&P 500
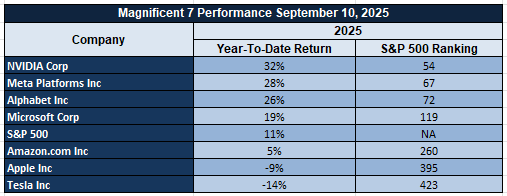
The “Magnificent Seven”—Apple, Microsoft, Nvidia, Amazon, Meta, Alphabet, and Tesla—are showing signs of fatigue. A recent sector breakdown shows the group averaging a drawdown of over 18% from their recent highs, with Tesla and Meta leading the decline. This signals a valuation recalibration, especially in AI-driven growth stories that have run ahead of fundamentals. The S&P 500 remains under pressure as tech leadership wavers. While energy and industrials are offering some support, the index is unlikely to rally sustainably without renewed participation from its core mega-cap drivers.
Main Index Performance Up to Thursday, September 11, 2025
- S&P 500: Trading at 5,841.52, up 0.8% on the day.
- Nasdaq Composite: Currently at 18,220.78, up 0.7%, led by gains in technology stocks.
- Dow Jones Industrial Average: up 1.4% to 46,000, propped up by the financial and industrials.
- Russell 2000: Flat at 2,378.01, underperforming due to rate sensitivity in small-cap equities.
Here at Zaye Capital Markets, we are seeing sector rotation and leadership from top performers in the markets during earnings season. Large-cap companies’ ability to maintain earnings growth amid Federal Reserve policy tightening expectations for the foreseeable future will be key to where broader equity markets head in the third quarter. As the marketplace seeks to contend with effects from prospective rate cuts and global tensions, a rebound in strength for the “Magnificent Seven” could be the key to holding up performance for the S&P 500.
Gold Price – Friday, 12th September 2025
As of September 12, 2025, gold is trading at approximately $3,637 per ounce, maintaining a strong position near record highs. This price surge represents a significant year-to-date increase of over 40%, highlighting gold’s role as a primary asset in periods of economic uncertainty. Gold has proven its appeal as an inflation hedge and safe-haven investment, particularly as broader economic factors such as cooling labor markets, moderate inflation data, and geopolitical tensions intensify. The recent Federal Reserve comments regarding potential rate cuts have made non-yielding assets like gold even more attractive, providing additional upside to the yellow metal. Furthermore, with continued fiscal policy uncertainty and trade tensions, gold’s status as a store of value only solidifies. Investors are increasingly looking to allocate into assets like gold that can weather macroeconomic volatility, and this shift is reflected in the precious metal’s impressive price performance. Gold’s resilience, even in the face of fluctuating equity markets and economic data, speaks to its role in global financial portfolios as a hedge against systemic risks. In the near term, the impending economic data releases, such as the GDP m/m, Prelim UoM Consumer Sentiment, and Prelim UoM Inflation Expectations, shall continue to influence market sentiment and possibly spur additional interest in gold. Should the GDP data be softer than anticipated, or inflation expectations be revised lower, that shall boost demand for gold as investors turn to a classic store of value amidst fears of economic slowdown. Meanwhile, geopolitical concerns and recent Presidential Trump statements, especially on domestic policy and national security, may stoke unease and thus bolster the demand for a safe haven like gold. With institutional investors such as Ray Dalio advising on gold exposure as a part of a diversified portfolio, the yellow metal is becoming increasingly central to long-term portfolios. From a technical perspective, gold is targeting resistance zones of $3,645–$3,650 per ounce, and a breach above such areas shall spur additional upswings in prices, while immediate support around $3,615 is a pivotal level for a possible price correction. Against the backdrop of the present economic outlook and general market uncertainty, gold shall continue its upward trajectory and be a leading asset in the near-term horizon.
Oil Prices – Friday, 12th September, 2025
Up to September 12, 2025, prices for oil have seen a downward correction, with Brent crude at $66.07 per barrel and West Texas Intermediate (WTI) at $62.06 per barrel. The fall has been facilitated by various reasons, some of which include increasing oil supply on a global level and apprehensions regarding frail demand. The International Energy Agency (IEA) lowered its projection for oil demand growth for 2025 on a worldwide level, which was revised to a mere 680,000 barrels per day, in light of sluggish consumption in leading economies. Emerging nations, especially China, India, and Brazil, are indicating reduced oil consumption, leading to the overall weakening demand situation. Meanwhile, the Organization of the Petroleum Exporting Countries (OPEC) has committed to increasing output, with the OPEC+ countries boosting output by 547,000 barrels per day in the month of September, essentially rolling back earlier production cuts. The resultant oversupply amid cooled demand creates massive selling pressure on oil prices and leads to a supply-demand imbalance. Geo-political considerations, for example, ongoing confrontations between Venezuela and the U.S., lead to additional uncertainty, as they are likely to disrupt vital oil supplies and push markets globally into greater volatility. President Trump’s most recent commentary and continuing economic data have also influenced market sentiment. Though his administration’s energy policies, i.e., deregulation and a turn towards U.S. energy dominance, have allowed for increased production in some segments, they have also allowed a level of uncertainty to the broader marketplace. U.S. shale producers, for instance, have a mixed outlook with some benefiting from such policies and others concerned with the viability of oil prices in the long-term with possible trade confrontations and policy changes. The Dallas Fed’s Energy Survey revealed growing concern among oil executives about how these mixed policy changes would impact future production and price strategies. Looking ahead, today’s economic data, i.e., the GDP m/m, Preliminary UoM Consumer Sentiment, and Prelim UoM Inflation Expectations, would be crucial in oil price direction. Better-than-projected GDP would be viewed as increased economic activity and possibly supporting oil demand, while lower consumer sentiment or lower inflation expectations would be viewed as economic softening and hence lower demand and lower oil prices. Marketers would be concerned with these data to understand the balance between supply and demand dynamics within the oil sector in the near-term.
Bitcoin Prices – Friday, 12 September 2025
On September 12, 2025, Bitcoin (BTC) is valued at close to $115,879, touching an intraday high and low of $116,312 and $113,509, respectively. This price action is a result of a 1.6% jump from the close prior, reflecting a buoyant market sentiment. The latest jump in the price of Bitcoin could be a result of various expectations, such as expectations for a Federal Reserve interest rate decrease, prompting investors to look at alternative assets, such as Bitcoin. Institutional demand for Bitcoin is also robust, with companies such as MicroStrategy continuing acquisitions of Bitcoin, indicating a belief in the long-term value for the cryptocurrency.
President Trump’s administration has also been behind the current Bitcoin market scenario. President Trump signed an executive order for creating the United States Strategic Bitcoin Reserve in March 2025. The U.S. thus became the largest known state holder of bitcoin, holding around 198,000 BTC in August 2025. The news has been well received by the markets, acting as a sign for institutional approval and acceptance for Bitcoin. Additionally, the government participation within the bitcoin ecosystem has provided greater regulatory clarity, thus increasing investor confidence. The favorable macroeconomic scenario, institutional onboarding, and favorable government policies cumulatively created a healthy backdrop for the appreciation in the value of Bitcoin.
Ethereum (ETH) Prices – Friday, September 12, 2025
On September 12, 2025, Ethereum (ETH) is at approximately $4,527.77, with a 3.57% jump from yesterday’s close. The rise in price for Ethereum is being fueled by both institutional buying and massive whale action, accumulating massive quantities of ETH. Recently, Ethereum whales have transferred more than $204 million in ETH to their portfolios, causing a steep price rise that has taken Ethereum above $4,400. Large holders’ accumulation tends to be a leading indicator for strong buying pressure and strong bullish outlooks, as whales are usually price movers in the cryptocurrency markets. Alongside whale action, Ethereum ETFs are becoming increasingly popular, recording $171 million in inflows and putting total assets in Ethereum spot ETFs at around $27.73 billion. The institutional buying illustrates growing relevance for Ethereum as a digital token, with large investors and institutions perceiving it as a core holding for their portfolios. The price increases are a result of a generalized feeling that has emerged regarding a bright outlook for the price for the long term for Ethereum, fueled by its dominant use in decentralized finance (DeFi), smart contract functionalities, and institutionalization. Whereas its outlook for the long-term is bright, the current market is still grappling with a few uncertainties, namely regulatory updates. The U.S. Securities and Exchange Commission (SEC) has just pushed decisions on a few Ether-related ETFs, such as BlackRock’s Ethereum staking ETF, to October 30, 2025. The lack of regulatory clarity has led to a short-term level of volatility and could impact market sentiment pending more decisions. Despite short-term hiccups, however, the outlook for the long-term for Ethereum is bright, and analysts are seeing price targets between $7,500 and $10,000 in the near term. The bright outlook is premised on increased institutional buying and growing development on the Ethereum ecosystem, particularly in areas such as DeFi and Web3, where the underlying blockchain is Ethereum. As Ethereum gains more share in these areas, coupled with current accumulation by the whales, the digital asset is well on course for massive price action pending lifting of regulatory barriers, cementing its spot as one of the most powerful and revolutionary assets within the digital economy.
