Where Are Markets Today?
Markets Today: Global stock futures are positioned to open lower as both U.S. and European investors brace for a pivotal week dominated by major corporate earnings and a key Federal Reserve policy decision. In the U.S., Dow Jones Industrial Average futures are down roughly 0.6%, while S&P 500 and Nasdaq‑100 futures have shed between 0.3% and 1.1%, reflecting heightened caution after a drag on sentiment over the weekend. This risk‑off tilt is mirrored in Europe, where indexes such as the Euro Stoxx 50 and DAX futures are modestly weaker ahead of the cash open, as investors weigh the same cross‑border pressures and upcoming catalysts. The collective pullback indicates a market that’s not just digesting data, but actively repricing downside risk ahead of important events.
The first key reason for this defensive positioning is the burst of macro and corporate risk hanging over markets. With more than 90 S&P 500 companies scheduled to report earnings this week, including mega‑caps such as Microsoft, Meta, Tesla and Apple, traders are reducing exposure ahead of what could be headline‑moving guidance and profit outlooks. Even strong beats in recent quarters haven’t guaranteed positive price reactions when guidance or margin outlooks disappointed, and markets are acting accordingly by favoring caution. This earnings uncertainty coincides with nervousness around the Federal Reserve’s policy stance, where a widely expected rate hold is not being treated as good news if the forward path for cuts appears pushed further out.
A second driving force is escalating geopolitical and trade risk, which particularly weighed on European futures. Recent tariff threats and diplomatic friction — especially around transatlantic relations and Greenland negotiations — have pressured risk assets globally, prompting safe‑haven flows and broader risk repricing. Notably, this tension hit European markets hard in recent sessions, with major continental indexes sliding as auto and luxury sectors, which are sensitive to trade barriers, saw increased selling pressure. As markets enter this week’s macro calendar, traders are balancing hopes for solid earnings with wariness that geopolitical headlines could amplify volatility.
Compounding these pressures, last week closed on a risk‑off note after geopolitical jitters and falling index momentum, leaving sentiment fragile going into Monday. Gold has surged to record levels as risk premiums rise, while equity futures attempt to find direction in thin trading. With the Fed’s meeting, the earnings slate, and ongoing trade uncertainty all concentrated in this week’s horizon, futures are pricing in a higher probability of volatility rather than calm. Investors are therefore adopting defensive positioning, trimming beta exposure, and waiting for concrete data before committing to directional bets.
Major Index Performance as of Monday, 26 Jan 2026
- Nasdaq: Trading at 23,501.24
- S&P 500: Trading at 6,915.61
- Russell 2000: Trading at 2,669.16
- Dow Jones: Trading at 49,098.71
The Magnificent Seven and the S&P 500

The concentration of leadership in the largest technology and AI-linked names continues to exert outsized influence on the S&P 500 and Nasdaq. With these names trading on ever-higher expectations for earnings durability, any signal of margin pressure or slower spend has an amplifier effect on headline indices. Until breadth improves beyond this narrow leadership, downside risk remains heightened should near-term earnings disappoint.
Drivers Behind the Market Move – Monday, January 26, 2026
As U.S. and European markets open the week, traders are reacting to a mixture of disappointing business sentiment data, elevated geopolitical noise, and the anticipation of critical economic decisions. These developments are steering investor sentiment across asset classes and regions, with several key drivers shaping today’s cautious tone in both equity and futures markets.
1. Weak German Business Confidence Weighs on Europe
The release of Germany’s latest ifo Business Climate Index revealed a drop in sentiment, falling to 87.6 — below both forecast (88.2) and the prior month’s reading (88.0). This underwhelming result signals fading optimism across Europe’s largest economy, with concerns mounting over industrial demand and broader regional stagnation. Equity futures across the eurozone opened softer in response, especially for cyclical stocks, as investors brace for prolonged slowdowns in manufacturing and trade momentum. The euro also slipped modestly as traders recalibrated rate expectations amid softer growth.
2. Fed Decision Looms and U.S. Data Remains Mixed
Market participants are preparing for Wednesday’s first Federal Reserve decision of the year. While no rate change is expected, all eyes are on the tone and forward guidance of the Fed’s statement. Traders are cautiously watching upcoming durable goods and core orders data this week for clarity on growth trajectory. These events follow a mixed earnings season — with strong beats from names like Meta and Microsoft expected — but high-profile disappointments from Intel and Netflix reminding markets that top-line beats don’t always translate into stock gains. The macro backdrop remains murky, leading to defensive posturing and suppressed volumes.
3. Trump’s Trade Threats and Fiscal Moves Add Volatility
Donald Trump’s fresh tariff warnings — including threats of 100% duties on Canada over alleged Chinese economic ties — have reintroduced geopolitical friction into the market narrative. Investors remain alert to rising unpredictability as trade policy, energy nationalism, and capital controls resurface as campaign talking points. Additionally, Trump’s Davos remarks on capping credit card rates, limiting institutional home buyers, and calling for crypto legislation have revived questions around financial market regulation in 2026. Traders are factoring in not just policy, but political risk, into their positioning — adding another layer of caution to today’s market tone.
In summary, markets today are absorbing weak European business signals, preparing for a pivotal week of earnings and monetary policy, and reacting to heightened U.S. political noise and global trade tension. This convergence of pressures is translating into lower futures and a risk-off stance as investors seek clarity across data, diplomacy, and domestic policy.
Digesting Economic Data
The TRUMP Tweets and Their Implications
This week’s barrage of Trump-led commentary at Davos wasn’t just loud — it was economically strategic. His blunt criticism of Europe’s green energy transition as “economically harmful,” paired with a vocal reaffirmation that oil and gas would remain the backbone of lower energy costs, sent a ripple effect across energy markets. Trump’s messaging signals a firm policy anchor toward fossil fuel dominance, effectively setting up a supply-heavy outlook for traditional energy commodities. That tone weakens green energy sentiment, fuels oil demand expectations in North America, and adds geopolitical tension in trade corridors — especially with Europe. Markets didn’t ignore it. Energy sector stocks saw renewed rotation, and oil prices bounced as investors interpreted these statements as a challenge to global ESG policy credibility and a subtle endorsement of hydrocarbon-backed economic recovery.
Beyond energy, Trump’s messaging triggered diplomatic turbulence that could reshape investor sentiment toward global alliances. The public withdrawal of Canada from his proposed “Board of Peace,” and the imposition of a 100% tariff threat over China-linked behavior, served two purposes: to isolate allies seen as economically unreliable and to consolidate U.S.-aligned trade control. For multinational corporations, this escalation injects fresh uncertainty into cross-border operations. Trump’s call for credit card interest rate caps and tighter control over institutional home buyers also resonated with populist themes, framing his agenda as anti-Wall Street and pro-household at a moment when mortgage rates and real estate inflation remain sensitive flashpoints. The implications stretch into real estate, fintech, and consumer credit — all areas with heightened investor scrutiny in 2026.
Meanwhile, Trump’s sharp statements on NATO participation, mass migration links to economic strain, and immigration enforcement in Minneapolis reflect a broader economic nationalism playbook. This is not just rhetoric — it’s a pretext for budget redirection, regulatory overhauls, and potential legal gridlock on Capitol Hill. The tension between federal agencies and state officials — especially in immigration enforcement — could force markets to reprice legal risk in real estate, labor, and security sectors. Trump’s insistence on pushing through controversial redevelopment plans, including the White House ballroom project, is emblematic of a governance style that prioritizes executive action over consensus, signaling volatility not just in policy but also in capital allocation.
Lastly, the crypto world wasn’t left out. Trump’s direct urge to Congress to act on crypto market structure reform sent a fresh wave of speculation into digital asset circles. While the comments stopped short of detailed legislation, they opened the door to potential rule-setting that could benefit compliant platforms and hurt shadow markets. Combined with institutional hesitation, ETF volatility, and broader macro softness, these comments may serve as a pivot point for long-term crypto infrastructure decisions. With Trump asserting dominance over the Davos agenda, the market takeaway is clear: brace for policy built on unpredictability, trade confrontation, and tightly controlled economic levers — all of which investors must now price into 2026 risk models.
Michigan Inflation View Cools, Risk Assets Watch
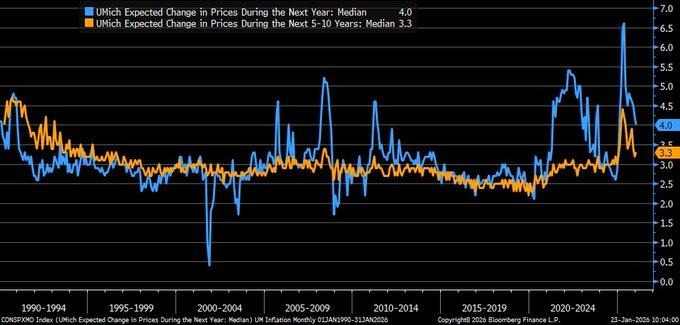
The University of Michigan’s most recent consumer survey, conducted in January 2026, provided a subtle yet important message that households have been adjusting their short-term expectations of inflation slightly lower. Households have lowered their expectations of inflation in the upcoming year by lowering their expectations of 1-year inflation to 4.0%, from 4.2%, and their expectations of 5-to-ten-year inflation to 3.3%, from 3.4%. Although the levels remain high, the fact that the expectations have eased slightly into lower levels can have implications, considering that expectations can influence the behavior of consumers in terms of what they spend, what they delay, and what wage pressures they demand in the market.
What’s noteworthy about this change is that inflation expectations are as much a confidence measure as they are a measure of inflation itself. If people believe that high inflation is going to continue, they’re more likely to ratchet up their demand, be more willing to pay high prices, and demand stronger wage growth—factors that can make inflation “sticky.” The fact that a downshift is occurring, even if small in degree, suggests that the psychology of high inflation may be easing, which can reduce the pressure on policy makers to remain aggressively tight. From a markets standpoint, that should generally support more stable bond markets and improve support for equity markets, at least in rate-sensitive sectors. However, we should not read too much into this survey—expectations can turn in a flash if energy prices reaccelerate or rents and food prices pick up again.
In this backdrop, we think that Amazon.com, Inc. (AMZN) is an attractive name in terms of its relative valuation in anticipation of a shift in inflation perception that will have a positive impact on demand and discount rates simultaneously. While a slight reduction in perceived risk of future inflation will allow normalizing consumption trends, thereby providing support to demand in essential consumption categories, it will also provide support to high-quality growth stories in an accommodating interest rate backdrop. Analysts should focus on trends in end-user consumption, trends in margins that reflect efficiency in fulfillment and logistical costs, and forward guidance on ad and cloud spends, which often serve as early indicators of macroeconomic health.
As The Mood of the Consumer Improves, Spending Risks Ease.
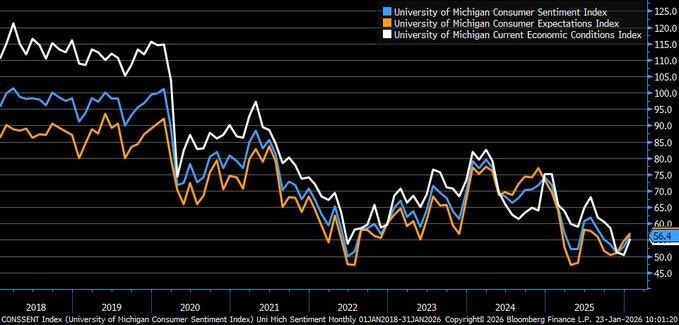
The University of Michigan Consumer Sentiment Index for January 2026 was revised upward to 56.4, increasing from its initial reading of 54.0 and showing an improvement from its low of 52.9 in December. This shows that consumers are feeling slightly less strained at the moment than they did just weeks ago. This was seen both with regard to the current economy and the economy moving forward, showing consumers are regaining some level of confidence with regard to their own financial situation. This said, the reading is still far removed from its pre-2020 peaks and therefore isn’t a story of a strong consumer but rather a less fragile consumer, and that is an important nuance.
The larger picture is that sentiment is stabilizing, having fallen year after year, while disruptions have become more prevalent. The issue is, however, that confidence is operating at a discount. This is, in some ways, where markets get mispriced, as consumers, while not feeling euphoric, start spending, creating an opportunity for businesses that are able to deliver value, convenience, and stability. On a larger scale, consumers are still an engine of growth, meaning even as sentiment stabilizes, there is less concern about recession, but this is an environment where volatility is still present, as any signs of increasing inflation, interest rates, or policy changes can reverse this.
Considering this backdrop, we view Walmart Inc. (WMT) as an undervalued opportunity from an existing consumer mindset. A slight improvement in consumer sentiment, which remains historically weak, still causes consumers to focus on “affordability,” which is a strong position for a high volume value retailer. We believe Walmart is well-positioned to benefit from a “cautious spend,” which can improve even more if a “stable spend” develops. Analysts should focus on same-store sales, traffic, and margin strength tied to discipline in inventories and supply chain management, which will ultimately determine whether this “stabilizing consumer” ultimately equates to better earnings strength or is simply a short-lived pop.
Flash PMI Expands, But Growth Loses Speed
January 2026 flash PMI readings show that, rather than continuing to accelerate in a clean, confidence-building manner, our economy is still growing, but no longer accelerating. Manufacturing increased slightly to 51.9, and Services remained steady at 52.5, still above that level that indicates an expanding economy. However, what is concerning to financial markets today is no longer concern over an economy that might contract, it is now what I call the ‘rate of change’ problem. What investors begin to wonder when an economy is still positive, but no longer accelerating, is what earnings momentum might still exist in that economy.
The trend on this chart continues to support this narrative, as we’ve seen factory activity stabilize at a level above contraction, but it still looks more like a recovery rather than a break-out. We’re seeing growth in new orders at a relatively low rate, which forces companies to defend margins. And then, of course, there is tariff-related cost pressure, which is an issue we’re seeing as a key risk, as it impacts profit margins as well as price points at an end customer. This is probably the toughest place for markets, as we’re seeing growth, but we’re not seeing low enough inflation to really give us a “policy relief” story.
Considering this backdrop, we view Caterpillar Inc. (CAT) as undervalued in relation to the shape of this economic cycle. As the manufacturing environment settles in without growth resuming, capital expenditures become more targeted in focus rather than growth-focused. For this reason, we view the environment as beneficial to companies like Caterpillar, where the focus is on “keeping projects moving” rather than resuming growth in infrastructure or industrial replacement demand. Analysts should focus on order trends, inventory levels, as well as forward commentary on how price is performing in relation to input costs, as the winners in the event that tariff-driven cost pressures resume will be the companies that manage to protect margins while keeping demand in check.
Corporate Guidance Hits 20-Year High, Optimism Builds
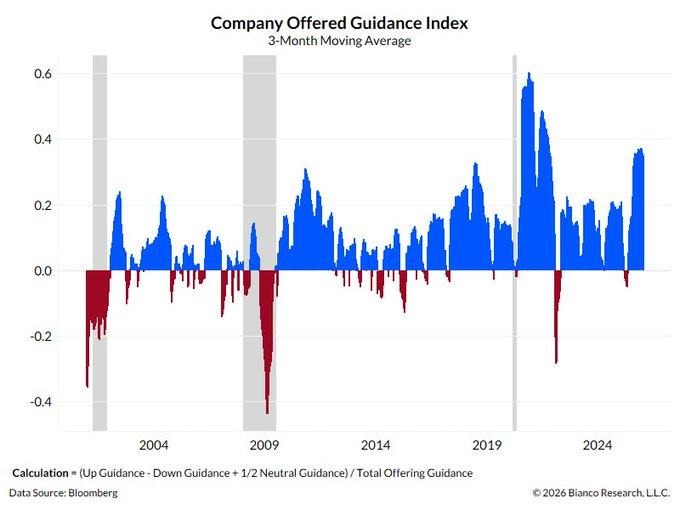
A key signal entering 2026 is that corporate leadership teams are sounding unusually confident. The Company-Offered Guidance Index—tracking the net balance of positive versus negative earnings outlook revisions—has surged to levels not seen since 2004, reflecting a broad shift toward optimism as results season progresses. Supporting this tone, nearly half of large-cap companies have delivered positive earnings guidance, a level above the typical seasonal baseline. For markets, this matters because guidance often leads price action: when companies upgrade outlooks, investors start pricing better visibility, stronger earnings durability, and lower downside risk.
However, the market’s real challenge is separating “healthy optimism” from “concentrated optimism.” The debate is whether stronger guidance is being driven by genuine demand strength across the economy, or whether a narrow set of AI-linked winners is masking weaker conditions elsewhere. The more balanced explanation is that many companies have learned to operate leaner: they are protecting margins through cost controls, supply discipline, and selective investment spending. This allows earnings to remain resilient even when interest rates stay elevated, because profitability is being supported by efficiency rather than pure revenue acceleration. Investors should recognize that this is a different type of cycle—less about explosive growth, more about execution quality.
Given this backdrop, we view Microsoft Corporation (MSFT) as undervalued relative to the guidance environment. When corporate confidence rises, spending priorities typically favor platforms that improve productivity, strengthen security, and scale efficiently—especially as management teams seek measurable returns on investment. Microsoft’s positioning across enterprise software, cloud infrastructure, and AI-driven workflow tools makes it a direct beneficiary of both confidence-led capital allocation and “do more with less” corporate behavior. Analysts should monitor forward guidance durability, commercial backlog trends, and margin commentary tied to AI-related infrastructure costs, because the market will reward firms that can translate optimism into repeatable earnings strength rather than one-off headlines.
Grocery Burden Widens, Consumer Pressure Rises
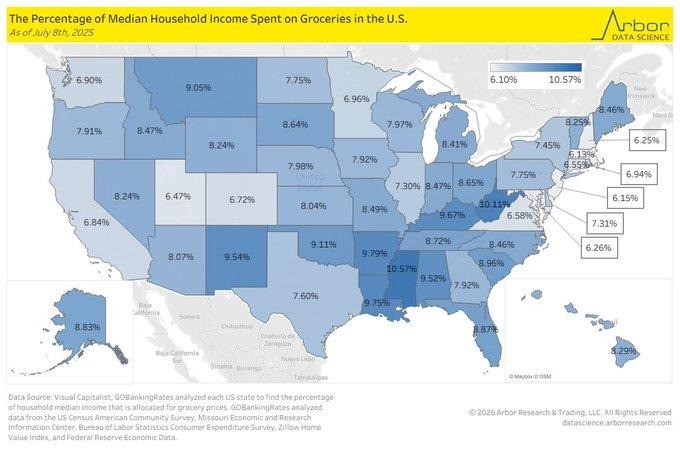
A new 2025 state-by-state breakdown of grocery spending as a share of median household income shows a clear affordability divide across the country. Lower-income states are allocating the highest portion of income to groceries, led by Mississippi (10.57%), West Virginia (10.11%), and Arkansas (9.97%). The takeaway is not that groceries are most expensive in these areas in absolute terms, but that household incomes are lower, making food costs feel heavier even when prices are 5–10% below the national average. This reinforces a reality markets often underestimate: consumer stress is driven by “share of income,” not just price levels.
This pattern fits Engel’s law—when income is lower, necessities like food consume a larger portion of the budget, leaving less room for discretionary spending. That matters for equities because it shapes shopping behavior, brand choices, and basket mix. In higher-income states, grocery burden looks smaller partly because households have more income flexibility and may shift spending toward dining out, which can distort comparisons versus purely “at-home food” consumption. Analysts should also treat this as a broader demand signal: when essentials absorb more wallet share, it becomes harder for non-essential categories to maintain volume without promotions, which can pressure margins across retail and consumer brands.
Given this backdrop, we see Walmart Inc. (WMT) as undervalued due to its positioning as a direct beneficiary of trade-down behavior when food affordability becomes a bigger household constraint. In environments where grocery spending crowds out discretionary budgets, value-driven retailers typically gain traffic and capture wallet share, even if consumers remain cautious overall. Analysts should watch grocery volume trends, private-label mix, pricing investment intensity, and margin performance tied to supply-chain execution, because the winners in this cycle will be those that defend affordability while still protecting profitability.
Food Inflation Reaccelerates, Consumers Feel The Pinch
December 2025 inflation data shows food costs are becoming a renewed pressure point for households. Food purchased for home consumption rose 2.4% year over year, while food away from home climbed 4.1%, keeping overall food inflation around 3.1%. The key market issue is not just that food is rising again—it is that it hits consumers daily and changes behavior quickly. When food costs climb, households adjust spending faster than they do for most categories, which can weaken discretionary demand and raise sensitivity to price increases across the economy.
The chart trend signals that the disinflation story in food is no longer a straight line downward. Dining out inflation continues to run hotter than grocery inflation because restaurant pricing is tied to service-sector labor costs that remain sticky. In other words, even if broader inflation cools, restaurant operators still face rising wage bills and operating costs, and they pass that through to customers. This matters for markets because persistent service inflation can slow the pace of policy easing and keep funding costs elevated, even when headline inflation appears to be improving. For consumers, it also reshapes spending psychology—dining out becomes a “treat” again, not a routine habit.
Given this environment, we view Kroger Co. (KR) as undervalued because rising “food away from home” prices tend to shift demand back toward at-home consumption and value-seeking grocery behavior. As dining out becomes less affordable, households typically increase grocery basket size, trade down to store brands, and focus on promotions, which can support traffic and volume for large-scale grocers. Analysts should watch pricing versus volume trends, private-label penetration, loyalty data strength, and margin stability, because food inflation can lift sales but also intensify competition if retailers absorb costs to protect market share.
Global Earnings Revisions Turn Positive, Rally Risk-On
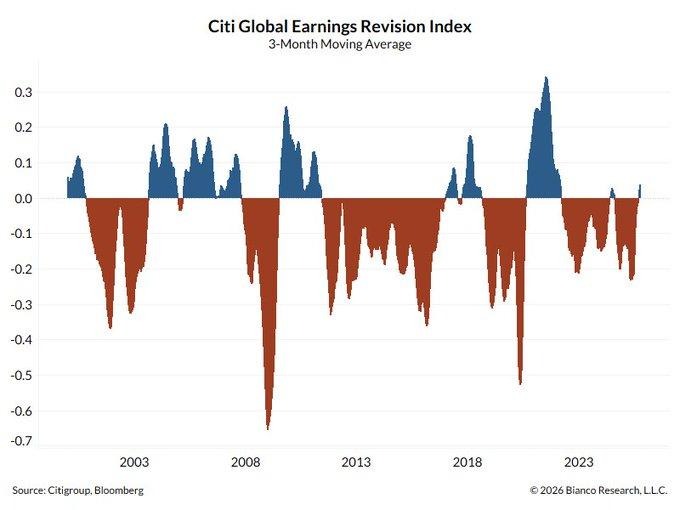
A key “under-the-surface” market signal has flipped in early 2026: the Global Earnings Revision Index has moved into positive territory after staying negative since mid-2023. This index tracks whether analysts, on net, are raising or cutting earnings forecasts across global companies, using a smoothed three-month trend to capture momentum rather than noise. When revisions turn positive, it typically reflects improving corporate conditions—better demand visibility, stabilizing margins, and higher confidence in forward guidance. For equity markets, this matters because earnings revisions often lead price performance, not the other way around.
The broader implication is that market strength may start to expand beyond a narrow set of leadership names. When global revisions improve, it usually signals that the earnings cycle is becoming less concentrated and more diversified across regions and sectors. This is especially relevant as inflation pressures cool and the market increasingly looks toward a 2026 policy easing backdrop. However, the details still matter: the U.S. reading remains slightly negative, which suggests investors should not assume every segment is improving at the same pace. In other words, this is the early stage of a potential global upgrade cycle, not a fully confirmed broad expansion.
Given this environment, we see Johnson & Johnson (JNJ) as undervalued as investors begin rotating toward stable cashflow franchises that can perform well during global recovery phases without relying on aggressive growth assumptions. When earnings revisions improve globally but uncertainty remains uneven, defensives with durable demand and resilient margins often regain investor preference, particularly as rate pressure begins to ease. Analysts should watch guidance quality, pipeline and product mix commentary, and margin stability, because the market will reward companies that convert improving sentiment into repeatable earnings durability while avoiding cost surprises.
Upcoming Economic Events
German Ifo Business Climate, Core Durable Goods Orders M/M, Durable Goods Orders M/M
As we head into the next major data window, markets will be watching three releases that quietly shape risk appetite: Germany’s IFO Business Climate survey and two key US manufacturing demand indicators—Core Durable Goods Orders and headline Durable Goods Orders. Together, these events help answer one question investors keep circling: is growth stabilizing in a healthy way, or slowing beneath the surface? The immediate market reaction will depend heavily on whether the actual prints beat or miss expectations, because that impacts rate-cut timing, global demand confidence, and the earnings outlook for industrial and consumer-linked businesses.
German IFO Business Climate
This report is one of the clearest real-time reads on corporate confidence across Europe’s largest economy.
- If the actual number prints higher than forecast, it typically signals improving business sentiment, stronger investment intentions, and better trade-linked momentum—conditions that often lift European equities and support global cyclicals. In that scenario, analysts should expect a “risk-on” tilt where industrial names and exporters look more attractive, while bond demand may soften as growth expectations improve.
- If the reading comes in lower than forecast, it points to weaker demand confidence and slower forward activity, which can trigger a defensive shift—supporting bonds and pressuring growth-sensitive sectors, especially those tied to global manufacturing and cross-border trade.
USA Core Durable Goods Orders m/m
Core Durable Goods Orders strip out transportation, making it a cleaner signal of underlying business investment demand.
- If the actual figure is higher than the forecast, it implies companies are still committing to equipment, technology, and productivity upgrades—supporting the view that industrial demand is more resilient than feared. Markets usually take this as a positive for earnings confidence, but it can also lift yields if investors worry stronger demand keeps inflation sticky and slows the pace of rate cuts.
- If the print is lower than forecast, it suggests businesses are becoming cautious and delaying spending, which often pressures industrial and capital goods names while supporting bonds as investors price slower growth ahead.
USA Durable Goods Orders m/m
The headline number is more volatile, but it matters because it captures big-ticket demand trends across the economy.
- If the actual reading beats the forecast, it strengthens the narrative that manufacturing-linked activity and consumer and business demand are holding up, which can support equities broadly—especially industrials, transports, and select retailers tied to big-ticket categories.
- If the number misses expectations, it signals demand softness and raises concern that growth is cooling faster than markets are prepared for. In that downside scenario, analysts should watch whether weakness is concentrated in one-off categories or broad-based, because broad weakness would increase recession-sensitive positioning and accelerate the market’s preference for defensive earnings stability.
Stock Market Performance
Indexes Rebound Strongly from April Lows, But Drawdowns Still Expose Fragile Breadth
At Zaye Capital Markets, we see a clear divergence in market structure: index-level performance has improved meaningfully since the 4/8/25 low, yet the drawdown data shows the average stock beneath the surface is still absorbing far more volatility than the headline benchmarks suggest. Year-to-date returns are positive across the board, but the real story is what happens when we measure how deep the pullbacks have been for both the index and its typical constituent. This is a classic “strong tape, uneven participation” setup, where leadership remains concentrated and broader durability still needs confirmation.
Here’s our breakdown using the chart figures exactly as presented:
S&P 500: Solid Recovery, But Members Still Under Pressure
YTD: 1% | +39% since 4/8/25 low | Max drawdown from YTD high: -3% | Avg. member max drawdown from YTD high: -5% | Index max drawdown since 4/8/25 low: -5% | Avg. member max drawdown since 4/8/25 low: -20%
The S&P 500 is up 1% year-to-date and has delivered a strong 39% rebound since the 4/8/25 low. However, while the index has only seen a -3% maximum drawdown from its YTD high, the average member has experienced a deeper -5% drawdown, and the post-low drawdown gap is even wider at -5% for the index versus -20% for the average stock. This is a clear signal that strength is still being carried by a smaller group of heavyweight winners rather than balanced participation.
NASDAQ: Big Upside from the Low, But Extreme Member Volatility
YTD: 1% | +53% since 4/8/25 low | Max drawdown from YTD high: -3% | Avg. member max drawdown from YTD high: -11% | Index max drawdown since 4/8/25 low: -8% | Avg. member max drawdown since 4/8/25 low: -43%
The NASDAQ is also up 1% year-to-date, but it stands out for its powerful 53% surge since the 4/8/25 low. The problem is the internal damage: while the index drawdown from the YTD high is only -3%, the average member drawdown is a much heavier -11%. Since the 4/8/25 low, the index maximum drawdown is -8%, but the average member drawdown is an aggressive -43%. That gap highlights how fragile the broader growth complex remains even during a strong index rebound.
Russell 2000: Best Year-to-Date, But Drawdown Risk Still Elevated
YTD: 10% | +54% since 4/8/25 low | Max drawdown from YTD high: -1% | Avg. member max drawdown from YTD high: -7% | Index max drawdown since 4/8/25 low: -9% | Avg. member max drawdown since 4/8/25 low: -31%
The Russell 2000 is the standout year-to-date leader at 10%, and it has also posted the strongest rebound since the 4/8/25 low at 54%. Even with a relatively mild -1% index maximum drawdown from the YTD high, the average member drawdown is still -7%, showing the typical small-cap stock remains far less stable than the benchmark implies. Since the 4/8/25 low, the index drawdown is -9%, while the average member drawdown is -31%, reinforcing that small-cap participation exists, but the volatility cost remains high.
Dow Jones: Steadier Profile, With More Controlled Member Stress
YTD: 3% | +31% since 4/8/25 low | Max drawdown from YTD high: -2% | Avg. member max drawdown from YTD high: -5% | Index max drawdown since 4/8/25 low: -6% | Avg. member max drawdown since 4/8/25 low: -16%
The Dow Jones is up 3% year-to-date and has risen 31% since the 4/8/25 low. Its risk profile appears more controlled than the other benchmarks, with a -2% index drawdown from the YTD high versus -5% for the average member. Since the 4/8/25 low, the index maximum drawdown sits at -6%, while the average member drawdown is -16%, which is still meaningful but less extreme than what we see in the more volatility-sensitive indexes.
Bottom line from Zaye Capital Markets: the rebound is real, but the drawdown math shows the “average stock experience” remains tougher than the index headlines. Until member drawdowns compress and participation broadens, we remain selective—prioritizing consistency, balance-sheet strength, and earnings reliability over chasing index-level momentum.
The Strongest Sector In All These Indices
Energy Leads Year-To-Date, While Communication Services Wins The Day
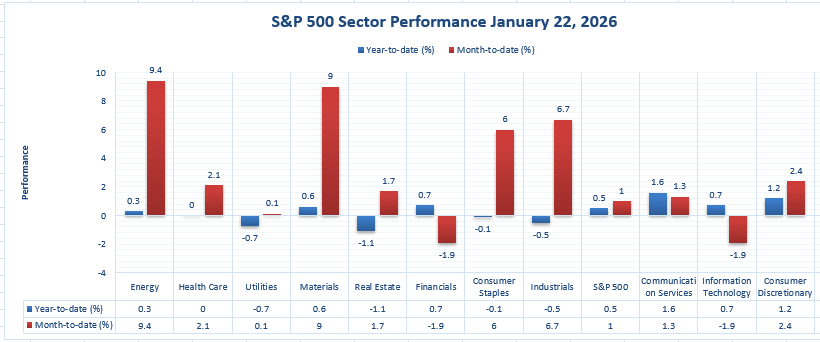
At Zaye Capital Markets, we read this sector map as a two-speed market: the strongest trend leadership is coming from Energy year-to-date, while the strongest single-day impulse is coming from Communication Services. On a year-to-date basis, Energy is the clear leader at 9.4%, narrowly ahead of Materials at 9.0%, with Industrials at 6.7% and Consumer Staples at 6.0% forming the next tier of strength. That tells us leadership is still skewed toward sectors tied to pricing power, real-economy throughput, and essential demand.
Energy: The strongest year-to-date sector
Year-to-date: 9.4% | 1/22/2026: 0.3%
Energy’s 9.4% year-to-date gain marks it as the strongest sector in the entire chart, even though the single-day move on 1/22/2026 was a modest 0.3%. The key message is durability: leadership is being earned over time, not just in one session. We also note that broad performance is not uniformly strong—the overall S&P 500 shows 1.0% year-to-date—so Energy’s outperformance is doing meaningful work in keeping headline returns afloat.
Communication Services: The strongest sector on 1/22/2026
1/22/2026: 1.6% | Year-to-date: 1.3%
Communication Services posted the best one-day performance at 1.6%, with a year-to-date gain of 1.3%. This is important because it shows where incremental risk appetite is flowing in the short term, even while the longer-term leadership remains elsewhere. In contrast, some major areas are still lagging year-to-date—Financials at -1.9% and Information Technology at -1.9%—which reinforces that sector leadership is selective rather than broad.
Earnings
Key Reports Landed Yesterday (23-Jan-2026) — What Mattered Most
- Ericsson (L.M.) Telephone Co.: EPS estimate was 0,20 USD and actual EPS came in at 0,28 USD, a +39,14% surprise, with market capitalization at 34,83 B USD. At Zaye Capital Markets, we see the key investor focus here staying on demand visibility in telecom infrastructure spending, margin defense through cost discipline, and whether management tone supports continued network investment despite uneven carrier budgets.
- SLB Limited: EPS estimate was 0,74 USD and actual EPS came in at 0,78 USD, a +5,08% surprise, with market capitalization at 73,43 B USD. From our perspective at Zaye Capital Markets, the most important factors remain international activity strength, pricing stability across services, and whether earnings durability is being driven by operational execution rather than a temporary demand spike.
- Booz Allen Hamilton Holding Corporation: EPS estimate was 1,29 USD and actual EPS came in at 1,77 USD, a +37,10% surprise, with market capitalization at 12,40 B USD. At Zaye Capital Markets, we believe investors should stay focused on backlog quality, margin durability, and guidance credibility, because strong earnings beats matter most when they translate into repeatable demand strength rather than one-quarter timing benefits.
- First Mid Bancshares, Inc.: One important clarification from our TradingView check—First Mid Bancshares, Inc. did not announce earnings on 23-Jan-2026, so we do not treat it as an active “reported” release for yesterday. In this market, that distinction matters because investors are pricing earnings momentum aggressively, and mislabeling a non-reporting name can distort the day’s narrative.
Key Reports Due Today (26-Jan-2026) — What Investors Should Watch
- Steel Dynamics, Inc.: Today’s earnings slate has a clean macro linkage, and Steel Dynamics sits at the center of the industrial demand read-through. The market will focus on pricing versus volume trends, spreads, and management’s outlook on demand sequencing, because the steel cycle often reflects whether activity is stabilizing or quietly cooling.
- Western Alliance Bancorporation: For Western Alliance, the market focus is deposit costs, net interest margin direction, loan growth quality, and early warning signs in credit performance—because regional banking earnings remain highly sensitive to funding conditions.
- W.R. Berkley Corporation: Investors will focus on renewal strength, rate momentum, claims discipline, and whether premium growth is translating into clean underwriting profitability, because this is where insurance names either confirm pricing power or reveal margin pressure.
- Brown & Brown, Inc.: We are watching Brown & Brown through the same lens as the broader insurance complex—rate momentum, retention trends, claims pressure signals, and whether growth is being achieved with underwriting discipline rather than volume at any cost. In today’s setup, the “winners” will be the companies that show earnings strength without relying on one-time benefits—backed by forward guidance that confirms durability rather than optimism.
Stock Market Overview – Monday, 26 Jan 2026
U.S. equity markets are starting the week on a cautious footing as investors digest a wide range of catalysts, including tariff developments, funding risk headlines, and concentrated mega-cap earnings sensitivity. At Zaye Capital Markets, we view the current trading environment as “selectively cautious” — leadership remain narrow, macro uncertainty persists, and near-term earnings will likely have outsized influence on sentiment.
Stock Prices
Economic Indicators and Geopolitical Developments
Today’s market narrative is shaped by a mix of policy uncertainty and shifting expectations around growth leadership. Tariff rhetoric is resurfacing, elevating supply-chain cost risk, while government funding uncertainty is adding a policy premium that limits aggressive positioning. Meanwhile, fixed income markets are pricing tighter conditions, keeping interest-rate sensitivity high across rate-sensitive sectors. As central bank dialogue remains the focal point this week, equities are not reacting to macro prints in isolation — investors are weighing whether economic data reinforces or undermines forward guidance.
Latest Stock News
- YouTube continues to be one of $GOOGL’s most underrated assets in the digital economy. It reportedly makes roughly the same revenue as $NFLX, yet without spending on content, and still grew ~13% by letting creators fund the platform.
- $AAPL is reportedly less than a month away from releasing a new AI update for Siri powered by $GOOGL Gemini, with integration expected to elevate Siri responses.
- The U.S. plans to invest $1.6B into $USAR taking ~10% stake through a Department of Commerce facility tied to the CHIPS Act to reduce reliance on China-controlled rare earth supply chains.
- $TSLA plans to begin training its Optimus humanoid robot at Giga Texas starting in February, following a year of real-world data collection at the Fremont factory.
- $NVDA’s CEO Jensen Huang is in China as regulators weigh whether the H200 AI chip gets approved or blocked — a sign that demand confidence at the highest level remains robust. Chinese regulators have cleared $BABA, Tencent & ByteDance to begin preparing purchase requests for $NVDA H200 chips.
- $AMZN is building an AI healthcare portal with One Medical to use patient data to deliver personalized guidance, automate care navigation, and reduce friction in healthcare access.
Here are the top 15 performers of 2026 so far:
- $CRML +197%
- $SNDK +100%
- $SKYT +72%
- $BE +67%
- $RDW +65%
- $NTLA +63%
- $ASTS +56%
- $APLD +54%
- $IREN +50%
- $EOSE +49%
- $KTOS +45%
- $NVTS +42%
- $MU +40%
- $AEHR +39%
- $DPRO +38%
The Magnificent Seven and the S&P 500
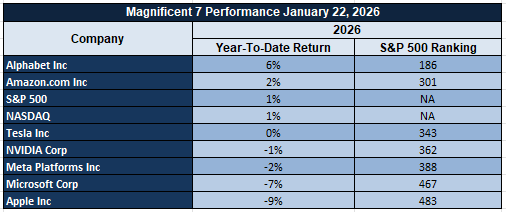
The concentration of leadership in the largest technology and AI-linked names continues to exert outsized influence on the S&P 500 and Nasdaq. With these names trading on ever-higher expectations for earnings durability, any signal of margin pressure or slower spend has an amplifier effect on headline indices. Until breadth improves beyond this narrow leadership, downside risk remains heightened should near-term earnings disappoint.
Major Index Performance as of Monday, 26 Jan 2026
- Nasdaq: Trading at 23,501.24
- S&P 500: Trading at 6,915.61
- Russell 2000: Trading at 2,669.16
- Dow Jones: Trading at 49,098.71
At Zaye Capital Markets, we continue to emphasize a disciplined approach: prioritize companies with strong earnings visibility, resilient cash flows, and pricing power, while monitoring sector breadth and policy developments for clues on sustainable market leadership.
Gold Price: What’s Driving Gold Past $5,000 Amid Trump’s Davos Shocks and Trade Risks?
Spot gold is currently trading above US $5,080 per ounce, pushing into uncharted territory as global markets react to a potent mix of geopolitical tension, inflation hedging, and policy uncertainty. At Zaye Capital Markets, we’ve identified the sharpest short-term catalyst as Trump’s high-impact appearance at Davos. His remarks—ranging from rebuking European green energy policies and migration stances, to threatening a 100% tariff on Canada—have fueled concerns over global trade fragmentation, economic nationalism, and diplomatic unpredictability. As his administration escalates enforcement rhetoric and funding standoffs around immigration and federal oversight, safe-haven flows into gold have intensified. Investors are responding to the growing perception that political tail risks are no longer theoretical but immediate, visible, and potentially destabilizing. Upcoming economic data—specifically U.S. Core Durable Goods Orders and Germany’s ifo Business Climate—will either reinforce these fears or momentarily pause them. A miss in today’s figures could heighten the case for Fed rate cuts, compress real yields further, and drive gold even higher. A beat may slow the surge, but will likely be overshadowed by persistent risk aversion surrounding the U.S. policy path and international tensions.
Yesterday’s data has already helped establish a bullish structure for gold. The marginal improvement in durable goods orders is being interpreted cautiously, while sticky inflation expectations and modest corporate confidence indicate that rate-sensitive instruments remain vulnerable. This has compressed real yields and reaffirmed gold’s appeal as an inflation-insulated, politically neutral store of value. More importantly, as Trump doubles down on energy nationalism and lashes out at both allies and institutions, gold benefits from its positioning as a hedge against not only monetary policy uncertainty, but also global coordination breakdown. Investors now face a triple-force market: aggressive geopolitical rhetoric, monetary divergence signals, and institutional erosion. These forces have pushed gold into a new structural range where $5,000 is no longer speculative—but strategic. At Zaye Capital Markets, we believe unless macro data flips decisively and Trump moderates his tone, gold’s rally may become the defining anchor in defensive positioning across Q1 2026. Investors should watch real rates, policy tone, and global alignment signals closely before betting against the metal’s upward trajectory.
Oil Prices: How Are Trump’s Davos Rhetoric and Today’s Economic Data Shaping Crude Oil Price Direction?
Spot oil is trading in a tight range as of Monday, 26 Jan 2026, with Brent crude near $65.81 per barrel and U.S. West Texas Intermediate around $61.01 per barrel, reflecting a market that is sensitive to geopolitical headlines and structural supply‑demand dynamics. Global benchmarks have been supported recently by weather‑related production disruptions and geopolitical risk premiums, particularly amid tensions in the Middle East and broader diplomatic unpredictability, but prices remain capped by oversupply concerns and weak demand momentum. OPEC/IEA outlooks point to abundant supply in 2026, which keeps a lid on sustained upside even as consumption forecasts improve modestly. Traders are also responding to recently published statements from producers like Saudi Aramco, which contend that global supply gluts are exaggerated while highlighting limited spare capacity—suggesting near‑term volatility rather than clear directional trends. Meanwhile, markets remain vigilant about structural oversupply risks, with the IEA and other forecasters projecting balanced markets later in the year only if production restraint strengthens and global demand recovers meaningfully.
Trump’s Davos‑era comments and today’s economic calendar are accentuating this duality in oil pricing. His emphasis on expanding oil and gas output to lower energy costs and criticisms of green energy policies have added a political dimension to crude valuations, reinforcing expectations that U.S. policy would favor production growth—even as tariff threats and diplomatic unpredictability intermittently heighten short‑term risk premiums. This has amplified fluctuation in crude prices: when tariffs or trade tensions come to the fore, downside demand risk weighs on oil; when supply disruptions or geopolitical risk premiums rise, crude gets a bid. Yesterday’s economic signals reinforced this cautious backdrop; mixed data heightened sensitivity to demand prospects, which tends to cap aggressive oil rallies. Looking ahead, today’s releases—namely U.S. Core Durable Goods Orders, Durable Goods Orders, and the German ifo Business Climate—will be critical. Softer data will feed demand concerns, likely weighing on crude futures by reinforcing the oversupply narrative and pressuring energy equities; stronger prints could support marginal demand optimism, lifting oil prices modestly unless counterbalanced by stronger dollar or rate‑sensitivity pressures. In this environment, oil is trading as a fundamentally balanced but headline‑sensitive commodity, where geopolitical rhetoric and macro surprises continue to dictate short‑term moves against a backdrop of structural oversupply risk.
Bitcoin Prices: Why Is Bitcoin Price Stuck Near $90K Amid Davos Policy Shock and Macro Tension?
Bitcoin is currently trading in a tight consolidation band, hovering around $89,000 after dipping below $88,000 earlier in the week and recovering slightly during Asia’s trading hours. This range-bound behavior—between $88,500 and $90,300 per Binance’s latest updates—follows a volatile stretch triggered by macro pressures and a liquidity thinning environment ahead of key U.S. and European data releases. Yesterday’s economic figures painted a cloudy picture, with durable goods orders reflecting uneven demand strength and reinforcing broader caution in risk-on assets. For Bitcoin, which thrives on momentum and institutional flows, this translated into subdued price action. Market participants are also awaiting forward guidance from central banks, and until rate trajectories become clearer, the crypto ecosystem is trading with defensive posture. Analysts note that ETF flows have been stable, but not aggressive, and social data tracking shows sentiment described as “fragile but intact.” This mirrors what we see on price charts: Bitcoin’s inability to breach $90K decisively signals indecision rather than conviction, with no clear catalysts yet strong enough to break the deadlock.
Complicating this positioning is Trump’s barrage of high-volatility statements at Davos, which injected macro risk and regulatory overhangs back into crypto pricing models. His call for Congressional action on crypto market structure reform, paired with his aggressive posture on trade and economic nationalism, has turned Bitcoin into a policy-sensitive asset this week. Although crypto bulls see long-term upside from regulatory clarity, the immediate effect of Trump’s remarks—alongside his threats against Canada, warnings on NATO, and rhetoric on migration and energy policy—has elevated market anxiety and hurt short-term speculative flows. The result is that Bitcoin is now oscillating in sync with broader geopolitical risk sentiment, not just on-chain metrics or ETF flows. Today’s economic data releases—including U.S. Core Durable Goods and Germany’s ifo Business Climate—could act as intraday volatility triggers. If the data underwhelms, Bitcoin may slip toward technical support under $88K as traders reprice risk. A stronger-than-expected showing could lift prices, but only if paired with lower Treasury yields and easing policy expectations. At Zaye Capital Markets, we believe this consolidation phase reflects deeper systemic stress: Bitcoin is no longer an isolated asset—it’s a barometer of global liquidity confidence, macro hedging demand, and investor sensitivity to unpredictable leadership rhetoric.
ETH Prices: Why Is Ethereum Still Below $3K? Latest Whale Moves and ETF Flows Explained
Ethereum remains trapped beneath the $3,000 mark, hovering around the $2,870 to $2,930 range as of this session. This consolidation isn’t just technical — it’s structural. Over $611 million in spot ETH ETF outflows over the past few weeks have signaled institutional disengagement just as broader macroeconomic clouds return. The latest U.S. economic data offered little comfort: while inflation expectations cooled slightly, weak core durable goods orders and softness in capex spending left risk-on assets with little support. Ethereum, already under pressure from thinning liquidity and reduced momentum, saw its short-term upside capped. Volume has remained stagnant, and traders are becoming increasingly reluctant to push price action above resistance zones without a stronger catalyst. With the broader crypto market watching the Federal Reserve’s tone and upcoming earnings for cues, ETH is caught in a holding pattern, reliant on either a macro thaw or a decisive reversal in ETF behavior to regain traction. Until then, every dip to support is being bought defensively — not aggressively — as conviction remains muted.
Behind the scenes, large wallets are quietly influencing sentiment. Recent blockchain data shows a rise in ETH being withdrawn from exchanges and restaked — a subtle but powerful signal of long-term accumulation by whales. However, this is offset by short-term selling near key levels, creating choppy price action and reinforcing the consolidation range. Network metrics remain strong: Ethereum’s daily transaction count, gas usage, and DeFi participation continue to hold up well, suggesting the tech and utility case is intact. But traders aren’t pricing long-term fundamentals right now — they’re responding to near-term flows. And those flows are shaky. ETF redemptions, risk-off macro tone, and fading narrative momentum have dragged ETH into a sideways drift. If large ETF issuers resume buying — or if whale accumulation trends accelerate — Ethereum may retest the $3,100 level with conviction. Until then, the market is watching, not chasing.
