Where Are Markets Today?
The U.S. and European stock futures are trading near the flatline so far this morning, a sign that the markets are taking a breather after two days of relief-fueled gains. The S&P 500 futures are off by just 0.1%, while the Nasdaq 100 futures are off by 0.2%. The Dow futures are also trading 21 points lower. The Euro Stoxx 50 futures are also trading near the flatline, indicating that European markets are also consolidating recent gains. The major averages have been on a two-day winning streak, fueled by a decline in geopolitical risks after President Trump unexpectedly canceled a plan to impose tariffs on certain European nations, as well as a “framework agreement” on a proposed deal to purchase Greenland from NATO officials. The Dow is up over 300 points, the Nasdaq is up nearly 1%, and the Russell 2000 is trading a record high.
But this tentative opening also implies a degree of uncertainty as markets may not be fully convinced the coast is clear. There are two dominant factors acting as a drag on the markets, even as they rallied. Firstly, the tech stocks continue to weigh on the markets as Intel shares fell 12% after-hours as the company issued poor Q1 guidance, which also impacts the outlook for the chipmakers. Secondly, the flash PMI results out of Europe and the U.S. could also act as a macro headwind, particularly if they signal a slowdown in services or manufacturing. Even as the threat of tariffs is removed, the economic backdrop, including interest rates, remains unclear.
The futures in Europe are indeed echoing this tug-of-war scenario, as while the relief from the tariff reversal by Trump has been good news indeed, especially in the auto industry, as has been the case in industrial sectors in general, the fact that there are some reservations regarding the legal implications of a future agreement regarding Greenland, as to whether such a measure would circumvent existing structures, has kept political risk in play, especially in the context of the decisions that are expected from the European Central Bank in the near future, as growth remains sluggish in Europe.
Overall, it seems that investors are taking a strategic view of today’s markets. While investors are certainly happy to see the easing of tensions in the Arctic and a reprieve from trade tariff threats, investors are now taking a closer look at some of the deeper fundamental concerns that have driven markets lately. While we close out the week and head into the long holiday weekend, it seems that traders are taking a wait-and-see view of markets based on their futures trading. While geopolitical concerns have certainly driven markets lately, it seems that investors are taking a closer look at some of the deeper concerns that have driven markets lately. This means that volatility could come back quickly should some of these concerns come to fruition in the days ahead.
Major Index Performance as of Friday, 23 Jan 2026
- S&P 500: Trading at 6,913.35, up 0.5%, supported by macro data resilience and easing policy tensions.
- Nasdaq Composite: Trading at 23,436.02, up 0.9%, lifted by renewed tech momentum and earnings optimism.
- Dow Jones Industrial Average: Trading at 49,384.01, up 0.6%, benefiting from strength in industrials and broad cyclical exposure.
- Russell 2000: Trading at 2,718.77, up 0.8%, marking standout small-cap leadership and long-term breakout momentum.
The Magnificent Seven and the S&P 500

The “Magnificent Seven” megacaps have struggled during the past week due to geopolitical and tariff concerns. This has had an impact on the performance of the S&P 500 and NASDAQ indices. While some of these stocks have experienced an upward trend due to their rallies, other stocks are also starting to gain traction as investors are looking to gain diversified performance. There is a sense of leadership rotation as evidenced by diverging structures of indices.
Drivers Behind the Market Move – Friday, 23 Jan 2026
As US and European markets are going through a dynamic combination of geopolitical changes, mixed macroeconomic messages, and policy anticipation, a number of factors are currently affecting investor sentiment.
- Easing Geopolitical Tensions and Strategic Negotiations
The geopolitical shift in rhetoric, which has accompanied the negotiations in the context of the Greenland talks, has served to ease near-term risk of conflict, which has in turn supported risk assets as they recover from mid-week volatility. President Trump’s remarks, which highlighted negotiation as opposed to military action, cooperation in infrastructure as opposed to the acquisition of assets, as well as the launch of a “Board of Peace” at Davos, have served to ease the risk premium that dominated the market’s risk assets in the mid-week selloff. However, legal debate in the sovereignty agreement, as well as a pushback from Europe, has left a risk premium in place, which has been reflected in a cautious improvement in risk assets, such as a relief bounce in US stocks, as well as a rise in autos and industrial names in Europe.
2. Economic Data Anticipation and Mixed Macro Signals
The prevailing sentiment in today’s market is dominated by expectations of fresh economic indicators arriving in the coming sessions, particularly Flash Manufacturing and Services PMI figures in Europe and the States, as well as a revised University of Michigan Consumer Sentiment reading. Market participants are waiting on these releases to bring much-needed clarity to growth momentum in the first part of 2026. Strong readings will support cyclical assets and confirm the rally in equities in recent sessions, whereas soft readings might revive fears of slowing growth and reduce risk sentiment in both markets. Yesterday’s mixed results from economic releases maintained a sense of uncertainty in growth momentum, as robust labor figures were met with less than expected disinflation readings.
3. Corporate Catalysts and Earnings Headwinds
In the present time, similar corporate-related actions in Europe as well as the U.S. also continue to shape the markets. For instance, after-hours earnings shocks, particularly the notable decline in Intel stock due to poor forward guidance, have limited the upside in corresponding technology-related futures. On the other hand, the European stock markets face the challenges of slightly downgraded earnings forecasts, as well as a weakening of some sectors, which temper the overall optimism, particularly due to the reduced concern over tariffs. Additionally, the policy expectations emanating from the ECB, particularly regarding inflation as well as the flexibility of rates, continue to shape the fixed income as well as the equity correlation environment. This, in turn, supports the prevailing range-bound nature of the present stock markets.
In summary, the easing of geopolitical news headlines, the upcoming announcement of vital economic data, and the earnings-related headwinds have created a cautiously calibrated environment for the market. The investor reaction to these developments is keeping the market well-balanced, as witnessed by the US and European futures as the week comes to a close.
Digesting Economic Data
The Trump Tweets and Their Implications
Trump’s comments on Greenland can be viewed as more than simply “noise.” They can be viewed as an early indicator of a new doctrine that could significantly affect the energy, defense, and financial markets. Trump’s comments on the U.S.-Greenland agreement indicate that it is “under negotiation,” and it will offer the U.S. “total access,” without “time limits,” and without “a direct cash purchase.” The denial of force and the offer of contributions indicate an approach from influence rather than aggression. It is an opportunity for Arctic logistics agreements among several countries that could be beneficial to defense contractors and energy companies. It is the legal and sovereign issues, however, that could result in regulatory issues and delay the project. The issue of legality and the concerns of some of America’s European allies could be an issue.
At the same time, the launch of the “Board of Peace” in Davos attempts to recreate the international security architecture in parallel as well. This is particularly so in the manner in which the Board of Peace is being positioned as an instrument of peace enforcement in conjunction with the United Nations, focusing on the stability of ceasefire in Gaza and calling for contributions from members of the UN Security Council. This indicates an attempt to create an alternative soft-power grouping under the auspices of the United States. While the signing of the charter with 35 countries already on board gives the initiative significant diplomatic traction, the non-participation of the United Kingdom and the apparent opposition from France and Canada, as well as the general perception in the European Union of undermining the UN architecture itself, cast serious doubts over the legitimacy of the Board of Peace. While the initiative garners media attention, it risks being perceived as creating divisions rather than achieving the much-desired consensus—especially between members of the North Atlantic Treaty Organization.
The market implication of the above two scenarios is two-fold. Firstly, the Greenland approach, provided that it bears fruit, would mean that the footprint of the West in the Arctic would gain legitimacy without confrontation, which could mean that investment opportunities in long-duration defense and logistics projects could become a reality—particularly those that are associated with the deployment of forces in the Arctic. A second market implication is that the narrative of the ‘Board of Peace’—while politically tenuous—may represent a larger attempt at managing the conflicts in the Middle East diplomatically, which could have the effect of soothing energy markets and improving the risk appetite of emerging markets. Investors should monitor the ‘Board of Peace’ as an indicator of the risk premium associated with geopolitical risk. The higher the legitimacy that the ‘Board of Peace’ achieves, the higher the market could begin to factor in a ‘de-escalation dividend.’ Finally, Trump’s message to Europe to not retaliate through economic means for the issue in Greenland, and his hint at renegotiating the 1951 military access treaty, is an obvious attempt to renegotiate a new era for the governance of the Arctic region without treaty wars. If he is successful, he is essentially paving a way for future U.S.-led treaties for ungoverned and underdeveloped regions and/or resource-rich areas. Regardless of whether one agrees with the current situation and/or Trump’s policies, one must recognize where power is shifting—toward ungoverned and underdeveloped regions and/or resource-rich areas. And for those seeking to invest, one must look at these tweets not for their volume, but their direction.
PCE Inflation Matches Forecasts, Reinforcing a “Higher-for-Longer” Rate Backdrop
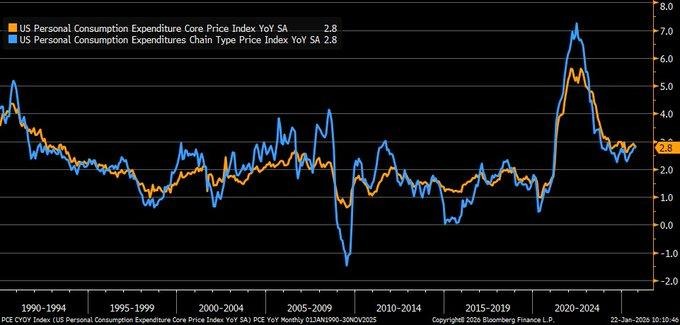
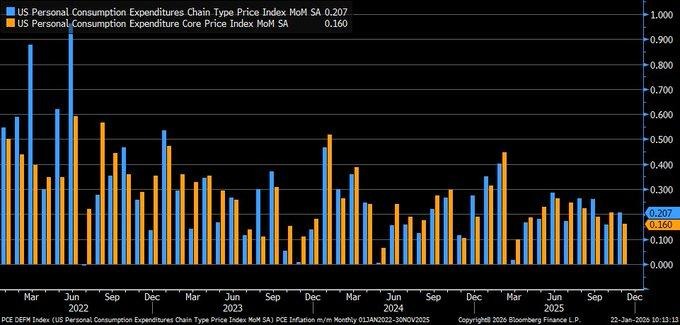
In addition to this, November inflation results released in November 2025 met expectations as headline PCE inflation registered an increase of 2.8% on an annual basis, and core PCE inflation remained steady at 2.8%. On the other hand, on a month-to-month basis, headline as well as core PCE inflation registered an increase of 0.2%, indicating that inflation is not decreasing sharply, yet it’s not growing enough to necessitate immediate action. This kind of inflation report, termed as an “in-line” report, reduces risk for investors since it implies inflation is growing in an orderly, controlled, and increasingly “anchored” manner relative to the jump after the events of 2022.
But, of course, the bigger picture to take away from that data set is that, as of yet, inflation has not come back down to that 2%, so we are not quite done yet. The long-term trend of inflation shows that we have continued to make progress from those peaks, but it also shows that we are not quite at that level yet. The last mile, as they say, may be a slow one. The implications of that are very, very significant, especially in terms of future expectations. The reality of stable inflation at slightly too high levels means that we are in a steady-rate rather than a rapid-easing cycle. The analysts need to be watching to see if core inflation plateaus at these levels, services inflation continues to be firm, and wages continue to be stable at levels that support continued demand.
From this macro environment, our view is that Johnson & Johnson appears to be undervalued. In this environment, where interest rates remain restrictive and inflation slowly declines, equity markets tend to place more value on earnings reliability than growth risk. Johnson & Johnson, as a company, appears to offer this as a very solid, cash-generating business with strong underlying demand profiles, which should be able to sustain itself even if the overall market environment becomes more selective. Analysts should be watching margin performance, as well as overall tone, as this, in our view, represents the most likely driver to move valuation levels in this environment, as interest rates remain constant.
Initial Claims Surpass Forecasts, Maintaining Payrolls’ Strength and Demand Concerns Afloat
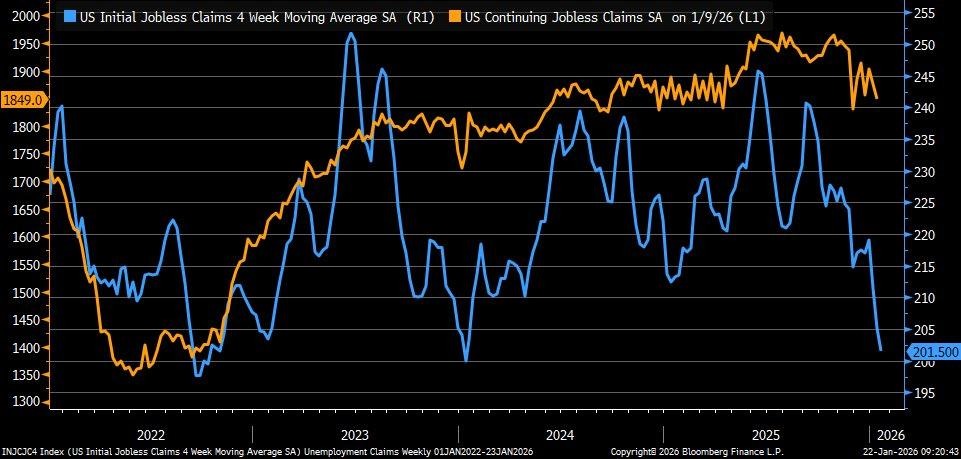
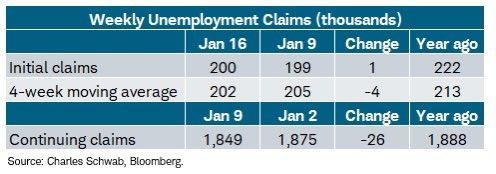
However, the latest labor claims report shows that initial jobless claims came in at 200,000 for the week that ended on January 17, 2026. While this rose slightly from the prior reading of 199,000, it still came in below the expectations of the market at 209,000. From our perspective, this confirms an important truth: the labor market is not under stress, as layoffs have not picked up significantly. The reason this matters to us is that low jobless claims generally indicate that employers continue to hold onto workers, and that the incomes of households have not been disrupted despite the higher interest rate environment that the economy must navigate.
Similarly, the number of continuous claims decreased to 1.849 million from 1.875 million. This figure has reached a new low since the middle of 2023 according to the accompanying chart. This decrease implies that the duration of unemployment is decreasing. This has important implications for the efficiency of the labor market. In market terms, the continued strength of labor can be seen in the fact that the longer individuals remain within the labor market and the lower the turnover rate within the labor market, the longer their overall economic well-being will not change. However, the focus should not solely be on the weekly claims figures. This measure does not include all individuals within the labor market. For example, the figures do not include those individuals that have recently graduated or those individuals that are not eligible for benefits.
With this background, we view Johnson & Johnson shares as being undervalued, especially when we consider that a tight labor market is helping to maintain stability in demand trends, keeping “rate cuts soon” bets subdued, and this is often when we tend to favor investments that can provide strong and reliable earnings and cash flows, and Johnson & Johnson is an organization that can provide this, especially when we view them from an investment standpoint, where they can provide strong revenues that can perform well when markets are less tolerant of uncertainty.
Seller Inventory Surges, Creating Buyer Leverage and Testing Home Price Support
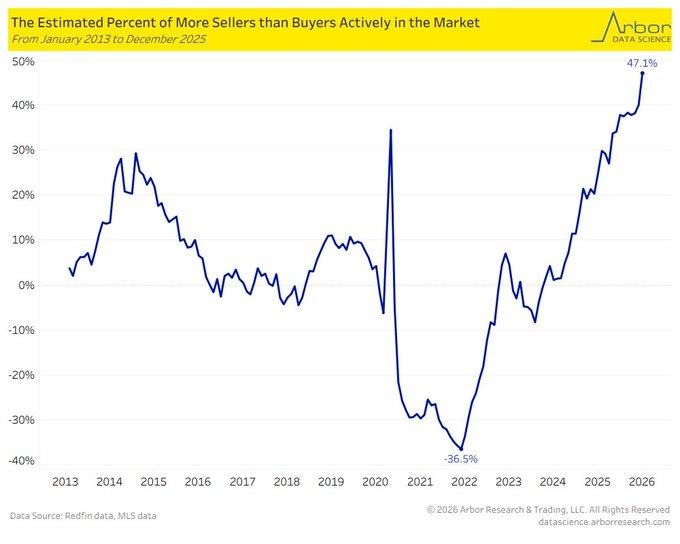
According to the latest available data for the end of December 2025, the negotiating balance of power between active sellers and buyers continues to shift, with sellers outstripping buyers by a record 47%. This represents the greatest seller dominance since 2013. This represents a significant shift in the structure of the housing market. In practical terms, this means that the number of sellers outstrips the number of buyers. When this happens, it means that the buyer becomes more empowered to make their move. When this happens and the cost of owning continues to be challenged by the mortgage rate, which remains above 6.5%, it becomes even worse.
The trend also points to the degree to which conditions have reversed from the ultra-tight 2021 period, during which there were far more buyers than sellers. This imbalance points to the degree to which the opposite is true currently—sellers are listing again, but the problem for them is the hesitation from the buyers, which is driven mostly by the fact that the cost to them in terms of the monthly payment is still running well ahead of the growth in their income. This is why the “inventory story” alone is not the right way to look at the issue—affordability is the real issue, and affordability is driven both by price and the cost of financing. We should also note whether this imbalance holds up into the early part of 2026 because, if the seller surplus holds, housing inflation pressures should abate, which would help to relieve pressures on households and possibly shift the overall inflation picture at some point. We also have to watch the spread closely because the issue at the local level can remain tight even if the national data points to a cooling. With this structure, we believe that Home Depot is currently undervalued, especially when we consider that a housing market that is shifting towards concessions and repairs is likely to drive renovation, maintenance, and upgrade demand, especially when consumers negotiate these credits and immediately invest them into the home. Even if transactions are soft, we can see that ‘stay and fix’ can remain strong, especially when consumers choose to remodel rather than relocate, especially when rates are this high. Analysts should watch for stability of same-store sales, trends of project mix between smaller repairs and larger remodels, and increases in consumer tickets, especially when we believe that the winners of this cooling housing market will not necessarily be those that benefit from the ‘boom’ of new homes, but those that benefit from ‘repair’ demand.
Data Center Construction Continues to Rise, But Boom Period Begins to Normalize
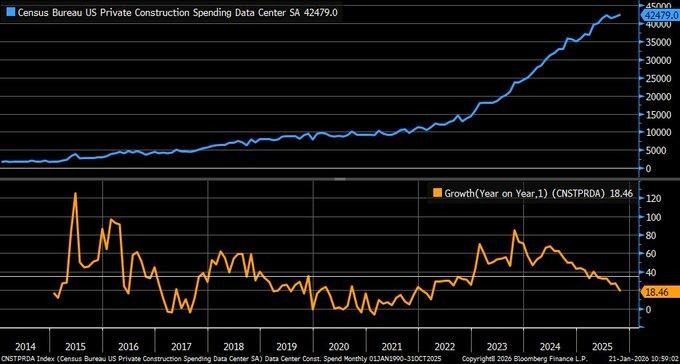
Data center construction spending continues to rise, and this confirms the AI infrastructure buildout remains a significant spending cycle. However, the rate of increase for this spending no longer accelerates. In other words, the year-over-year rate for this spending eases to about +18.5% by October. This means the spending surge begins to plateau. This isn’t a sign of a spending collapse. Rather, it’s similar to the market shifting from panic to planning. In other words, the spending projects are no longer just about announcement headlines. Rather, they’re about project completions and new project starts.
The macro takeaway here is that the fact that absolute spending continues to remain at lofty levels continues to provide support for industrial spending, equipment spending, and the buildouts associated with power, but the slowdown also creates selectivity across the supply chain. When the economy slows, what the market starts to favor are companies that can deliver faster, cheaper, and with less power waste, and the ones that are getting stretched out, which were able to deliver that kind of acceleration at the expense of efficiency, are the ones that are going to start to lose favor. Analysts are also going to want to look for whether the slowdown continues into the first quarter of 2026, which would suggest that the spending, the capital spending, that’s going on at this point, is getting disciplined under the tightened finances and the real-world constraints that exist.
Given this scenario, we believe that Nvidia’s stock appears to be undervalued. Even if growth in physical construction continues to slow, overall growth in AI compute spend behind these facilities appears to be strong, with the highest value spend in these facilities still being on advanced compute hardware. We believe that Nvidia still sits at the center of this spend cycle, with “slower but higher” spend growth potentially still supporting strong earnings durability rather than a “boom or bust” scenario. We think that analysts should be watching order visibility, tone of forward guidance, as well as customer digestion periods, as I believe that the major risk with this moderating spend growth in construction lies with timing, rather than overall growth, with strong players potentially re-rating very quickly as long as overall spend growth appears to be stable.
Purchase Applications Spike, Hinting Buyers Are Returning Despite Tight Inventory
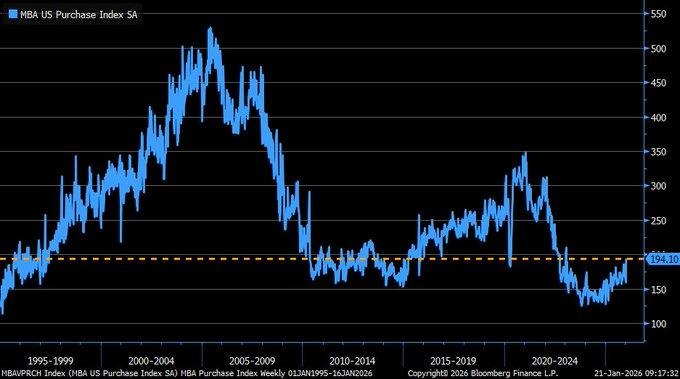
Mortgage demand appears to be exhibiting a healthy pulse of activity, with the Mortgage Purchase Index jumping significantly to 194.10 for the week ending January 16, 2026. This represents a 14.1 percent jump on a week-over-week basis and represents a substantial move away from the depressed numbers that had lingered following the 2022 period and had stayed closer to the 100 to 150 range. Purchase mortgage activity represents some of the cleanest leading indicators of underlying demand for houses—before it turns into hard numbers—so this represents a substantial jump.
However, the driving factor for this improvement can be attributed to the reduction in the cost of borrowing, with the 30-year mortgage rate falling to about 6.16% compared to the peaks above 7% that were experienced in the period between 2023 and 2024. Although the reduction may not be dramatic, it can have quite an impact, which may be enough to boost the pent-up buying that has been delayed by households. The application scenario also looks quite robust, with mortgage applications rising sharply compared to the last few weeks. However, the housing market still has one factor that can potentially impact the extent to which the improvement can be sustained, and that factor is the inventory.
Given this environment, we believe that Home Depot represents an undervalued opportunity. A loyal customer base often leads to a second-order demand response in home improvements, home renovations, home appliances, move-in improvements, etc., particularly as home owners still prefer to spend money to make improvements rather than take on significantly more house payments to move to another house. Even as housing activity improves gradually, this type of spend, which is driven by purchases or home improvements, can remain supportive for companies that benefit from housing turnover or home improvements, particularly as home owners still prefer to spend money to make improvements rather than take on significantly more house payments to move to another house.
Upcoming Economic Events
French Flash Manufacturing PMI & French Flash Services PMI, German Flash Manufacturing PMI & German Flash Services PMI, ECB President Lagarde Speaks, USA Flash Manufacturing PMI & Flash Services PMI, USA Revised UoM Consumer Sentiment
As we approach a day dominated by the macroeconomic data, the direction the markets will take will be dictated by a combination of European activity data, central bank communications, and new information regarding consumer sentiment. With growth sensitivities increasing and rate expectations still precarious, the information will dictate the markets’ assessment of the pace and persistence of the global economy and inflation. Here’s what we’re looking at and what the implications will be for the markets:
French Flash Manufacturing PMI, French Flash Services PMI
The PMI data due to be released from France will provide market players with an insight into whether the overall economic situation is improving or deteriorating, pushing the economy either towards stability or stagnation.
- If the data comes in above forecast, this could indicate that the overall demand situation is improving, boosting business confidence, and this is likely to benefit European shares, especially cyclical industries like industrials and finance. On the flip side, if PMIs are strong, this could cause a rise in yields due to inflationary pressures, although this could weigh on certain shares, especially those sensitive to rates.
- On the downside, if PMIs are weak, this could cause yields to fall, boosting defensives, and this could prompt central banks to provide support to the market direction.
German Flash Manufacturing PMI & German Flash Services PMI
German PMI numbers have importance as the country continues to be the key engine driving regional industrial activity and export-based economic performance.
- A better-than-forecast reading on the German PMI numbers may imply that the momentum driving the country’s factories continues to improve, which may alleviate recession fears and boost risk sentiment in the broader European space. It may also imply that inflationary pressures may sustain beyond the current expectations, which may sustain a restrictive policy environment and curb the gains in rate-sensitive growth stocks.
- A disappointing reading on the German PMI numbers may reinforce the notion that the weakness in the manufacturing industry continues to drive the country’s economic downturn, leading to a risk-averse sentiment and potentially lower interest rate expectations.
ECB President Lagarde Speaks
The messaging from the central banks is also a major trigger for volatility because the markets are trying to gauge whether the central banks are adopting a tone of being patient or flexible.
- If the tone sounds hawkish, focusing on the risks to the inflation forecast and the necessity for a restrictive stance, bond yields are likely to shift higher, and stocks are at risk, especially the rate-sensitive stocks.
- If the tone sounds dovish, emphasizing the risks to growth, weakening demand, or confidence about the cooling of the inflation cycle, the markets are likely to react positively to the speech, which should help stocks. We are listening carefully for a change in confidence about the inflation forecast and the durability of the economy.
USA Flash Manufacturing PMI Flash Services PMI
These prints will aid in confirming an uptrend or downtrend in business activity.
- If the actual results are better than expected, it will likely be taken as an indication of risk-on sentiment, as it will imply that the economy still has some strength. On the flip side, it will also imply that inflation pressures are still alive, which will further increase the chances of interest rates staying high.
- If the results are weaker than expected, it will imply weakness in the economy, which will likely benefit bonds, as it will further convince the market to expect an easing of interest rates.
USA Revised UoM Consumer Sentiment
As far as impact, this figure represents how consumers feel about their own future levels of spending, inflation, as well as economic confidence over the near term.
- In terms of impact, if this revised figure ends up coming in above forecasts, this would be seen as indicating that consumers are feeling more secure, which bodes well for future levels of spending resilience.
- However, if this figure ends up coming in below forecasts, this would be seen as indicating that consumers are becoming more cautious, which bodes poorly for future levels of spending as borrowing costs rise.
Stock Market Performance
Major Indexes Stall Year-to-Date, While Drawdowns Still Reveal Fragile Positioning
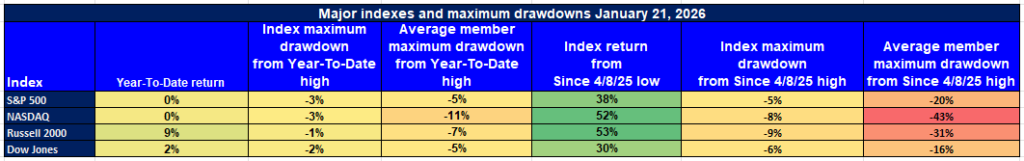
Equity markets are holding steady on the surface, but the drawdown profile shows why investor confidence remains cautious. Based on the latest index-level data, year-to-date performance is flat across major benchmarks, while pullbacks from highs remain meaningful—especially when we look at how the average index member has behaved versus the headline index itself.
Here’s our breakdown of the latest performance across key indexes:
S&P 500: Flat Year, Shallow Index Pullback
YTD: 0% | -3% from YTD high | Avg. member: -5%
Since 4/8/25 low: 38% | -5% since 4/8/25 low | Avg. member: -20%
The S&P 500 is still stuck at 0% year-to-date, even after a powerful 38% rebound since the 4/8/25 low. The index is only -3% off the YTD high, but average members are down -5% from their highs, and -20% since the 4/8/25 low—showing the recovery is not evenly distributed across constituents.
NASDAQ: Strong Rebound, But Deep Internal Damage
YTD: 0% | -3% from YTD high | Avg. member: -11%
Since 4/8/25 low: 52% | -8% since 4/8/25 low | Avg. member: -43%
The NASDAQ is also flat at 0% year-to-date despite rallying 52% since the 4/8/25 low. The index sits -3% from its YTD high, but the average member drawdown is far heavier at -11% from highs and -43% since the 4/8/25 low—highlighting narrow leadership and weaker breadth beneath the surface.
Russell 2000: Positive Year, Yet Small-Cap Stress Persists
YTD: 9% | -1% from YTD high | Avg. member: -7%
Since 4/8/25 low: 53% | -9% since 4/8/25 low | Avg. member: -31%
The Russell 2000 stands out with a 9% year-to-date gain and is only -1% from its YTD high, supported by a 53% rally since the 4/8/25 low. However, the average member data remains weak, with a -7% drawdown from highs and -31% since the 4/8/25 low, signalling that many smaller names are still struggling to sustain recoveries.
Dow Jones: Modest Gains, Still Not Immune
YTD: 2% | -2% from YTD high | Avg. member: -5%
Since 4/8/25 low: 30% | -6% since 4/8/25 low | Avg. member: -16%
The Dow Jones is up 2% year-to-date and sits -2% from its YTD high, supported by a 30% bounce since the 4/8/25 low. Still, the average member drawdown remains -5% from highs and -16% since the 4/8/25 low, confirming that even the more defensive benchmark is showing signs of uneven participation.
At Zaye Capital Markets, we view this as a market that looks stable at the index level, but still fragile under the hood. Until average-member drawdowns improve meaningfully, we stay selective—prioritizing quality businesses with durable cash flow profiles while monitoring participation and drawdown compression for confirmation of a healthier rally.
The Strongest Sector in All These Indices
Energy Leads the Market Across Both Year-to-Date and Daily Momentum
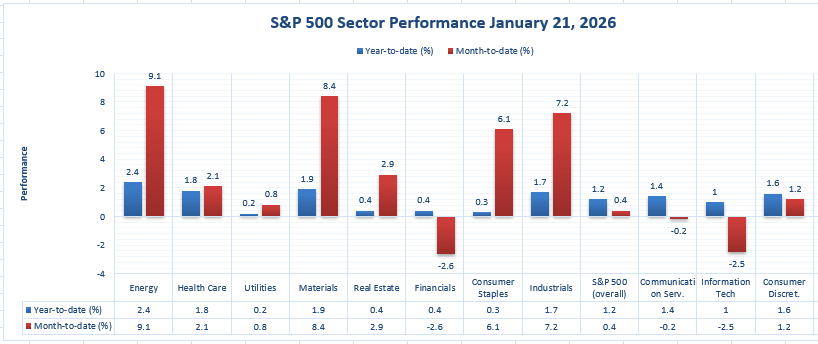
Based on our analysis at Zaye Capital Markets, the best-performing sector overall within the full performance snapshot for the above chart is the Energy sector. Not only is it the best performer so far for the year at 9.1%, which gives it the top position among all the sectors, but it further confirms our observation that the leadership within the market is coming from what we consider to be one of the most cyclical and sensitive sectors within the overall index. Outperformance such as this has significant implications for the overall stability and performance of the markets, particularly when a single sector has been able to hold the top position for so long while the rest have been mixed and uneven.
What adds further credence to this is the fact that not only is Energy leading year-to-date, it is also leading in terms of delivering the most powerful move for the most recent day. In fact, for 1/21/2026, Energy was able to move higher by 2.4 percent, which is the largest move for any sector. This is essentially where leadership consolidates—where a sector or asset class is leading and continues to perform well. The fact that Energy is leading year-to-date and also leading for the most recent day essentially means this sector is getting both short- and long-term inflows.
For example, as a frame of reference, the next best sector YTD performance comes in at 8.4%, 7.2%, and 6.1%, belonging to the Materials, Industrials, and Consumer Staples sectors, respectively. While these sectors are also up, they are lagging behind Energy’s 9.1% YTD performance. Meanwhile, as we have also noted, the overall level of performance across the board comes in at a mere 0.4% YTD, rising 1.2% yesterday, 1/21/2026.
For perspective, the next strongest year-to-date performers are Materials at 8.4%, Industrials at 7.2%, and Consumer Staples at 6.1%, all showing positive performance but still trailing Energy’s 9.1% lead. Meanwhile, the broader index is up only 0.4% year-to-date and rose 1.2% on 1/21/2026, highlighting that Energy’s gains are meaningfully ahead of the overall market baseline. From our view, this reinforces a key takeaway: while the broader index is showing modest progress, sector leadership remains concentrated, and Energy is currently the strongest pillar supporting market-level upside.
Earnings
Earnings Recap — January 22, 2026 (Yesterday)
- Intel Corporation: Intel reported stronger-than-expected fourth-quarter earnings for fiscal Q4 2025 with adjusted EPS of $0.15 on $13.67 billion in revenue, beating analyst expectations of ~$0.08 EPS and ~$13.44 billion in sales. Revenue declined slightly year-over-year, while earnings improved by roughly 15% vs. the year-ago quarter. Despite the beat, Intel issued weaker forward guidance for Q1 2026, forecasting break-even earnings on ~$12.2 billion in revenue, below consensus estimates. This combination of a current beat and cautious outlook drove mixed market reaction.
- Abbott Laboratories: Abbott reported fiscal Q4 2025 results on January 22, 2026 before the market open. Investors treated the release as a key read on medical device and diagnostics strength, especially as pricing and volume trends remain crucial drivers for healthcare earnings quality. We are watching how management frames 2026 demand stability, margin durability, and the ability to protect profitability in a slower but steadier growth environment.
- Suntec Real Estate Investment Trust: Suntec Real Estate Investment Trust was part of the earnings set for January 22, 2026, placing the focus on commercial real estate cash flow durability and occupancy sensitivity in a higher-rate environment. For investors, the key is whether rental momentum and leasing conditions remain strong enough to offset refinancing pressure and keep distribution stability intact.
- Amalgamated Financial Corp.: Amalgamated Financial reported fourth-quarter profit of $26.6 million, with profit of 88 cents per share. This print reinforces that credit and margin conditions remain central for regional banking performance, particularly as analysts focus on profitability stability, funding costs, and forward return strength through early 2026.
Earnings Preview — January 23, 2026 (Today)
- Ericsson (L.M.) Telephone Co.: Ericsson (L.M.) Telephone Co. is scheduled to report today, and investors will be watching closely for demand signals tied to network spending and contract momentum. The key factors to track are revenue stability, profitability trends, and management’s outlook on whether telecom customers are accelerating or delaying spending commitments.
- First Mid Bancshares, Inc.: First Mid Bancshares, Inc. is also due to report today, and the major investor focus will be on profitability durability in a tighter lending environment. We are watching net interest margin direction, credit performance trends, and whether deposit costs remain manageable as competition for funding stays elevated.
- SLB Limited: SLB Limited reports today, and this is a key earnings event for energy services expectations. Investors will focus on revenue strength tied to energy investment cycles, margin performance, and forward commentary on whether global project activity remains firm or shows early signs of cooling.
- Booz Allen Hamilton Holding Corporation: Booz Allen Hamilton Holding Corporation is due to release results today, with investors paying close attention to revenue execution, margin resilience, and forward visibility. The most important factors are contract strength, operational efficiency, and management guidance on demand stability going into the next quarters.
Stock Market Overview – Friday, 23 Jan 2026
The US equity market is looking to open with a cautious sense of positivity as we move into today’s session of trading, as the main indices are rising further from the relief rally experienced in the prior sessions due to easing trade tensions and robust economic data. This comes as investors are still processing the recent earnings and economic data releases, including sticky inflation numbers and robust labor data, as well as positioning ahead of the upcoming PMI releases.
Stock Prices
Economic Indicators and Geopolitical Developments
The macro indicators, like a robust GDP, coupled with stable unemployment figures, have helped to boost the markets, especially after a positive reaction to the withdrawal of earlier tariff threats that had affected the markets earlier. The inflation, however, remains high, thereby limiting the chances of a rate cut. The Asia-Pacific markets have also opened on a positive note, anticipating a stable path from the major policymakers.
Latest Stock News
TSLA | Tesla confirms that fully driverless robotaxi services have started in Austin, with no safety monitors inside the vehicles. Elon also revealed that Tesla plans to sell humanoid robots to the general public by the end of the following year. Elon emphasized that AI and robotics are expected to lead to an explosive growth in the global economy and that the greatest opportunities lie with those that control the compute, energy, and autonomous industries.
$MSFT Microsoft’s CEO, Satya Nadella, announced the major shift in the digital world when he stated, “A new world is emerging where traditional software applications are becoming passive databases, where intelligence, decisions, and actions will reside with AI agents.” In the new world of “agentic computing,” applications become commodities, and intelligent agents become the new business layer.
Anduril Industries, Defense technology firm Anduril is investing $1 billion to build a campus that spans a total of ~1.2 million square feet in Long Beach, California. The new campus is set to enable the firm’s next phase of growth by scaling the development and production of its autonomous defense technologies across various national security programs.
$NVDA | Nvidia Jensen Huang, CEO of NVIDIA, described how AI is driving the development of the “largest infrastructure buildout in human history.” He explained how there is an expected worldwide investment of 85 trillion dollars in the next 15 years. He discussed how there has been acceleration in spending on energy, chip production, hyperscale data centers, and AI factories. He believes the “industry is in the early innings.”
$ASTS | AST SpaceMobile stock saw an increase of greater than 15% as it revealed the launch date for its BlueBird 7 mission aboard Blue Origin’s New Glenn rocket in late February. This will be the first-ever flight for this vehicle and will have the capability to deploy as many as eight satellites at once. With launches planned for every month to two months in 2026, AST will be able to deploy as many as 60 satellites by the end of the year as it follows up on the success of BlueBird 6 and proves the viability of cellular networks in space.
$GOOGL | Alphabet (Gemini)’s generative AI platform, has increased its usage from 6% to 22% of GenAI web traffic, while ChatGPT’s usage has declined from 87% to 65%. This can be explained by the fact that the new Google AI platform, Gemini, has become easily accessible via existing Google products like Google Search, Chrome, Android, or Workspace without the need to change any behavior or install new applications or URLs.
$PYPL | PayPal has announced that it will acquire Cymbio in a bid to improve its Artificial Intelligence commerce suite, which will now feature agent-based catalog search and order capabilities integrated into PayPal’s Store Sync infrastructure, as well as connections to popular AI platforms such as Microsoft Copilot, Google Gemini, Perplexity, and ChatGPT.
RKLB | Rocket Lab announced that the tank for the first stage of the Neutron vehicle burst in a hydrostatic pressure test because it had exceeded the design parameters. Although the tank burst, there were no major damages to the facility, and the production for the next tank has already begun. In different news, Rocket Lab was able to deploy the first mission for the year for the Electron vehicle, “The Cosmos Will See You Now.”
The Magnificent Seven and the S&P 500
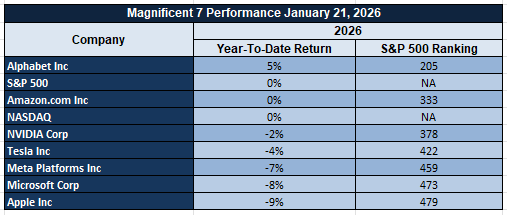
The “Magnificent Seven” megacaps have struggled during the past week due to geopolitical and tariff concerns. This has had an impact on the performance of the S&P 500 and NASDAQ indices. While some of these stocks have experienced an upward trend due to their rallies, other stocks are also starting to gain traction as investors are looking to gain diversified performance. There is a sense of leadership rotation as evidenced by diverging structures of indices.
Major Index Performance as of Friday, 23 Jan 2026
- S&P 500: Trading at 6,913.35, up 0.5%, supported by macro data resilience and easing policy tensions.
- Nasdaq Composite: Trading at 23,436.02, up 0.9%, lifted by renewed tech momentum and earnings optimism.
- Dow Jones Industrial Average: Trading at 49,384.01, up 0.6%, benefiting from strength in industrials and broad cyclical exposure.
- Russell 2000: Trading at 2,718.77, up 0.8%, marking standout small-cap leadership and long-term breakout momentum.
Currently, the markets appear to be tentatively constructive but selective in nature. Although the macro environment provides support to the markets, the dispersion in sectoral markets and valuation divergence require disciplined positioning on the part of the investors. Investors should focus on the quality of earnings, balance sheets, and breadth indicators while investing in the markets.
Gold Price: Why Are Gold Prices Holding Above $4,800 as Arctic and EU Tensions Escalate?
Currently, spot gold is trading around the price of $4,819 per ounce, having earlier risen to highs of about $4,934. It has been one of the stronger gold price days of the year. In our view, the higher gold price is directly related to the recent convergence of geopolitical tensions and central bank uncertainty. The recent statements from President Trump on his permanent framework of accessing Greenland, denying military intentions, and establishing the “Board of Peace,” and his threats of retaliation from Europe on Arctic negotiations, among other tensions, reflect an increased level of anxiety about the future of geopolitical alliances and central bank operations. The recent tensions and increased dissent from his own military and from other Western nations about his intentions and approaches reflect an increased level of fear about future fragmentation and thus an increased flight to gold. It is our view that recent tensions and dissent from his own military and from other nations about his intentions and approaches reflect an increased level of fear about future fragmentation and thus an increased flight to gold. It is our view that recent tensions and dissent from his own military and from other nations about his intentions and approaches reflect an increased level of fear about future fragmentation and thus an increased flight to gold. In our view, recent tensions and dissent from his own military and from other nations about his intentions and approaches reflect an increased level of fear about future fragmentation and thus an increased flight to gold. In our view, recent tensions and dissent from his own military and from other nations about his intentions and approaches reflect an increased level of fear about future fragmentation and thus an increased flight to gold. In our view, recent tensions and dissent from his own military and from other nations about his intentions and approaches reflect an increased level of fear about future fragmentation and thus an increased flight to gold. In our view, recent tensions and dissent from his own military and from other nations about his intentions and approaches reflect an increased level of fear about future fragmentation and thus an increased flight to gold. In our view, recent tensions and dissent from his own military and from other nations about his intentions and approaches While yesterday’s US jobless claims and consumer demand numbers were largely favorable, inflation’s failure to decelerate continues to reinforce gold’s strength as investors remain tied to low and stagnant real interest rates. We believe that as inflation continues to linger and central banks remain unpredictable in their policy adjustments and pacing, and as geopolitical tension continues to divide nations globally, it’s now evident that rather than simply responding to interest rate speculation and bets, gold is now thriving in an increasingly polarized geopolitical landscape. We believe that as an institution, we are now witnessing a critical phase shift in the markets and that rather than simply responding to interest rate and inflationary concerns as a cyclical inflation hedge and store of value, we are now witnessing that gold is now being considered as an essential component of sovereign wealth fund investment models and as an essential component of macro-sensitive investment models that are responding to sovereign and geopolitical tension and conflict. We believe that unless a critical and significant shift in interest rates or diplomatic efforts are made, we expect that gold will continue to maintain its position above $4,800 and potentially trend higher as we enter Q1 as investors and institutions remain attracted to safe-haven assets and as Arctic tension continues to build.
Oil Prices: What Is Driving Crude Oil Prices Now Amid Geopolitical Risks and Global Demand Shifts?
The crude oil markets continue their tug-of-war between the prevailing geopolitical risk factors and the underlying crude oil fundamentals. The crude oil prices currently stand at $64.41 per barrel for Brent crude oil, while the WTI crude oil currently trades at $59.69 per barrel as of Friday, 23 Jan 2026. The recent volatility in the crude oil markets is a result of reactions towards the strategic comments made by President Trump. The warnings regarding the presence of an “armada” possibly enroute towards the Iranian territory, which is an OPEC nation, have led to a rise in crude oil prices. However, the relatively softened stance regarding the Greenland situation, along with the Iranian situation, as well as the ease in the imposition of tariffs, has repeatedly led to a fall in the crude oil prices. This shows the highly reactive nature of the crude oil markets towards the prevailing perceptions regarding the crude oil supplies through the Strait of Hormuz. However, the underlying factors affecting the crude oil prices include the inventory build-up in the United States, as well as the forecasts made by the International Energy Agency, which indicates a relatively modest crude oil surplus in 2026 as compared to the demand. The observed stocks globally continue to be relatively high, which is acting as a constraint towards the crude oil prices. This, along with the OPEC+ policies, is acting as a constraint towards the crude oil prices. As a consequence of the somewhat mixed economic data from yesterday, highlighting the robust macro-economic resilience while also pointing to the inventory overhang, there is a somewhat cautious tone that is currently dominating the markets, making way for a trading range scenario as opposed to a breakout scenario in the prices of oil. Moving forward, the economic data that is set to be revealed today, such as the French, German, and United States flash PMI data, as well as the revised University of Michigan consumer sentiment data, is likely to be a critical factor that sets the tone for the prices of oil. If the flash PMI data is robust enough, the prices of oil are likely to rise as a consequence, as the improved health of the economy is likely to improve the outlook for the prices of crude oil. Similarly, if the data is not as robust as expected, the prices of oil are likely to dip despite the high levels of geopolitical risk that are currently dominating the headlines. OPEC data is likely to set the tone for the prices of oil over the long term as well, as a consequence of which a positive OPEC statement is likely to set the tone to a bullish scenario. At Zaye Capital Markets, we believe that the prices of oil are currently influenced by the interplay of the high levels of geopolitical risk that are dominating the headlines, as well as the supply and demand scenario that is likely to set the tone for the prices of oil over the long term.
Bitcoin Prices: Why Is Bitcoin Stuck Near $90,000 as ETF Outflows and Geopolitical Risk Build?
Bitcoin is currently trading near the $90,000 zone, with recent pricing hovering around $89,766 to $90,499, confirming that this level has become the market’s main battlefield between short-term buyers and persistent sellers. At Zaye Capital Markets, we see Bitcoin’s price behavior as increasingly dominated by liquidity conditions and institutional positioning rather than pure long-term narrative demand. The biggest weight on upside momentum right now is the acceleration in spot Bitcoin ETF outflows, which have been trending toward the $1 billion mark, reinforcing that institutional flows have flipped from support into pressure. That flow reversal is why Bitcoin has been slipping below $90,000 at times and why rebounds have struggled to confirm a trend shift even when technical buying emerges near support. At the same time, the geopolitical backdrop is adding another layer of volatility: the current Greenland negotiation headlines and Arctic security framing are raising broader cross-asset uncertainty, which has historically pushed risk exposure lower across high-beta assets. When uncertainty rises, Bitcoin tends to behave like a risk asset rather than a defensive hedge, and that keeps it vulnerable to sudden liquidity shocks—especially when ETF selling is already draining demand from the market.
Yesterday’s economic data reinforced this “fragile but supported” structure for Bitcoin. Labor market readings stayed firm, which tells investors financial conditions have not broken, but that resilience also reduces urgency for aggressive policy easing. In market terms, that often tightens the environment for speculative risk-taking, because higher rates for longer reduce liquidity appetite and increase the opportunity cost of holding non-yielding assets. This is why Bitcoin’s ecosystem is currently split: on-chain signals suggest recent volatility flushed out weaker hands, but price still struggles because the dominant driver is flow-based selling rather than organic spot accumulation. Looking ahead, today’s Flash PMI releases across France, Germany, and the United States, along with revised consumer sentiment, will likely decide whether Bitcoin stabilizes or breaks lower. If PMIs or sentiment come in weaker than forecast, markets may rotate toward rate-cut expectations and liquidity optimism, which could help Bitcoin reclaim momentum above $90,000. If the data surprises stronger, risk appetite may fade again, keeping Bitcoin capped below resistance and leaving it exposed to another wave of ETF-driven pressure.
ETH PRICE: Can Ethereum Prices Recover from ETF Withdrawals and Whale Accumulation Pressures?
The price of Ethereum is now just above that critical $3,000 mark and continues to trade around it as it has become a battleground for short-term bears and long-term bulls. Recently, it was pushed as low as the $2,700s due to price volatility; however, it seems that large investors known as “whales” are aggressively accumulating large amounts of Ethereum as it continues to recover. Over $100 million in Ethereum has already been accumulated by these large investors in just a matter of days. This might indicate that these investors believe that this price zone of $2,700 to $3,000 might be a strong long-term zone of support for Ethereum. On the other hand, some of these large investors of Ethereum have also started sending their coins back to exchanges. This might indicate that some of them are taking profits or are hedging against any further price declines. Economic sentiment based on recent news and reports continues to remain unstable as recent PMI and Earnings reports have caused ripples in the market that have caused investors to remain reluctant to purchase assets like Ethereum. Should today’s reports indicate that global demand is slowing down further, it might keep Ethereum locked in this zone or might send it down to test its lower price levels.
On top of that, critical ETF flows are at play. ETH is heavily dependent on ETF flows. At the moment, the overall sentiment is bearish. ETF flows into spot Ethereum have become less favorable lately. There have been signs of life lately, followed by a decrease in net flows. Analysts are saying that the current ETF flows into spot Ethereum are a major reason why ETH has yet to break above the current price. The ETF flows that fueled the ETH rally at the end of 2025 are currently causing investors to sell. At the moment, the overall macro sentiment is weakening. If the current ETF flows continue and the macro sentiment continues to weaken, ETH could drop as low as the $2,800 price level. However, with the ETF flows and the overall macro sentiment improving, the current price could change. ETH could break above the current price level and change the current price trend.
