Where Are Markets Today?
U.S. and European stock futures edged lower Wednesday, a reflection of growing investor unease ahead of a high-stakes group of earnings and inflation readings. Dow shed 0.2%, S&P 500 shed near 0.3%, and Nasdaq 100 shed 0.3%, a reflection of a risk-off theme that was running itself through globally. In Europe, the FTSE 100 faces a tentative start after having weakened near its record high of 9,000, which was based on spill-over anxiety from U.S. headline inflation readings and today’s U.K. CPI report. Markets were absorbing Tuesday’s 0.3% monthly U.S. CPI, which was above market estimates but reinforced the thinking that for the moment, at least, inflation is stuck.
Yesterday, the market fell 0.4% for S&P 500, Dow Jones shedding more than 400 points, whereas Nasdaq Composite gained a small 0.2%—its punch being delivered largely through a 4% gain for Nvidia, which reported that Chinese sales of its H20 chips would be resumed. Such a report boosted the tech-weighted index, but wasn’t quite sufficient to give the overall mood a lift. Futures are lower today with attention now turning to the big reading later today on a top theme of market current positioning being tested—the U.S. Producer Price Index (PPI)—which can confirm or turn around interest rate cut market current positioning. There are two behemoth forces driving futures lower today. Number one, the inflation story: while CPI arrived on time, investors are looking for PPI and Core PPI to know if upstream pricing pressure can be measured. A hotter-than-expected print would nearly eliminate a near-term drop, placing downward pressure on the value of equities, particularly at rate-sensitive corners. Number two, corporate earnings are in the spotlight. While the third wheel of JPMorgan, Wells Fargo, and Citigroup smashed earnings, bad guidance along with compounding cost structures have left hope reeling. Traders today are preparing to listen to Bank of America, Morgan Stanley, Goldman Sachs, and Johnson & Johnson, where a miss on earnings or margin squeeze can extend the pullback.
Across Europe, the playbook is the same. Inflation uncertainty is being met with earnings season angst. After momentarily touching at record highs, the FTSE 100 pulled back as market participants were defensive ahead of U.K. CPI numbers. Both Atlantic coasts are similarly attuned to positioning against macro cues and central bankoratory. On pressure on central banks to hit just right, with geopolitical threats—from tariffs to digital policy change—hanging highly mobile, markets navigate the week’s middle session with a defensive stance. Whether becomes a sustainable downside or buy-the-dip theme is yet to be determined, pending today numbers against the direction imparted through the week’s follow-through corporate earnings.
Major Index Performance through Wednesday, July 16, 2025
- Nasdaq Composite: lower modestly, as overall tech profit-taking offsets gains in AI.
- S&P 500: flat, powered by a large-cap advance.
- Russell 2000: underperformance, a reflection of residual small-cap risk
- Dow Jones Industrial Average: inched higher, driven by advances for financials and industrials.
The Mag 7 and the S&P 500
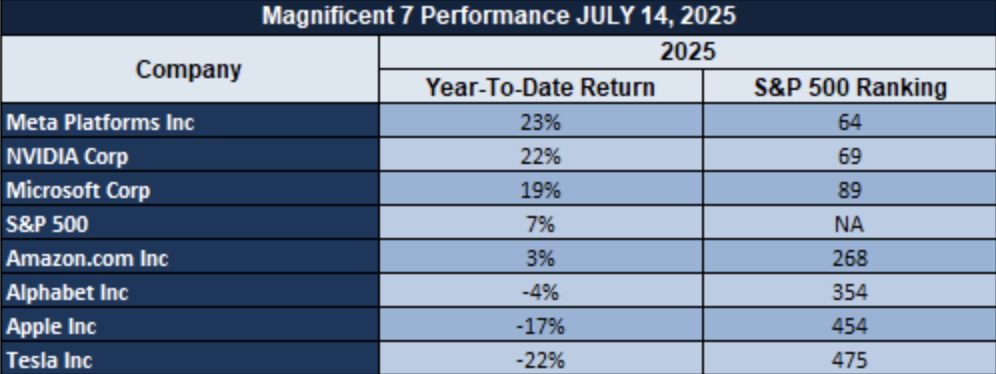
While Nvidia led the charge, the rest of the “Magnificent 7” still endure valuation anxiety. Alphabet, Amazon, and Apple lag behind overall S&P 500, which is the clear indication of a market that still depends on selective genius more than widespread engagement. S&P is stuck, supported by techs, defensives, but subject to profit-taking of utterly stretched names.
Drivers Behind the Market Move
Markets are grappling with a critical intersection of big forces impacting investment sentiment. These are the top three catalysts that are shaping U.S. and Europe equities today:
1. Inflation Signs & Fed Interest Rate Forecast
Tuesday morning’s CPI report revealed a 0.3% monthly gain and 2.7% annualized rise, reinforcing anew that inflation is sticky and dashing near-term rate-cut prospects at the Fed. As market minds now turn to today’s PPI and Core PPI reports, a favorable upside surprise would again put the breaks on rate-cut chances. Already, markets have taken easing prospects that were previously expected for this year from 50 to 43 basis points, a move that is deflating equities, most notably the rate-sensitive ones, and buoying the U.S. dollar on major pairs.
2. Tariff tensions and volatility in trade policy
President Trump’s recent introduction of a 35% tariff on Canadian imports, and subsequent threat of introduction of similar tariffs for Mexican and European imports, has reinstated trade policy uncertainty. In initial subdued market responses, we see a growing unease that such a development can start being reflected through readings of inflation through subsequent increases in import prices, particularly on consumables and industrial inputs. This newillas re-emergence of risk implied from tariffs is leading to defensives, safe heavens, but a drift away from cyclical sectors, exporters, and multinational companies that benefit from cross-border supply value chains.
3. Bank Reports & Earnings Season in Focus
News today from Bank of America, Goldman Sachs, Morgan Stanley, and Johnson & Johnson are the key to direction in the market. While JPMorgan Chase and Citigroup, naturally, outran estimates yesterday, mixed messages from Wells Fargo and BlackRock, in the meantime, have kept investors on their toes. As long as inflation is a dark cloud that hangs over the macro backdrop, investors want some clarity regarding whether core bank fundamentals—loan growth, trading revenue, and net interest margins—can support valuation or whether stress from cost, in addition to policy changes, will put a squeeze on profitability through the second half of the year.
Overall, the markets are being influenced by the persistence of inflation, uncertain earnings visibility, and uncertain trade policy. All these are leaving futures lower and keeping volatility high, with investors looking to today’s blockbuster corporate announcements and readings of the PPI for a direction.
DIGESTING ECONOMIC DATA
Empire Index Shock: Regional Power Versus National Industrial Weariness
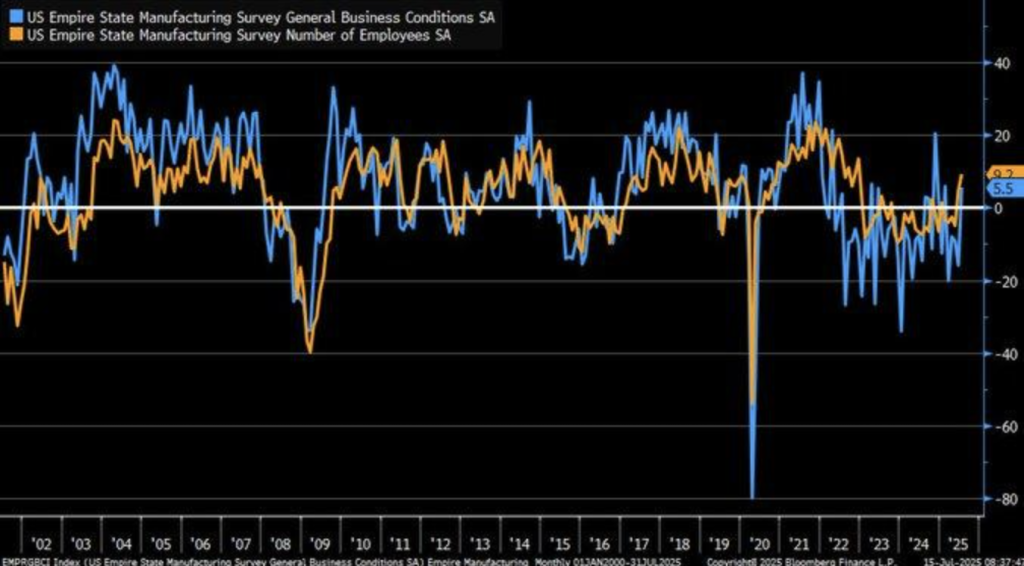
We witnessed a surprise July rise in Empire Manufacturing Index to +5.5 from a predicted -9.2, off a stunning -16 prior reading. This 22-point recovery, led by new order (+2), shipment (+11.5), and jobs (+9.2) gains, is a silver lining rare for New York manufacturing. Appreciative though the recovery is, one must treat it more like a regional oddity than a macro tipping point, least of all when juxtaposed with even larger U.S. manufacturing complex, still mired in a lagging five-year labor productivity expansion of a paltry 0.4%.
The rebound can be partly explained by recent tariff impacts that trimmed 1% from the year-over-year trade deficit, whereby supporting near-term domestic orders. Imbalance of structure persists. Rollout history mirrors volatility of Empire—its sudden decline later in 2024 is a reflection of the susceptibility of the index to external shocks like global supply chain uncertainty. Aside from that, sample biasing and season adjusting also create observed strength distortions. Even so, recent data shows strength, underlying weakness cannot be ruled out, particularly against the weak national industrial performance context.
We find Caterpillar Inc. (CAT) to be undervalued in this respect. Its international exposure conceals the advantage of industrial pick-ups in areas, dominant in infrastructure and energy-supporting baseloads of demand. Closely monitor ISM manufacturing readings beyond New York, margin expansion as a raw input cost contributor, and regional work patterns as leading indicators of industrial stock viability.
Service-Led Inflation Resurfaces Despite Energy Relief
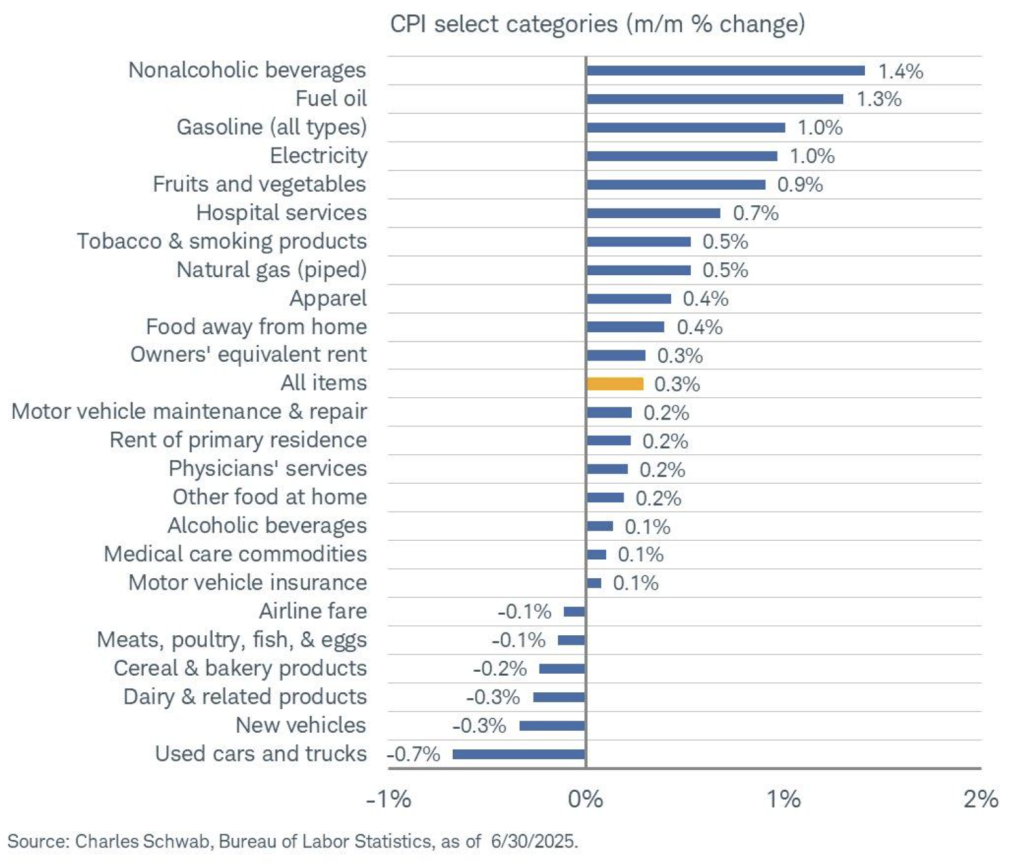
We are witnessing fresh pressures on prices outside of the energy sector, which was seen from the survey for the June 2025 report of CPI, which showed a 0.2% monthly advance of prices of car repair and maintenance—though a 4.7% annualized decline of the price of gasoline. This delinking of commodity deflation from sustainable service sector cost increases, more of supply bottlenecks with labor market shortages, reveals the volatility of inflation. Asymmetry of the inflation environment becomes a challenge for policymakers for keeping that center of target for expectations of a 2% level of inflation.
Current tariff policy is rewriting this equation. Following the tariff impositions of July, our internal projection is a probable 2.1% increase of some of the import services and durables, which are similar to Yale Budget Lab projections. These are aligned with Fed tightening bias, whereby core inflation now looks less at headline drivers like fuel and more at latent costs imbedded in consumer services. What is striking is that modifications of CPImethodology, most prominently geometric means of substitution effects, can be lower than the actual impact incurred by consumers, which disguises the cumulative nature of costs through broad service categories.
Advance Auto Parts (AAP), we feel, remains undervalued for now. Repair and maintenance expenditures increase, thus uplifting demand for aftermarket parts, a commodity that will benefit the distributor that is well situated along the lines of domestic supply chains. Analysts must watch Fed comments on service inflation drivers, correlate with PPI input data, and assess cost-push drivers of inflation in segments that are less vulnerable to global commodity price volatility. Such a shift towards service-driven inflation warrants more attention for inflation-sensitive equity positioning.
U.S. Core Cpi Trends Point To Stickier Inflation Than Global Peers
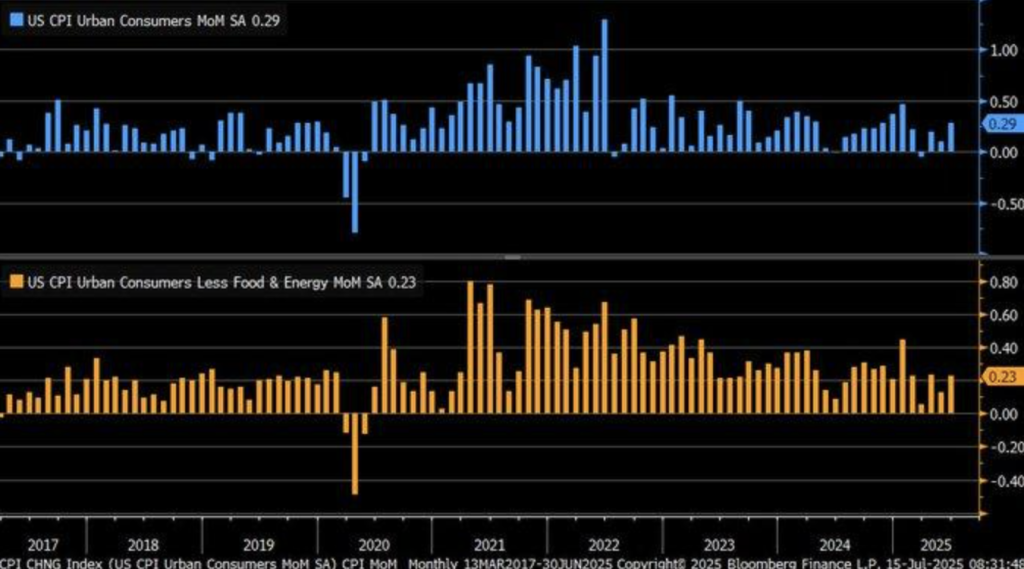
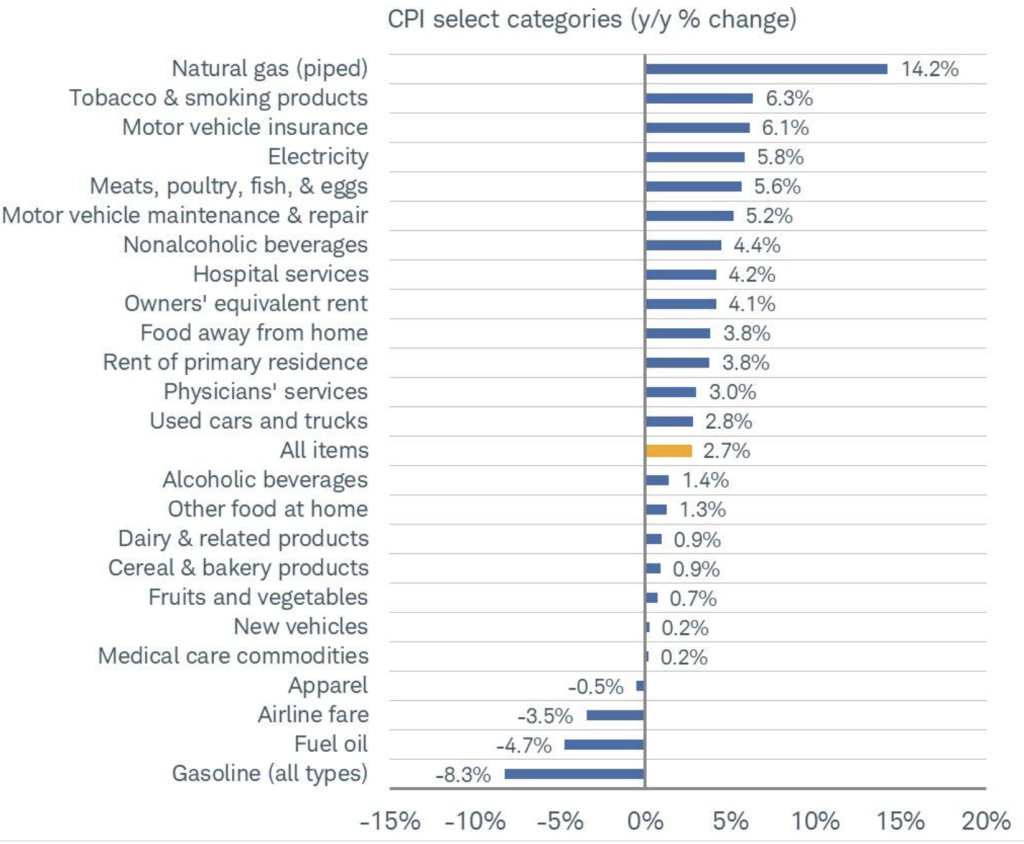
June 2025 figures reveal a stunning picture of persistence of inflation of American economy. Headline CPI increased 0.29% month-on-month, while core CPI, leaving aside foodables and fuel items, which are volatile in nature, increased 0.23%, sequel to the last increase of 0.10%. It reiterates the conclusion of Federal Reserve analysis of 2024 that core CPI is a superior measure of long-term trend of inflation. It can be seen from the figures that underlying upward pressure on prices remains rooted, first and foremost, in services and housing industries irrespective of disinflation of energy and commodity industries.
This internal inflation path is similar to the U.K.’s, for which year-over-year CPI was a paltry 3.4% in May 2025. Decoupling is U.S. inflation processes becoming increasingly internally driven by structural impulses, of which are the most notable the energy policy, rigidity of wages, and fiscal spillovers. As we see through FRED major-city consumer indexes, this process is accompanied with violent divergences of major cities on which rent inflation and health care are still dominant. As other developed nations enjoy relief through slowly decreasing import spending, the U.S. has more domestic inflation stickiness.
We believe Prologis Inc. (PLD) is undervalued today. As the shift of inflation toward sticky service sectors occurs, coupled with sustained industrial demand, its real estate holdings of logistics facilities are well positioned to gain from real asset demand hedging. Forecasting analysts will monitor near-term Federal Reserve rhetoric, namely with leadership transition speculation, because such an occurrence would have the potential to induce a re-pricing of inflation-sensitive sectors. Forecasting analysts will monitor rent-equivalent pricing trends as well as medical services CPI readings for signs of additional core resistance toward inflation.
Market Breadth Overtakes The Great 7

Further analysis of current leadership reveals that despite a 6.4% year-to-date advance for the S&P 500, leadership is drifting away from the historically leading tech titans. Top 10 leadership, topped by Palantir (+89.25%) and NRG Energy (+66.58%), is not among the so-called “Magnificent 7,” a result that breaks from tradition that only the big-cap tech titans can potentially be the driver of market momentum. Only three out of the seven titans are currently outperforming the index, which points to growing market breadth and more rotational in nature of recovery.
It runs parallel to historic themes of previous economic upcycles, e.g., the 1990s when industrial and hardware industries surprised everyone with leadership amidst a whirlwind of enterprise tech buildup and infrastructure boom. This year’s relative leadership of the category of industries like Seagate and Jabil validates that analogy. Artificial-intelligence infrastructure demand-driven revenue bursts are being stoked while legacy tech valuation looks perfectly priced. This cycle sector shift that gets reconfirmed through diversified flows implies that investors are gearing up for structural acceleration, not speculative momentum.
We note Jabil Inc. (JBL) as undervalued for this cycle. Direct exposure to artificial intelligence, cloud infrastructure, and scale manufacturing makes it well-positioned to benefit from this trend. Strategists must look for enduring EPS shifts among industrial tech names, track capex shifts along the AI supply chain, and look for ETF shifts that are a reflection of institutional conviction that the more encompassing sector is due for a rebound. This rebound of non-tech names is not a coincidence—it’s a reflection of underlying economic recalculation back to real, productive investment.
Etf Flows Indicate Capital Rotation Strategy

Most recent $3.48 billion injection into global equity ETFs is a watermark of investor confidence, all the more so after a rough start to the year. Although Q1 2025 had already seen a record $211.58 billion of equity ETF flows, the recent week’s inflows suggest optimism is returning after a few ongoing macro risks. U.S. large-cap ETFs saw a total of $0.50 billion, which suggests a clean sweep of investor desire for stability, period, while equity flows from other regions. This development suggests a strategic positioning towards quality names that have healthy balance sheets, which are best bets in a rising-rate environment.
With this underlying interest in bond markets. The $1.78 billion government bond inflow indicates new interest in government debt, often neglected in equity-driven ramps. Yields at the 5% level and quantitative easing policies in reverse are situations where government debt is once more alluring as a contrarian. The classic inverse stock-and-bond correlation is stretched, particularly with higher rates presenting concurrent opportunity in both asset classes. There is portfolio rebalancing with two-track focus on yield and resiliency.
We consider Vanguard Mega Cap ETF (MGC) to be inexpensive on a relative capital rotation basis. Its weighting towards superior-tier U.S. large caps places the fund directly in the middle of this strategic rotation. Trends are optimally followed by analysts through net ETF flows, cross-asset correlations, and 2–10 year treasury real yields to measure capital concentration risk and liquidity flows more broadly. This recent surge in inflow is more than a technical bounce – it could be signaling an institutional rotation into a defensive positioning of equities through persistent global uncertainty.
Wage Increase Slows Down In Major Sector, Raising Signals

Transportation and merchanting sector wage advance moderated to 3.6%, lowest level since early 2021, said Atlanta Fed’s Wage Growth Tracker. This development implies Federal Reserve’s monetary policy tightening cycle now affects labour markets more freely, a possible preview of which can be observed particularly for large GDP-contributing industries. As the industry being a source of 9.4% of U.S. economic activity, a similar moderation could be a possible preview of more broad-based disinflationary gain of wage-sensitive industries.
This is supported from history that higher interest rates are effective for stemming wage inflation, specifically for supply chains and services. Ongoing labour cost pressure declines could be the foundation for the Fed storyline of a “soft landing” through labour market balance reconciliation with a lid for inflation. With flatlining real incomes and household demand having potholes of weakness, wage moderation could be predicting the less spectacular second half of the 2025 economic cycle.
We think FedEx Corporation (FDX) is cheaper than today on these assumptions. With labour cost headwinds losing some steam and shipping demand poised to stabilize inH2, the company will gain from improved margin fundamentals. Subsequent publication of the employment cost index, industry-driven employment patterns, and inflation-adjusted wage growth will be monitored for analysts to see if aforementioned deceleration is taking place among more general transport-related equities. This soft-landing strategy hinges on wage control without disrupting productivity—andtransport wages are the coal mine’s canary today.
Wage Gap Widens As Low-Income Earners Lose Momentum

Today Atlanta Fed Wage Growth Tracker presents a disturbing widening of the wage gap. Through the latest available, wage growth for the lowest-paying quartile falls to 3.7%, and for the highest-paying quartile remains at 4.7%. It is a widening income gap that goes against the pretense of broad-based economic recovery. It was this pattern that first appeared after 2008 and re-emerged more acutely in 2025, which is equivalent to structural inequality running deep beneath headline macro stability.
Wage stagnation of lower-paying jobs goes back historically a long way. If minimum wages had maintained pace with productivity since the 1960s, the current baseline today would be greater than $18—well above today’s level of $7.25. Dollar-in-hand depreciation of low-end compensation compares alongside acceleration of the high end, causing undue exposure among the majority of the inflation- and economy-tightening-affected workforce. Compression of wage scales remains a large drag despite forays of fiscal redistriution.
We highlight Dollar General Corp. (DG) as cheap to our current market condition. Its business feeds on lower-income traffic, which surges when income stress starts. As wage gains trail this cohort, demand for discounting can be reignited. Analysts, we think, must track actual wage dispersion trends, labor-population ratio for income groups, value-conscious chain store retail foot traffic for defensive sensitivity analysis. The more extreme income inequality worsens, market resistance depends on which stocks are cushioned through the imbalances deflecting consumption.
Air Travel Surges As Consumer Confidence Holds Firm

TSA 20-day rolling passenger numbers averaged over 2.4 million per day in mid-2025, the highest since prior to the global slow-down. Ongoing travel pick-up defies conventional economic theory, which not only presumes healthy sector demand but a revival of consumer confidence. Confirmation in July supports the trend with day screenings remaining constant at 2.3 million, which supports more general sentiment that discretionary spending, more specifically, spending on experiences, is healthy despite more frugal financial conditions.
This upbeat momentum is in line with big aviation organizations’ estimates of 4.7% of world air traffic growth per annum, based on structural drivers of demand as opposed to sheer economic growth. Hybrid working flexibility, underlying demand for travel, and hedging cost absorption have helped airlines to maintain load factors despite pricing discipline. Such new trend defies traditional models in linking macro headwinds to more subdued leisure and business travel, and this indicates that new behavioural norms are insulating some of the economy from usual contractions signals.
We believe that Delta Air Lines (DAL) is cheap at these levels. As a legacy carrier with perfectly balanced transcontinental exposure, we believe that it is best situated to capture volume recovery without simultaneous cost exposure of peers that are lower-cost. Capacity, spread jet pricing for, and advance bookings through international business channels need to be monitored for analysts to see if throughput trends sequentially translate to margin expansion. Travel demand is more than a barometer of the seaso these days – it’s a post-cyclical indicator of structural re-alignment of consumers.
Recession Risk Recedes, But Forecast Reliability Remains Doubtful

The most recent Wall Street Journal survey gives a mean recession probability adjustment downwards for the U.S. over the current 12 months to 33% in July 2025 from 45% previously in April. It sees fresh hope for policy reversals including the lifting of enormous tariffs, dissipating of trade tensions, and re-acceleration of capital flows back to central industries. But underneath headline euphoria is a patchy recovery of frail productivity, lukewarm consumer sentiment, and lethargic housing market that remains a drag for the growth prospects.
J.P. Morgan’s initial 2025 forecast also suggests a retreat from the risk of a recession, with less tension from trade and normalized supply chains across the globe. Economists are less sanguine, observing that these are improved, yet most of the headline metrics—factory output, true pay gains, for instance—are still not leading the curve. History deserves the skepticism: studies indicate that economists got only a little more than 1 out of every 4 recessions correctly, so the current 33% call is a sentiment gauge, not firm fact.
We believe that Prologis Inc. (PLD) is still undervalued relative to this normalising backdrop. Its warehouse properties portfolio provides defence exposure by way of normalisation of trade and resilient e-commerce demand. Trends in freight indices, port city warehousing demand, and real final sales statistics must be monitored so that a call can be made on the strength of real economic resilience. As headline recession questions evaporate, quality must be valued in the cyclical universe—where resilience is not a birthright, but acquired by way of operating supremacy and positioning.
Young Buyers Turn To Family And Crypto As Homeownership Hurdles Rise

Redfin’s new survey indicates a seismic shift in the entry of young Americans in the home purchasing market. 20.7% of Millennials and Gen Z are now leveraging family cash gifts to finance down payments, a percentage that jumps to 38% of buyers under age 30 who have inheritances. This represents a widening affordability gap, as home prices have climbed 30% since 2020, more than tripling of pay increases during initial careers. Income streams of more conventional forms are insufficient, as 43.5% of these buyers are not even utilizing paychecks to buy homes.
What sets this cohort apart, apart from financial interdependence, is innovation. 12.7% of Gen Z had financed their downpayments from the sale of cryptocurrency—compared to 0.5% of Baby Boomers. This aligns with deeper behavioral changes which more recent economic research records of younger generations toward volatile, speculative investments as alternative routes to riches. Ineffective saving through conventional avenues in the face of rising housing costs and inflation is leading such buyers to find such financing types increasingly in nonconventional forms.
We believe Rocket Companies Inc. (RKT) is undervalued in these dynamics. As the top digital mortgage lender, RKT is poised to capture non-traditional buyers who want to close faster, more flexible financing. Investors must remain attuned to fintech adoption by first-time buyers, changing loan-to-value ratios, and institutional participation in crypto-collateralized lending solutions. The changing profile of the U.S. homeowner is more
COMING ECONOMIC EVENTS
GBP CPI y/y, USA Core PPI m/m, USA PPI m/m
As the global economies come to a crossroads, this week’s economics agenda presents a triple threat of inflation data that can influence policy shifts and sentiment in the market. As the policymakers come to critical points of decision-making, tensions are building in all these releases. Whether UK cost of living figures or core U.S. producer prices trends, market participants and economists will be scrutinizing these prints for hints on the direction of interest rates as well as the plausibility of disinflation stories.
GBP CPI y/y
The U.K.’s year-on-year CPI reading is still one of the most closely watched statistics by currency and fixed income markets.
- Better-than-expected print would see inflation being more intransigent than expected, i.e., could compel the Bank of England to leave interest rates above target for longer. That would be good for the pound but would be bad for rate-sensitive areas of the market such as property, consumer services, and small-cap stocks.
- If, on the other hand, CPI disappoints to the downside, that would reconfirm the monetary easing thesis, leading to a gilts sell-off and a rotation into domestically-exposed assets such as banks, retailers, and builders. Whether that is the trigger remains the question of whether or not the BoE believes inflation progress is sufficient to justify a change of course from its current policy trajectory prior to year-end.
USA Core PPI m/m (United States Core Producer Price Index, Month-over-Month)
This inflation barometer, stripping out volatile foodstuffs and energy units, gives a purer picture of underlying producer cost pressures.
- A greater-than-Expected Core PPI reading would be likely to reignite fear that supply-side price acceleration reaccelerates, and that would be unwelcome news to the Federal Reserve en route to a relaxation of policy. Such would be likely to prompt a short-term jump in Treasury yields, a stronger U.S. currency, and valuation strain for high-growth equities, particularly techs and biotechs.
- A less-than-Expected reading, on the other hand, would be interpreted to affirm margin pressures are relaxing for corporates, supporting earnings estimates, and that would prompt a likely rally amongst equities, particularly industrials, transport, and consumer discretionary.
USA PPI m/m (United States Producer Price Index, Month-over-Mon
The broad PPI print, encompassing food and energy, gives us a reading of headline producer trends in inflation.
- A larger-than-forecast reading for the PPI could be a warning that input costs are running riot – perhaps previewing a fresh round of pressure for CPI and clouding the timing of a Fed interest-rate decrease. In that scenario, input cost-sensitive areas like manufacturing, shipping, and retailers could be stressed but aided by a steeper curve.
- A softer reading for the PPI, meanwhile, would be a confirmation of the theme that inflation is slowing on all fronts, supporting equity values and perhaps initiating a slide for bond yields, most prominently at the intermediate segment of the curve.
In combination, these releases will give us a current snapshot of the evolution of inflation dynamism of major economies. Interest remains centering around the direction of bias of the inflation surprise/consensus, central bank reaction themes, and possible implications for real yields and sector rotation. For shares, indications of flattening of inflation are sought for cyclical/tech consumer turn, but hotter readings are demanded for defensive positioning with energy, value, financial tilt. than a story of generations—it’s a harbinger of more structural change within the nexus of capital and shelter demand.
STOCK EXCHANGE PERFORMANCE
Indexes Recovered from April Lows, but Member Loss Drawdowns are Substantial

Equity markets have posted a firm recovery since the beginning of April 2025, but member-level performance and collective year-to-date drawdowns indicate that there is still pressure. While headline returns do appear robust enough, the internal fabric of the market indicates selectivity rather than broad recovery, and growth stocks and small caps trailing behind.
The below is the current performance in bullet points:
S&P 500: Trend Buoys Up, but Expansion Remains Spotty
S&P 500: +7% YTD | +26% from 4/8 low | -19% from YTD peak | Avg. member: -24
The S&P 500 was 7% higher year to date and bounced back impressively off April lows by 26%. Yet, a highest drawdown of -19% and the mean member drawdown of -24% indicates a routine bunching of performance in a handful of names, which are pharmaclying a larger overall weakness.
NASDAQ: Strong Reversal, but Risk Premium Still Intact
NASDAQ: +7% YTD | +35% from 4/8 low | -24% below YTD high | Avg. member: -45
The NASDAQ ended the year to equal the S&P’s YTD gain but was the best major average performer with a 35% recovery from the April low. However, the -24% YTD peak-to-trough drop and astronomical -45% ave. member drawdown still attest to the decoupling of index returns from corporate technology sector performance.
Russell 2000: Lacklustre Recovery Points to Stay Away
Russell 2000: +1% YTD | +28% from 4/8 low | -24% below YTD high | Avg. member: -36 Small-cap shares have only shown a 1% YTD advance following a healthy 28% recovery from a bottom touched back in April. Another -24% decline from tops and regular drawdowns to -36% confirm risk-off for now versus small, thinly traded issues.
Dow Jones: Defensive-Biased Tilt Contributed to Relative
Dow Jones: +5% YTD | +18% from low of 4/8 | -16% from YTD peak | Avg. member: -23% The Dow demonstrated relative strength with 5% YTD gain with lowest drawdown from highs among all of the major indices. The -16% pull back and -23% averagemember loss, however, indicate the conservative tone that can be observed throughout all of the equity markets.
THE STRONGEST SECTOR IN ALL THESE INDICES
Industrials Lead the Charge as Broader Market Rotation Unfolds

Recent industry action as of July 14, 2025, identifies an unchallenged top performer among S&P 500 industries. Industrials led the charge to the lead with a commanding +14.6% year-to-date gain, handily outgaining the collective index rise of +6.6%. Augmenting a +2.4% month-to-date gain, this industry indicates robust investor optimism with ongoing infrastructure spending, automation demand, and mending of global supply lines.
Other market leaders are Information Technology and Communication Services, which are also up +9.6% and +9.2% YTD, respectively. Both, however, abruptly broke away for the month with the former reverting back -1.0% and the latter modestly only +1.4%, which could be a sign of lagging momentum from the steady course of Industrials. Also at the forefront is a +4.1% month-to-date gain for the Energy sector, albeit in positioning, with a +3.1% YTD advance.
We still see Caterpillar Inc. (CAT) as undervalued on a play in the Industrials space. Its cyclical exposure to infrastructure and resource-intensive capital expenditure cycles positions the company well for a gain at the top of the sector. Strategists will have to monitor industrial production data, manufacturing bookings, and upcoming earnings on capital goods to validate extrapolated momentum. Leadership rotation to Industrials indicates healthier market rotation with the shifting of capital from speculative tech to more sustainable growth.
Earnings Recap: JULY 15, 2025
- JPMorgan Chase & Co
JPMorgan Chase & Co. reported second-quarter adjusted earnings per share of $5.24 a share, above forecast, as net income was $15 bn (or $14.2 bn excluding significant items). Revenue fell 11% to $44.9 bn, but trading units recorded positive activity and fees of the investment bank rose 7% to $2.5 bn. Non-performing assets rose, while reserves for loan losses fell. CEO caution remains as inflation rises and international tensions are heightened.
- Wells Fargo
Wells Fargo reported EPS of $1.60, revenue of $20.82 bn (0.6% growth), and 11.9%-higher net income of $5.49 bn. Interest income fell 1.8% to $11.71 bn, however, and NII guidance for the year was reduced. Shares dropped ~6
- BlackRock
BlackRock achieved record $12 tn AUM, but revenue and earnings only came short of estimates. AUM growth was hindered by fund redemptions, causing ~5% share decline.
- Citigroup
Citigroup led the charge with EPS of $1.96 from revenue of $21.67 bn, which was up 8%, owing to a 12% rise in net interest income to $15.18 bn and spirited deal-making. Shares hit multi-year highs.
- The Bank Of New York Mellon Corporation
BNY Mellon beat expectations with $1.94 adjusted earnings per share, $5.03 bn revenue (up 9%), 17% increase in net interest income to $1.20 bn, and 7% increase in fee income. It also raised its dividend.
Critical themes
Loan and trading development drove most banks, but NII headwinds impacted NPBH and JPMorgan. Asset manager BlackRock must deal with mixed sentiment despite asset development. Investors must be mindful of sustainability of fee revenue and net interest margin trends despite current macro uncertainties.
Earnings: Today (July 16, 2025)
- Johnson & Johnson
Consensus numbers are between $2.66–2.68, a decline of ~5.7% compared to the previous year. Pharmaceutical sales, pipeline growth Bank of America (pre‑market): Led EPS of $0.86 (up 3.6%). It is predicated on the direction of net interest income (NII) and trading income. Being a large‑cap bank, bank-wide trends can be validated through earnings.
- Morgan Stanley
Estimating EPS of $1.93, +6% YoY. Watch for institutional securities revenue, flows from wealth management, and trading-desk activity
- Goldman Sachs
Consensus estimates of $9.43–9.59, +9% YoY. Investment bank fee income, asset & wealth management revenue, and trading are key watchpoints.
- Progressive Corporation (THE)
Projected earnings of $4.30–4.36, +62%. Investors must be watching car insurance loss ratios, underwriting margins, and pricing strength closely.
What to watch: Of the financials, watch for NII, fee trends, planned capital returns, and trade volumes in a period of rate uncertainty. Insurance earnings will be influenced by loss trends and reserve adequacy. Consistency in these reports could establish tone ahead of broad Q2 earnings.
Stock Market Summary – Wednesday, 16th July 2025
Markets are optimistic but guarded as relief for U.S.–China trade tensions and chip-export policy easing squares off against continued inflation concerns. Optimism for relief for technology-growth today is muted for the time being by macroeconomic data that discourages Federal Reserve policy course.
Stock Prices
Economic & Geopolitics Drivers
More recent readings of inflation reveal that prices surged more than previously anticipated in June, diminishing chances of a near-term interest-rate cut. This shift in the interest-rate environment is seen through the market through the strengthening of the dollar. Geopolitically, the U.S. temporary suspension of the export embargo of shipping Nvidia H20 chip to China, from a wider 90-day tariff truce, supported chip shares, amongst other artificial-intelligence-related issues. Investors are, nevertheless, searching for even a re-emergence of tension that will dissipate the atmosphere.
10 Biggest Winners of the U.S.–China Truce on AI
Semichips players’ truce provided fresh buying interest towards top players of the semiconductor and technology hardware industry. Top market movers are:
- NVIDIA (NVDA)
- Taiwan Semiconductor (TSM)
- Advanced Micro Devices (AMD)
- Broadcom (AVGO)
- Alibaba (BABA)
- Micron (MU)
- Qualcomm (QCOM)
- ASML (ASML)
- Astera Labs (ALAB)
- Baidu (BIDU)
Nvidia shot up almost 4% on the word, with TSM and AMD grabbing big gains, too, a reflection of artificial-intelligence infrastructure and semiconductor exposure that’s returning.
The Mag 7 and the S&P 500

While Nvidia led the charge, the rest of the “Magnificent 7” still endure valuation anxiety. Alphabet, Amazon, and Apple lag behind overall S&P 500, which is the clear indication of a market that still depends on selective genius more than widespread engagement. S&P is stuck, supported by techs, defensives, but subject to profit-taking of utterly stretched names.
Major Index Performance through Wednesday, July 16, 2025
- Nasdaq Composite: lower modestly, as overall tech profit-taking offsets gains in AI.
- S&P 500: flat, powered by a large-cap advance.
- Russell 2000: underperformance, a reflection of residual small-cap risk
- Dow Jones Industrial Average: inched higher, driven by advances for financials and industrials.
The day balances on a thin line of hope in terms of trade over reality of inflation. Semis supported by the truce of AI, but macro data and interest rate direction uncertainty are holding the upper-upside hostage.
Gold Price – Wednesday, 16th July 2025
Gold prices trade at around $3,334 an ounce, a measured statement of investing resolve even in a murky terrain of bogged-down-inflation, geo-political risk, and central-bank ambivalence. In yesterday’s modestly stronger-than-expected U.S. CPI release, there was confirmation of the idea that interest-rate reductions could be put off one more day, an idea that convinced speculators to move once more to gold before serving an insurance role. With core inflation pressure still solid and some uncertainty regarding interest-rate levels once more, institutional demand for an inflation refuge has kept gold in place even as yields were modestly constrained along with a robust U.S. dollar.
Today’s economic calendar is vital. Should there be a surprise to the upside in the U.S. Core PPI and PPI m/m readings, it will solidify the narrative of stuck inflation, further buttressing a gold rally. By comparison, Trump’s recent run of comments, from urging a 3-point interest-rate cut, imposition of a 35% Canadian-import tariff, to renewed endorsement of digital wallets legislation, has re-introduced volatility back into the macro-political sphere. His attempted ejection of the Fed Chair, not to mention his explicit rejection of monetary policy autonomy, are soon to impact investor sentiment, further solidify gold as a hedge not just against inflation but against institutional ambiguity. Should the readings for inflation today run hot, they can stoke these forces and lift gold higher as the world adopts a risk-averse inclination.
Oil Prices Wednesday, 16th July 2025
Oil prices are trading at about $68.80–$69.00 for Brent and roughly $66.80 for WTI on Wednesday. Prices are reacting to a mix of seasonal optimism about demand and increasing risks to supply. Bases for the upside are growing refinery runs for China and robust U.S. summer travel, but OPEC was left with a call for firmer global economic pick-up for H2 2025, expecting a pickup in demand that has underpinned its recent move to raise output by more than 548,000 barrels per day for August. Its International Energy Agency counterpart is more guarded, expecting an oversupplied market for the rest of the year based on a deceleration of emerging market growth and the start of stocks builds.
Recently, via energy markets, including plans for holding back oil prices at flat levels and Russian oil symbolism target, specieied volatility. As the markets themselves flatly dismissed flat-out implementing sanctions, the tone, however, induced near-term ambiguity, particuarly via speculative positioning. Doves of yesterday lower outside-the-United-Staes inflation prints, dovish Federal-Reserve talk, again forcing crude via demand acceleration suppression. This eroding of inflation-driven interest-rate suppositions for energy usage projections, particuarly via transsport market and industrial output. In the near term, U.S. Core PPI and PPI readings today will be of greatest importance. Above-forecast print will confirm the industrial strength narrative, which will be bullish for oil in the face of firmer demand. In the event of numbers confirming easing of price pressures on producer inputs, a sell-off for oil may be initiated, with market attention shifting to a more conservative macro environment. Traders are also keeping an eye out for further rhetoric from the OPEC and IEA for a shift in supply anticipation.
Bitcoin Prices – Wednesday, 16th July 2025
Bitcoin holding at $117,545, steady after yesterday’s slight pullback from all-time high at $120,000. This bull run shows clear institutional buying, with Standard Chartered revealing Bitcoin and Ether spot institutional client trading and Grayscale new SEC filing for blue-chip digital asset ETF. Big inflows into US spot Bitcoin ETFs are the result of adoption increasing, analysts attributing recent price gain more long-term positioning of cash than retail speculation. Yesterday’s CPI report, reconfirmation of stickier-than-anticipated inflation, supported Bitcoin playing role of inflation protector alongside attributes of a decentralised store of value.
President Trump week of policy announcements—they are a statement that “digital assets are the future,” a three-pronged call for a rate cut, and a promise to trump more crypto legislation than Congress—stunned the digital asset ecosystem. These announcements, with threats of tariffs and speculations of a switch of Fed Chair Powell, injected new volatility into legacy markets but re-solidified Bitcoin’s storyline of being “digital gold.” Trump re-affirmed approval of crypto, of all things during a “Crypto Week,” a long-term strategic move to Associate digital assets firmly with U.S. policy. As readings of inflation continue to surprise, and rhetoric only more uncertain, Bitcoin becomes more seriously considered insurance from institutional and macroeconomic frailty. If today’s readings of PPI solidify producer-side pressure accrues, expect new momentum with rising volatility communicated through crypto markets.
ETH Prices – Wednesday, 16th of July, 2025
Ethereum currently lies at $2,981, flat off a near 18% advance for the week. This was largely due to a spell of institutional buying, most notably through spot ETF flows, amounting to some $383.1 million. BlackRock led the largest buyer, reportedly taking a day to acquire 106,827 of ETH, which bolstered market sentiment. Also publicly disclosed was a strategic purchase of 10,000 ETH treasuries from SharpLink Gaming, further confirming the growing use case of Ethereum as a corporate and institutional-grade asset. It was a large technical breach for ETH, which broke through key resistance levels now testing the upper range of $3,820, positioning itself for a breakout, subject to overall market sentiment being supportive.
Whale buying is acting as a primary driving factor for Ethereum’s major dynamics. In spite of the appearance of a small sell of approximately 1,207 ETH from some top-tier holders, whales collectively acquired more than 240,000 ETH since the beginning of the month—a clear indication of strong conviction from high-net-worth market players. Such buying is keeping available supply for the backseat, exerting upward pressure on prices. In the meanwhile, yesterday’s CPI release further solidified prevailing inflation, further validating the thesis of Ethereum—coupled with Bitcoin—cryptos as digital hedges against fiat risk. If today’s U.S. PPI report reflects sustained input cost pressure, the resulting thesis of Ethereum as a long-duration inflation-hedged asset can only gain momentum, which can otherwise push ETH towards new 2025 highs.
