Where Are Markets Today?
There was a sudden decline in U.S. equity futures on Thursday night following President Donald Trump’s declaration of a 35% surtax on Canadian goods, effective Aug. 1. S&P 500, Nasdaq 100, and Dow Jones Industrial Average futures declined, down 0.48%, 0.57%, and 0.45%, respectively. The new declaration has been the catalyst for a fresh shock of rising protectionist tensions and the danger of a fresh wave of volatility to the economic fate of the globe. Though various sector arenas have been encouraged by past uncertainty about the subject of commerce, the new proposal of a surcharge remains another risk element to the economic fate of the globe.
The effect of these events wasn’t limited to the U.S., as European equity futures indicated the same direction as mixed reactions were witnessed on the major indices. Pressure was put on the Euro Stoxx 50 futures, Germany’s DAX, and the U.K.’s FTSE 100, specifically the export-linked sector. European investors are particularly vulnerable to World Trade disruption, as a significant part of the continent’s economic activity relies on cross-border commerce. Fears about likely retaliatory tariffs and higher cost of manufacture have affected investor sentiment in these jurisdictions.
One of the major reasons behind the bearish opening is increasing skepticism about the repercussions of such tariff announcements. Increased tariffs for Canadian imports and President Trump’s commentary about things still to come—like tariffs for drug goods—are raising concerns about the global economic system seeing yet another bout of turbulence. Unlike the current situation, investors are worried about the impact these policies are going to have upon corporate earnings, particularly for corporations which are highly dependent upon the global supply chain as well as imports.
More broadly, mood across the market lags as investors wait to see what’s next. Timing, when the U.S. equity markets were basking in the triumph of the good earnings, bolstered by the good performance of the technology sector, the tariff announcements have investors scale back expectations, waiting for another set of information on what the case with Canada and the rest of the trade allies have in store. With such intricacy, the market players are gearing up for increased volatility as the situation unfolds.
Major Index Performance to Jul 11, 2025
- S&P 500: Closed at 6,280.46, 0.27% higher for the day
- Nasdaq Composite: Closed at 20,630.67, up 0.09%, a new all
- Dow Jones Industrial Average: Increased 0.43% to close at 44,650.64
- Russell 2000: Closed at 2,092.10, a slim gain, but fell 5.7% year-to-day
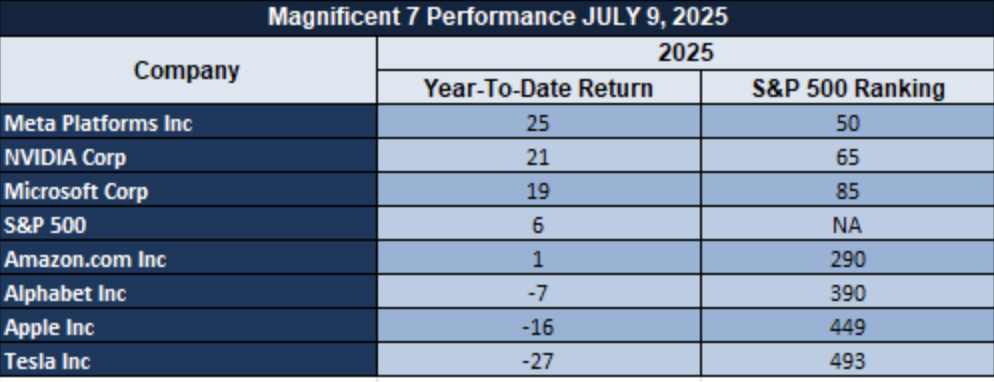
The Mag 7 and the S&P 500 Index
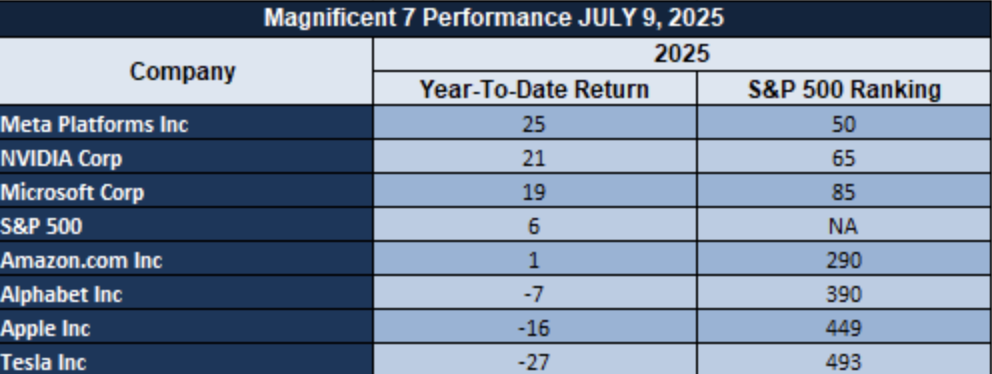
The “Magnificent Seven” tech leaders—Nvidia, Microsoft, Tesla, Apple, Alphabet, Amazon, and Meta—have been behind the recent rise of the S&P 500. These shares have ridden the wave of innovation in artificial intelligence and cloud computing to post strong earnings and investor demand. Their large index weightage ensures that their performance still plays a big role in determining the direction of the S&P 500. While they have dominated the scene, these shares have come under some pressure lately as the market rethinks valuations and investor sentiment.
Drivers Behind the Market Move – Friday, July 11, 2025
As the world becomes more open to markets today, several determinative considerations are influencing investor sentiment in the U.S. and Europe. The recent sudden emergence of U.S. trade policy, particularly the President’s threat to impose a 35% tariff on imports from Canada on August 1, has injected new uncertainties into the market. Further, economic data emerging over the week, including a remarkable decline in U.S. jobless claims, are inducing reappraisal of economic fundamentals. Those considerations are contributing to a conservative marketplace attitude.
1. Escalating Trade Tensions
President Trump’s 35% tariff on imports from Canada has been a source of concern on the likelihood of an escalation of the trade war. His move comes after a series of tariff actions, including a 50% tariff on copper, and threats to impose the same tariffs on other trading partners. Investors are concerned with the economic implications of the policies, which will have the effect of splintering supply chains and increasing the cost of doing business for companies. Uncertainty around these trade measures is the source of the volatility in the market.
2. Mixed Economic Indicators
Economic statistics published during the week paint a mixed picture of the U.S. economy. On the one hand, while a week’s worth of jobless claims fell unexpectedly to a seven-week low, painting a picture of strength in the labor market, others are warning of possible signs of distress. For example, inflation worries as well as the effects of tariffs on consumer prices are shaping investor sentiment. Such conflicting indications are encouraging market participants to be measured.
3. International Market Responses
The European markets are taking U.S. trade policy changes cautiously in stride. European futures have fallen, summarizing fears about the spill over into world trade of U.S. tariffs. Further, the stronger U.S. dollar compared to the euro is impacting European exporters, which may endure weaker competitiveness in foreign markets. All of these are creating a riskier European investor. Throughout the globe, rising trade tensions, differing economic information, and responses from overseas markets have been the major impetus for current activity. Those investing are doing cautiously as the ambiguity clings for additional information that could better define the current economic landscape.
DIGESTING ECONOMIC DATA
TRUMP Tweets and Their Implications
======================================================
President Trump’s recent tweets and statements have been the catalyst for major marketplace responses, specifically involving international supply chains and U.S. economic policy. In his newest statements, Trump revealed a 50% tax on copper, further raising tension involving U.S.-trading partners. His statements involving the potential 200% tax on pharmaceuticals contribute to another element of uncertainty, specifically involving international supply chains. As such statements persist, they summon further volatility through the space involving commodities, with spot price responses involving copper. Additionally, the U.S. dollar strength should continue to benefit as a policy shift could have investors move to dollar-denominated assets, as a result of upcoming economic uncertainty at home.
Trump also asserted that he believes “Musk’s party” will make America proud, a vague remark that can most reasonably be interpreted as recognition of the sway of Elon Musk in the technology and automotive industries, where there has been heavy investment in U.S. infrastructure and energy projects. As Tesla and SpaceX grow in prominence abroad, Trump’s words could serve as additional fuel for positivity in the U.S. industrial and tech economies, fueling stock appreciation in companies most connected to Musk’s projects. Such words do, however, run the risk of fueling an increasingly protectionist agenda that would be guaranteed to spark retaliatory measures from foreign trade partners and ignite additional geopolitical turmoil. Correspondingly, Trump’s statements about possibly having to “straighten out” New York City and, through extension, “take control of the governance of Washington D.C.” imply a bigger political realignment that could have risk asset as well as sentiment in the marketplace consequences. His political moves have major consequences investors need to factor in, as they have the potential to signal political turbulence that isn’t conducive for investor sentiment, notably when it causes legislatorial standstills or policy changes that retard marketplace growth.
On the implications front for larger financial markets, Trump’s inclination towards more aggressive trade policy and his repeated comments on the Federal Reserve needing to cut interest rates can produce a volatility mix. Tariffs and geopolitics tend to intensify inflationary pressures, which can induce investors to hayen safer-haven assets such as gold and cryptocurrencies, potentially putting pressure on the equity markets. Existing controversies regarding the trade policies, tariffs, and local rule-making can leave the market vulnerable to zagzag patterns of hopes and doubts and policy changes potentially affecting the asset classes en bloc.
Us Jobless Claims And Market Implication
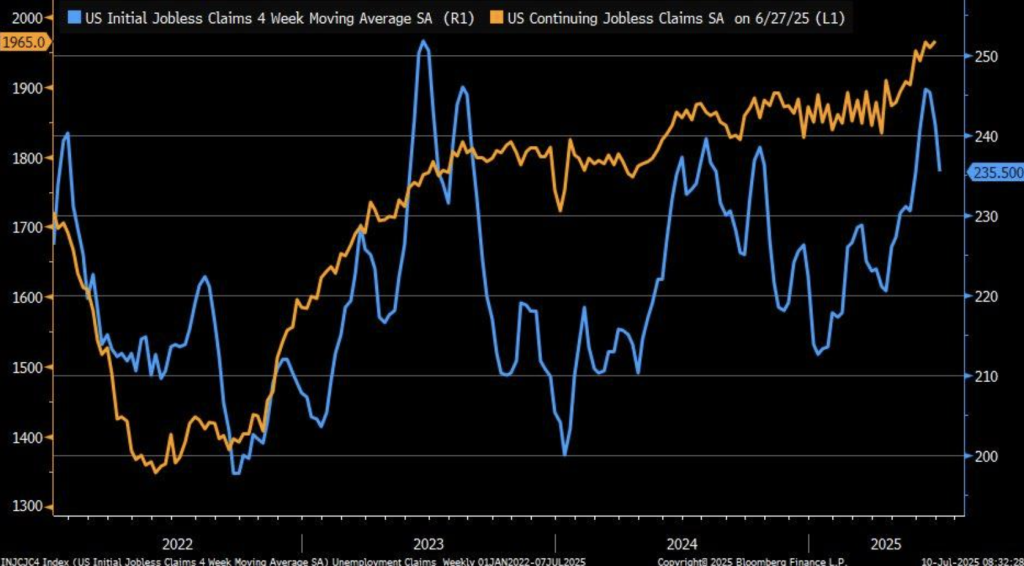
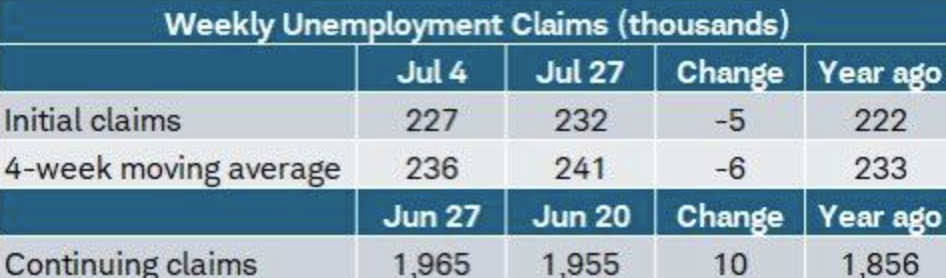
The latest jobless claims reports from the U.S. reflect mixed indications, with initial claims down to 227,000 in the week to July 5, 2025, from the estimated 235,000. The reading reflects more-than-anticipated labor market resilience in the midst of the spillover effects from the intensifying policy tensions and policy changes, including policy changes from the tariffs by the President Trump. The pull-back in initial claims reflects the ongoing general soundness of the labor market, despite the threats thereto from the newly-introduced tariffs on imported goods of whose effects some experts worried to increase the jobless rate.
But recurring claims rose to 1.965 million, 10,000 more than the previous week. The increase is seen in the increasing number of the long-term unemployed, the trend not necessarily being due to sheer transient shocks but structural changes in the labor market. The same is also seen from 2023 National Bureau of Economic Research paper, wherein the long-term unemployment has been attributed to more substantive alteration in the economy, most likely amplified by disruption of business.
Regional variation also became pronounced in the numbers, with Michigan registering an 8.8k increase in claims due to potential trouble with its auto market, severely injured by supply chains affected by policy changes. New Jersey, conversely, witnessed 4.6k claims decline, indicating regional economic strength. The analysts will be kept on the lookout for persistent regional labor market trends for future cues at policy change impacts on the most exposed industries. Stocks in labor-intensive sectors, e.g., auto and manufacture, were likely devalued and pose potential buying opportunities for strategic allocation in sync with these future trends in the economy.
What to watch for, analysts: Look for near-term movement in initial jobless claims and local labor market trends, especially in the counties where the disputed policy impacts the affected industries. It would be useful in discerning the stocks, especially those in the auto and manufacture categories, which would be undervalued and due for a recovery.
Diversification Of Capital Markets And Development Of Non-Tech Shares
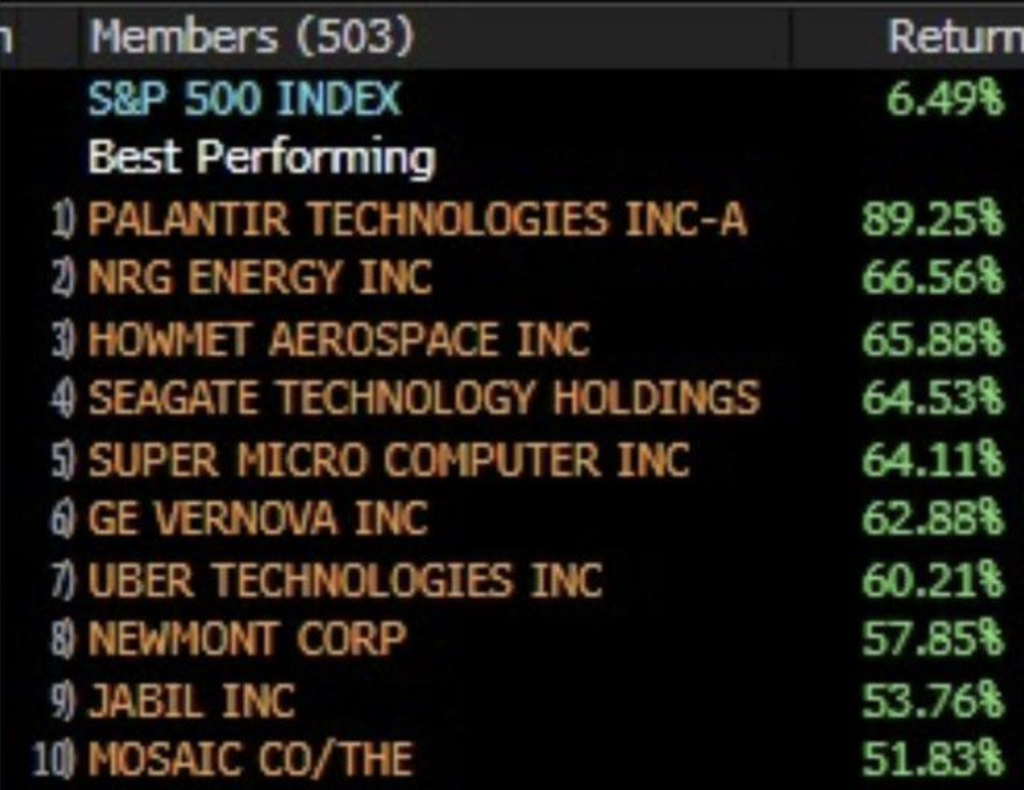
Despite the 6.4% year-to-date S&P 500 return being extremely dramatic, the self-proclaimed by themselves “Magnificent Seven” technology giants (Alphabet, Amazon, Apple, Broadcom, Meta, Microsoft, and NVIDIA) were overtaken by the surge in other stocks such as Palantir Technologies, whose gain amounts to 89.25%. The trend defies the general notion where business would be dominated by these technology goliaths as diversification of gains for other sectors emerges. The dominance of the “Magnificent Seven”no longer represents the market at large, according to latest market research by Investopedia (2025), because non-tech sectors had soared spectacularly.
The market seems to be rotating due to innovations in some industries or the promise of the economy’s return to life. Stocks such as Howmet Aerospace and Seagate Technology lead the pack in terms of positive surprises, indicating general economic vitality and interest from investors in hardware and industrial areas. The list 2025 YTD in CSIMarket also affirms the same, where non-tech areas, once dominated by technology giants, now experience more inflow. The trend reflects the radical change in investor sentiments, where the lesser or the mid-cap stocks beat the larger ones, specifically in the aftermath of the ongoing economic renewal.
Born from the 1990s history of the tech boom in which the improbable winners such as Jabil emerged, the non-Mag7 stock foray return could more be near-term trend than long-term trend. The trend echoes the words of peer-reviewed financial research journals such as the Journal of Finance (2023), wherein the cyclical movement of the market trend has been in the forefront. As analysts, we must interpret the probability of the market rotation and seek the undervalued stock opportunities in the industrial sector, wherein the moneypot potential could be in the larger ongoing economic rebound. What the analysts predict: Keep close tabs on the action in the smaller and mid-cap stocks, especially in the hardware and industrial areas, for they likely remain undervalued during this general market rotation. Monitoring the rotation in this group will be most significant to identify where future growth will come from beyond the more familiar technology giants.
Us Rental Market Trends And Implications
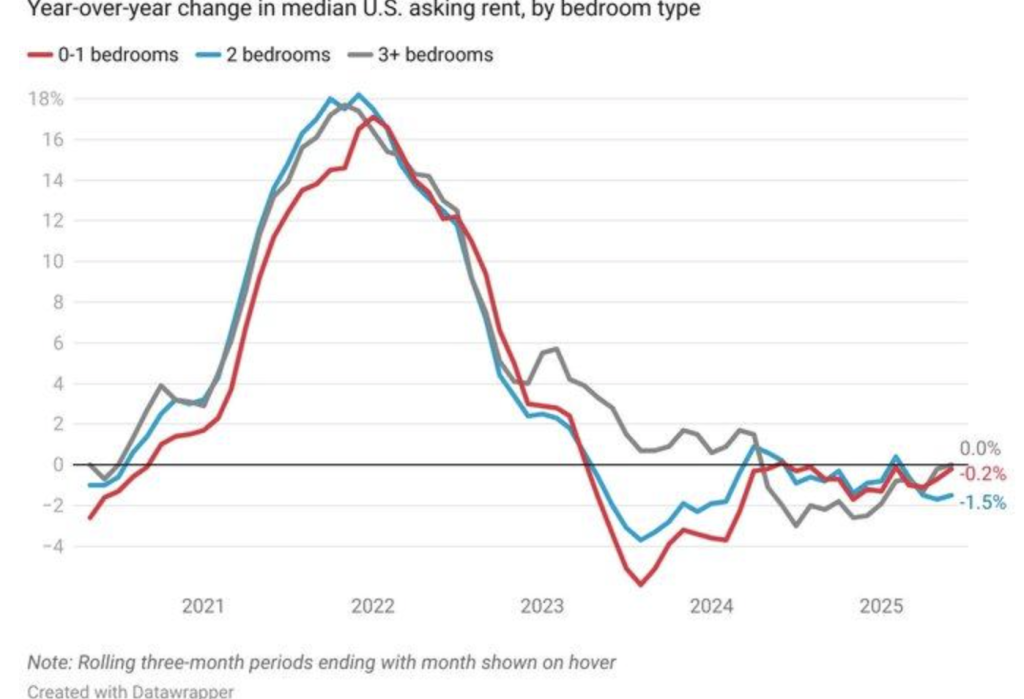
The recent trough in U.S. median asked rent on 2-bedroom units, 1.5% lower year/year to $1,713 in June 2025, is a change in the rental market conditions. The trough is consistent with the record-high rental vacancy rate of 8.2% in Q1 2025, the post-January 2021 high. The oversupply from nearly 50-year-high apartment building reflects the change from the previous couple of years, where the demand from the cities’ population growth drove the consistent rent gains. The deceleration in the rise in the rent indicates the market may be decelerating because of the type of dynamics such as available space and changes in the demand pattern.
To this trend, a 2025 National Multifamily Housing Council study reports, just 47% of the recently built flats were rented out in three months, showing quite lamentably the giddy turn towards which we have now reached where the supply currently outstrips the demand. This would imply the story of the constant hike in rents, frequently attributed to the growing urban population figures, no longer rings true where oversupply is the case. The longer empty units linger, landlords will be compelled to make changes in pricing structures, stabilizing or reducing rents in standalone markets. Economically, declining rents would cushion the inflationary impulse to the Consumer Price Index (CPI), at least to the major CPI component of Owner’s Equivalent Rent (OER). The 2024 Economic Letter from the Federal Reserve presents the theory behind declining rents shaving the pressures off the inflationary side, unless there is some kind of offsets in the form of higher interest rates or in construction costs. Assuming construction costs rose 15% from 2020, by the numbers from the U.S. Bureau of Labor Statistics, analysts must still track these trends to shed more light on the bigger impacts for inflation.
What to expect from analysts: Expect the effect the declining rents would have on the CPI, specifically the OER. Expect the effect on the stocks of companies in the construction and real estate sector, specifically the companies that deal in the construction of apartment buildings due to the probable inability of these to make profit in the oversupplied market. The changes in the dynamics of the supply and demand in the rented market will be the determining factor for the overall macroeconomic environment.
Us Auto Loan Interest And International Trends
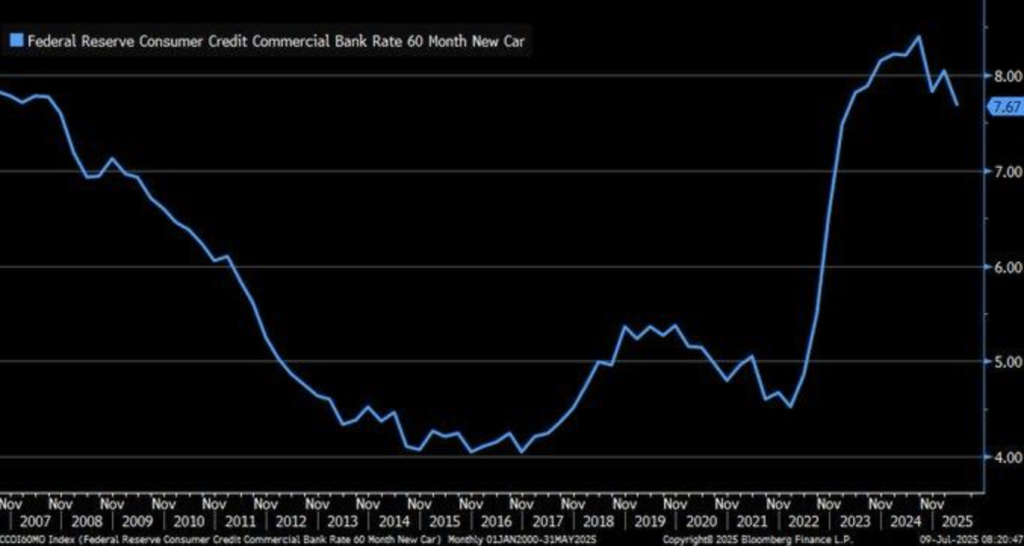
The recent decline of the 60-month new auto loan rate to 7.67% in May 2025 from 8.4% reflects the persistent economic strain caused by policy at the Federal Reserve and inflation. While the decline is favorable to the customer, the rate is still above the 4-5% pre-2020 history average. The auto loan rate’s consistent rise continues to reflect the lag effects of the rise in the interest rate by the Federal Reserve and persistent inflationary pressures in the overall economy. The auto loan rates have not declined in step with the recent benchmark reductions despite the developments, reflecting the conservative response of the lenders to the changing timescape of the economy.
Statistics in the Federal Reserve’s July 8, 2025, release of the G.19 Consumer Credit report also validate the trend. The report explains the reason that, although there were some cuts in the interest rates in various markets, auto loan rates are still high due to lenders adjusting to the higher benchmark interest rates and higher resulting motor vehicle prices. Bankrate’s 2024 U.S. lending trend survey points to these reasons to be responsible for the more sluggish pace of rate adjustment to eventually drive the price of the auto loan higher for the consumer, especially in the high-cost market.
In the unprecedented trend, worldwide figures in the 2014-2024 report by Statista substantiate car ownership in chosen Asia-Pacific and African nations in excess of the United States now, showing the worldwide trend to the impact on domestic interest rate change and loan demand. The result is U.S. purchases will still be disadvantaged in achieving affordable car financing as car loan competition in international markets becomes increasingly dominant, and car shortages persist on impacting vehicle supply and prices. What analysts should be on the lookout for: Analysts would be on the lookout for wider economic effects on the automobile industry and spending performance of automobile loan rate trends’ prolongation. Moreover, world trend changes in car ownership might influence home demand, whose effect would be transmitted to U.S. automobile loans and cars’ prices. Undervalued automobile and bank stocks may prove investment opportunities depending on the market’s response to these changing dynamics.
Receding Revolving Credit And Consumer Spending
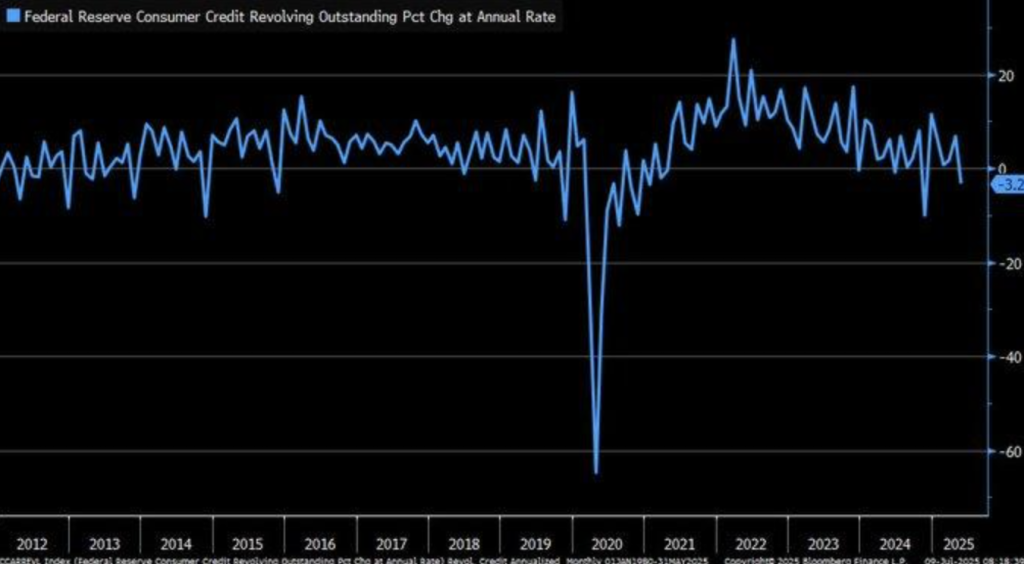
The sudden 3.2% annualized revolving credit decline for May 2025 in the Federal Reserve’s G.19 Consumer Credit statistics is the second-biggest decline since 2021. The revolving credit, including credit cards, is traditionally one measure of consumption spending and confidence. The enormous decline is only one indicator of the possibility of shifting consumption patterns in the face of ongoing economic unease. The decline is the opposite of the normal trend for credit expansion, and it signals even more cautious spending by the consumer, albeit possibly to relieve financial stress.
This reversal in credit growth matters as IMF activity in 2021 has charted the manner in which these declines have been contributed to by high economic cost in the form of banking crisis and the manner in which this has led to until-two-thirds effects to be credit-related. The fact that this downfall follows one where the global economies were experiencing stress in the forms of inflation adjustment and post-2023 monetarist policy restraint makes the poor retail climate all the more dire. Latest Federal Reserve figures also indicate a change in focus from nonfinancial business credit to the consumer credit trend, again highlighting the retail and financial worlds’ focus on keeping an eye closely on these changes.
Decline in revolving credit also eats into optimism about a strong economic recovery. While some signs are pointing towards expansion, consumer confidence is still weak, and tightening up of credit conditions can prove to be a crimp for the retail sales and overall economic momentum. Trends in credit usage need to be watched very carefully by analysts because they provide very valuable insight into the well-being of consumer spending and the character of the overall recovery. What to watch for in analysts: Observe persistent trends in revolving credit to the consumer and the possible retail sales impact. A persistent downward trend in revolving credit may be more than just cautious consumer spending, impacting retail stocks too. Analysis of the credit-intensive industries’ financial health will also be important in judging the longer-term implications from the tightening credit environment.
Surge In Mortgage Rates And Housing Market Implications
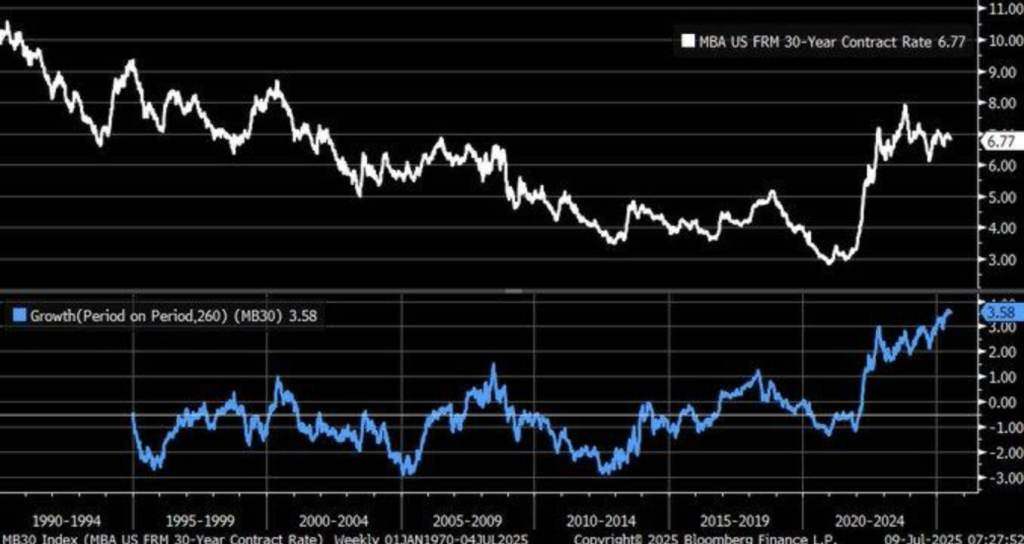
The all-time record 3.58 percentage-point rise in the 30-year MBA fixed-rate mortgage over the past five years, as tracked by Bloomberg Finance L.P., is the biggest in decades. The rise can be attributable in large part to the post-2020 shifts in the economy, namely chronic inflation and the Federal Reserve’s run of interest rate increases. Before, these kinds of dramatic accelerations in mortgage rates have commonly signaled economic overheat, a condition that can lead to a slowdown in the housing market as homes become prohibitively expensive. The rise is in contrast to the relatively flat pre-2020 rates, once again affirming the stranglehold that higher borrowing costs are exerting over homebuyers.
The increasing mortgage rates reflect the same pattern as the 2.75% home value appreciation by April 2025 projected by the U.S. Bank, reflecting even at higher borrowing costs, home values keep rising. The pattern, however, will not be the same if mortgage rates continue to increase, and this would lead to slower buying activity and eventually slow down the home market. The 2023 Federal Reserve report on mortgage rate volatility even prescribes the impact in the sense that with the steep spikes in most instances, the following period of correction in the market leads to affordability becoming the prime constraint on the future homebuyers. The 2025 Primary Mortgage Market Survey (PMMS) of Freddie Mac shows the recent surge in mortgage rates after five weeks of decline, characterized by the market sensitivity to employment data and rate expectations looking forward. The sensitivity acknowledges the potential that even in the current high-rate regime, shifts in the underlying economics—such as labor market metrics—will influence future direction in mortgage rates. The analysts would be wise to listen to such crossovers as they are destined to mirror the overall trend in the housing market as well as upcoming opportunities for investment in related space.
What to watch out for by the analysts: Analysts need to watch for directions of mortgage rates in the future and whether they can affect the affordability of houses. With the rates rising further, the decline of the housing market will pave the way for discovering undervalued stocks in the construction and properties segment. Keeping an eye on the Federal Reserve policy shifts and how this affects the interest rates will also be important in viewing the larger economy picture.
Reducation At Wholesale Level And Inventories
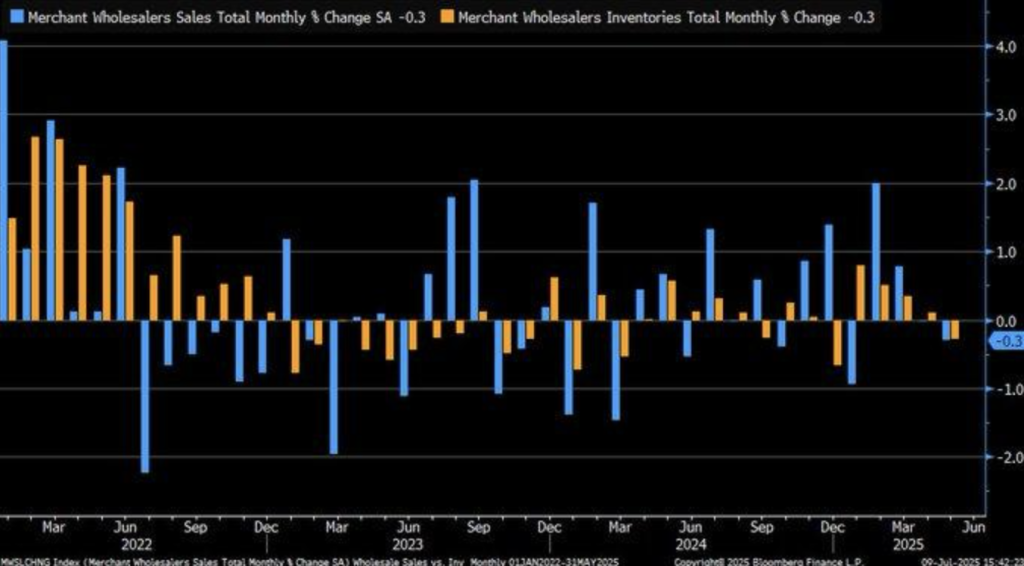
The latest 0.3% month-over-month decrease in U.S. wholesale sales and inventories in June 2025, as reported by Zaye Capital Markets, reflects the possible slowdown in the economy overall. This uncommon, same-month decrease, which began in March 2024, reflects the possibility of worsening conditions in the economy, with conflicting information in the prior months. The same-month decrease in sales and inventories, as reported by data from Haver Analytics, follows the period of volatility—wholesale sales and inventories fell by 0.3% in May 2025 following modest increases of 0.1% in April and following decreases of 0.3% after holding steady.
Sector-specific forces would seem to be at play in these trends, in the farm product group in specific, where farm product stocks declined by 3.8%. This would be part of some general inventory correction process where firms simply catch up to slowing demand or some disruption at the supply side. While the falling trends in both wholesale sales and stocks might simply be some general slowing down in the larger economy, one must be careful in attributing this to recent changes in U.S. policy shifts, for instance, the Trump-imposed tariffs. The New York Times points to possible pressures from the tariffs at the wholesale point, but no causal link between June’s figures and these policy initiatives has been established directly. The general macroeconomic environment is that the trends may be showing more and more obvious structural shifts within specific industries rather than some general deterioration. The experts must continue to watch over changes in the trends in sales and inventories in industries in order to be able to interpret better the implications for the growth of the economy. The future output and demand as a result of changes in inventories will be closely observed in order to determine the future direction the economy will follow.
Watch for: Pay attention to industry trends, especially in agriculture and other sectors where inventory changes are occurring. Also, pay attention to how altered trade policy, like the imposition of tariffs, could affect overall wholesale trends. Looking for undervalued stocks in the affected sectors may provide investment opportunities as the companies adjust to altered market conditions.
Distribution of Wealth and The “Great Wealth Transfer”
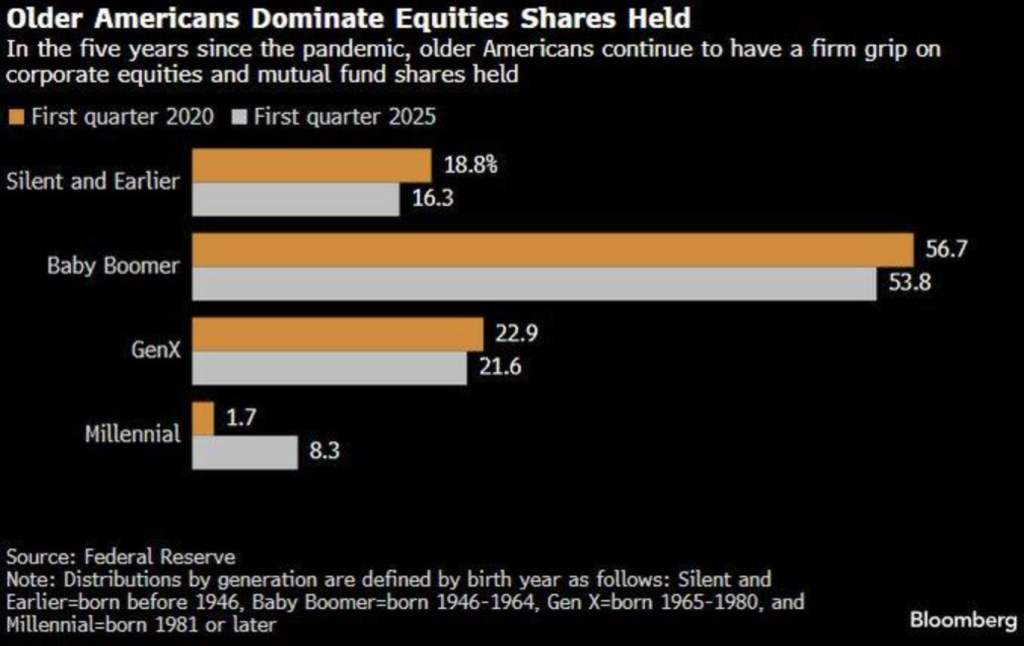
The newest Federal Reserve figures, says Zaye Capital Markets, show American boomers (pre-1965 births) continue to dominate 70% of business stocks and mutual fund shares, down modestly from 75% over the prior five years. Primarily in anticipation for the oft-vaunted “Great Wealth Transfer” to the next generation, the incremental quality of the transfer would seem to yield the expected redistribution, being overhyped. By 2024 study by Bloomberg, the millennial boom of inheritances would be overhyped simply by the boomer longevity and ongoing consumption patterns by the boomer generation, conditioning the flow at which wealth transfers.
In the meantime, millennials have put money into corporate equities and mutual fund shares from 1.7% to 8.3% over the past five years, more investing into marketplaces, perhaps from tech-bolstered portfolios. This aligns with the 2023 Merrill Lynch report estimating younger generations possessing $106 trillion in 2048 to inherit, if the liquidation of boomer assets is on the large side. All the same, these estimates rely on survival and boomer consumption patterns, potentially slowing down the handover. Increased investing by millennials is change but one at a slower pace than most Everyone anticipates. The wealth concentration by the boomers stems from the post-WWII policy during the Marshall Plan period and Keynesian economics, creating the conditions for wealth to accumulate. Structural changes, like the diminishing incomes of middle-income earners and soaring cost of living, from the 1970s onward, would, however, constrain the wealth-building capacity of the young generations to narrow the equity deficit. The notion of wealth equalization presents complexity and defies the anticipation of the near-term financial turning point. The analysts would be keen to track the general conditions within the economy to either energize the wealth transition or restrain the same, including those policy interventions impacting the wealth building by the elderly and the young generations.
What to look for from analysts: Look out for evidence of brisk asset liquidation by the boomers because this would affect the speed at which wealth is passed to the next generation. Consider the general macroeconomic landscape and policy impacting millennials’ capacity to acquire assets. The stocks in which millennials’ investment is rising, and specifically in the technology space, could offer opportunities.
Upcoming Economic Events:
GDP m/m
As the week begins when economic expectations are going to be set, the key number to look at will be the latest GDP m/m data, a leading indicator of economic health. Because investors want to know about the momentum of growth, the reading should have a significant impact on investor sentiment as well as Federal Reserve policy announcements. The following are the anticipated result as well as the likely marketplace responses as a variable of the GDP print versus expectations:
GDP m/m
- If the current GDP m/m beats the expectation, that would equate to aconfirmation that the economy is gaining a healthier pace than anticipated. That will b a good risk asset, i.e., stocks, signal since investors will view the numbers as a display of economic health. Stocks will find their footing again, i.e., cyclical stocks which are goaded a lot through growth. Also, the U.S. dollar will establish a base through the improved economic prospects, and bond yields will increase, as investors digest the possibility of the Federal Reserve to become bolder in the future with actions on rates. On balance, the GDP growth beat will likely propel investor sentiment upward, taking the markets higher.
- Below Expectation Or a sub-forecast GDP m/m reading would indicate the economy is weaker than expected. That would put the health of the recovery into question and put risk assets on the back foot. Stocks could decline, especially cyclical economic-related stocks, as the numbers would be perceived as a slowdown in growth or cooling of the economy. Risk appetite would decline, with the U.S. dollar softening, while bonds decline as investors flock to the safe haven of the asset class. Then the Federal Reserve could put pressure to go dovish, keeping the rates low for a longer stretch to encourage growth, which would certainly provide a relief to a certain extent, but perhaps not enough to counter the alarm at the direction of the economy.
What to Watch Out For: Analysts will have to closely monitor the GDP m/m reading as it will provide best insight here on the speed of the economy. A positive surprise reading would be a sign of a strong economic recovery, supporting cyclical share investments, and could press the Fed towards a more aggressive policy stance. A disappointing reading, however, could indicate the economy stays weak, and therefore the growth prospects are at risk, driving risk-off sentiment from the markets. Watch closely how these developments play out, especially concerning interest rate expectations and sector-level effects.
Stock Market Performance
Markets Stage Comeback From Lows, But Systemic Risk Persists
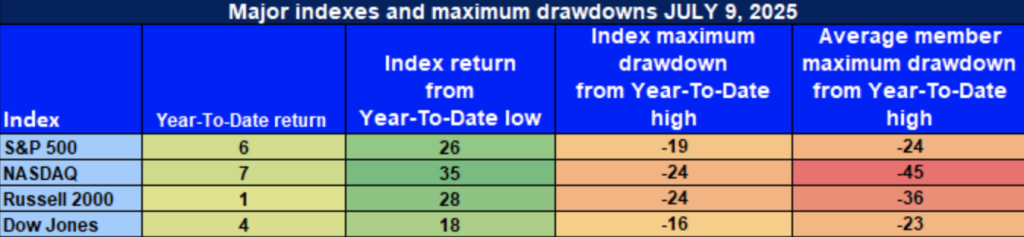
US equities recouped in July from April lows’ momentum. But total retracements from the neighborhood highs and lackluster average member contributions to the contrary attest to the inherent weakness. Let’s examine how the major indexes performed:
S&P 500: Spirited Rally, But Participation Is Limited
S&P 500: +6% YTD | +26% 4/8/25 low | -19% to YTD high | Ave. member: -24
The S&P 500 has come back strongly, +26% higher from the April low, pushing the YTD advance to +6%. While the Index has come back, the -19% letdown back down from the YTD high for the index and -24% mean member drop are not reflective of a weak correction period so much as sector-level weakness, with intense softness hidden under the surface and poor participation throughout the sector universe.
NASDAQ: Strongest Bounce, But Harshest Internal Pain
NASDAQ: +7% YTD | +35% from 4/8/25 low | -24% below YTD high | Avg. member: -45%
It leads the leaders group, which had a +35% rebound back up off the April low and a +7% YTD percentage increase. That despite the -24% decline back down off the YTD high and the median member decline of -45% showing extensive internal damage, which has hit the members that were growth-oriented, which had suffered the most during the current rush, disproportionately hard. Relative strength conceals extensive internal weakness among index constituents.
Russell 2000: Small-Caps Struggle to Regain Traction
Russell 2000: +1% YTD | +28% off 4/8/25 low | -24% from YTD high | Avg. member: -36%
Small-caps have yet to gain traction, with the Russell 2000 gaining a mere +1% YTD. As robust as it has recovered a +28% off the April lows, the index continues to languish, down a -24% relative to the YTD peak and a median member decline of -36%. General lack of resiliency among the small-cap issues continues to reflect investor anxiety and general sensitivity to the marketplace.
Dow Jones: Relative Stability Amidst Market Volatility
Dow Jones: +4% YTD | +18% since 4/8/25 base | -16% YTD peak | Average member: -23 The Dow continues as the indexes’ strongest, rising +4% YTD and +18% back retracing the April lows. While such relative calm exists, the -16% correction back from YTD peak and the -23% average member decline indicate the reality that it, as well, resists the stronger currents of the marketplace. The Dow continues to have a history of resiliency yet continues to have the pressures as a member of a volatile marketplace setting.
What the Analysts Should Be Careful About: Despite the rebound seen in these indexes, the lack of breadth movement and internal weakness within some of the key constituents does produce a cause for concern. Decoupling of index performance in general versus the stock performance, particularly relating to the inflation, interest rate, and world risk sensitivity, will be a space that analysts will need to monitor. By doing this, they might identify the under-valued opportunities as well as the sustainability of the rebound.
The Strongest Sector in All These Indices
Industrials Pave the Way to 2025
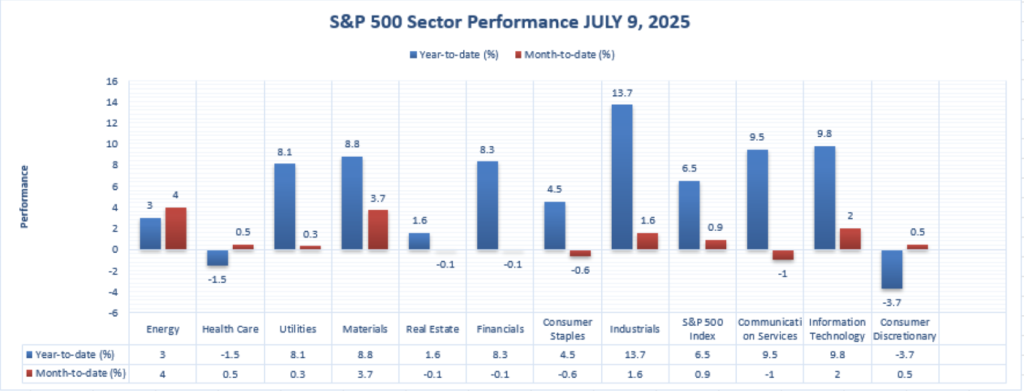
As the year 2025 industries all registered diverse performances, the Industrials sector proved the absolute champion of all the S&P 500 industries during the year. Due to lots of support from manufacturing, infrastructure, as well as logistics, the Industrials have been robust and have been reliable, defeating a streak of their counterparts.
Industrials: +13.7% YTD | +1.6% MTD
The Industrials are the leaders, with a leader +13.7% year-to-date rise, a record among the eleven major S&P categories, as well as a rise during the past month of July with a +1.6% month-to-date gain. That’s all thanks to strong earnings, a series of new orders, and ongoing optimism about cyclical segments to benefit from broad economic expansion. Industrial stocks, namely manufacturing, infrastructure, are highly sought after as global supply chains are recovering as well as new programs continue to go on-line.
Even though the other sectors such as Communication Services (+9.5% YTD) and Information Technology (+9.8% YTD) also have sound gains, they have not been nearly as strong relatively as well as reliably as Industrials. On the negative side, sectors such as Consumer Discretionary (-3.7% YTD) and Health Care (-1.5% YTD) have been losing ground, but another reason Industrials have been a sector leader so far in sector rotation year.
What to Watch For Analysts should continue to watch the strength in Industrials sector, particularly in industries such as manufacturing, logistics, and infrastructure, as these industries are going to be positively impacted by economic reopenings as well as government infrastructure spending. As the sector has been the market leaders thus far for the current year, it does have potential to investors who are looking for stabilty as well as growth through cycles. Further, watching the other sectors’ performance relative to Industrials will also help in observing trends as well as rotations of the overall marketplace.
Earnings
Summary of Earnings: July 10, 2025
- Delta Air Lines, Inc. (DAL)
Delta’s robust quarterly results reported an operating revenue of $16.6 billion as demand for travel increased. Irrespective of downturns in the overall economic climate, Delta posted an earnings per share (EPS) of $3.27, which was ahead of expectations. The airline stayed true to full-year EPS projections, a testament to gradual growth in spite of world uncertainty. That was summarized in astute operational management as well as a healthy turnaround of consumer travel patterns. Whether or not the business will maintain such expansion figures in spite of economic uncertainty is, however, still a key area of concern in the future.
- Conagra Brands, Inc.
The Conagra earnings were lower than the analysts’ expectations as the 13.9% drop was in the adjusted EPS, which declined to $2.30. Revenue was affected by increasing inflation, supply chain, as well as the foreign exchange issues. Firm-offered fiscal 2026 targets revealed lower growth, as theEPS targets were lower compared to analysts’ targets. From the consumer staples-oriented focus and supply chain pressures, the resistance of the company to the pressures, with a bigger caution-killing consumer spending outlook, left a question.
- Levi Strauss & Co. (LEVI)
Levi Strauss surpassed estimates with a robust quarter as the firm announced $0.22EPS as well as revenue of $1.45 billion. Levi boosted the complete year revenue growth as well as the adjustedEPS guide as European markets registered robust performances while denim demand remained robust. Levi, despite the challenges imposed by the international economy, is set for long-term success through the management’s strengths of keeping inventories lean and continuing delivering growth through the major international segments. Innovation and premium, which the management has been concentrating on, are also defying the general pressures of the market.
- The Simply Good Foods Company (SMPL)
Simply Good Foods put up a good Q3, delivering 14% revenue growth to $381 million and $0.51 adjusted earnings per share. Sales were boosted for the company by the good sales in the Quest brand and the successful acquisition of OWYN. In contrast to the trouble that the overall food industry is going through, the company has demonstrated resilience through effective brand expansion. Simply Good Foods investors will thus observe the way the company executes the integration of new acquisitions and the evolving nature of the competitive environment in the food industry.
- PriceSmart, Inc.
PriceSmart revealed Q3 net earnings of $35.2 million, or, per share, $1.14, and revenue of $1.32 billion. Despite the current currency headwinds, the company recorded a 7% same-store sales increase. Planned expansion revealed by the management to venture into Chile are a reflection of the potential for growth of the company, representing a healthy marketplace strategy of diversified footprints. PriceSmart’s ability to traverse the international landscape despite the current negative circumstances reveals the flexible business model that it has.
- WD-40 Company
WD-40 revealed Q3 EPS of $1.43, which exceeded expectations, while revenue narrowly missed the mark. WD-40 raised full-yearEPS guidance, reflecting optimism about the success of itscost control program and premiumization strategy. WD-40’s ongoing emphasis on broadening the depth of the offerings and sustaining lean operations has made the company a consistent performer despite a highly competitive sector. Investors are eagerly waiting to see the extent to which the company can maintain such activity through the balance of the year, namely as economic pressures continue globally.
Earnings Preview: Wednesday, 11 Jul 2025
- Unity Bancorp, Inc. (UN) Q2 2025
Unity Bancorp earnings are likely to arrive with an estimated earnings per share of $1.17 and revenue of $30.3 million, a 13.5% year-to-year increase. Bank loan expansion, net interest margin, and asset quality are going to spark particular investor interest, particularly given the current pressures in the interest rate environment.
Whether Unity will effectively navigate the higher rate environment through balance sheet management, and the direction of the non-interest revenue and loan origination metrics, are going to have an impact on investor sentiment. Investors must keep an eye for such earnings reports for revealing details regarding the performances of these companies as well as how the overall trends are expected to affect their future strategies.
Stock Review – Friday, 11th July 2025
Stocks are up in the U.S., with the major indexes marking new record closing highs. The S&P 500 finished at 6,280.46, a record closing high for the index. It’s driven by robust corporate earnings, led by the tech sector, and a healthy economy. Better policy expectations by the Federal Reserve, ongoing, are continuing to drive the market higher as well. Geopolitical issues, such as recent negotiations about tariffs, however, are a source of concern and could impart volatility to the marketplace.
Stock Prices
Economic Factors and Geopolitical Developments
This market rally keeps getting a lift with solid corporate earnings reports and solid economic history. Investors are watching the next steps of the Federal Reserve closely, as a flicker of policy easing keeps the rally going. But geopolitical events, including the latest news regarding tariffs, are a risk item, and these will add volatility to the marketplace.
The Seven Wonders and the S&P 500 Index
The “Magnificent Seven” tech leaders—Nvidia, Microsoft, Tesla, Apple, Alphabet, Amazon, and Meta—have been behind the recent rise of the S&P 500. These shares have ridden the wave of innovation in artificial intelligence and cloud computing to post strong earnings and investor demand. Their large index weightage ensures that their performance still plays a big role in determining the direction of the S&P 500. While they have dominated the scene, these shares have come under some pressure lately as the market rethinks valuations and investor sentiment.
Legendary Dip of April 2025
Top Stock Performances April 2025 was mythical bottoming time for many stocks, with stunning comebacks that caught the attention of many investors. Some of them are:
- $HOOD: +189%
- $ONDS: +181%
- $OKLO: +174%
- $ENVX: +159%
- $COIN: +157%
- $RKLB: +139%
- $NBIS: +132%
- $IONQ: +122%
- $SOFI: +121%
- $ASTS: +117%
- $HIMS: +98%
- $AVGO: +88%
- $AMD: +84%
- $PLTR: +83%
- $NVDA: +70%
These stocks had significantly recovered from their earlier lows, and investors were interested in them for their comeback potential. Stocks like $HOOD and $ONDS achieved humongous returns, which showed even in a volatile marketplace, the select list of stocks could give incredible performances. Success of these stocks highlights the overall marketplace trend towards the revival of the growth sector, which includes the tech and digital financial sector.
Major Index Performance to Jul 11, 2025
- S&P 500: Closed at 6,280.46, 0.27% higher for the day
- Nasdaq Composite: Closed at 20,630.67, up 0.09%, a new all
- Dow Jones Industrial Average: Increased 0.43% to close at 44,650.64
- Russell 2000: Closed at 2,092.10, a slim gain, but fell 5.7% year-to-day
Over the coming months, market participants are looking to forward-looking economic statistics and company profits for further insight into the health of the economy and the probable policy reaction. Spillover between macroeconomic news and geopolitical developments will remain a gauge of near-term market activity.
Price of Gold – Friday, 11th Jul, 2025
According to the recent data, the current prices of gold are around $3,331.81 per ounce, increasing 0.23% when compared to the previous day. As long as the prices remain lower than the recent peak, the trend seems to stabilize. Gold prices have been lifted by increasing uncertainty within the marketplace brought about by geopolitical activity as well as economic anxiety. President Trump’s recent announcement of tariffs, like a 50% tariff for copper and a 200% threat of a tariff for pharma, lifted the level of anxiety within the traded marketplace. Alongside the expectation of the U.S. dollar increasing to the higher weekly closing since February, investor sentiment shifted towards the safe-haven marketplace of gold, though the strong dollar capped the rise.
During the coming days, the course of gold will be guided by the release this week of GDP m/m figures. If GDP figures outperform forecasts, market sentiment may lift the U.S. dollar at the cost of gold prices declining. If the figures are soft, fears of economic growth may be expressed in a rise in the demand for gold as a hedge, leading to prices rising. With the market tone currently riding on economic fundamentals and also geopolitical tensions, gold’s behavior is likely to be so sensitive to these shifting dynamics in the coming days.
Oil Prices – Friday, July 11, 2025
West Texas Intermediate (WTI) and Brent crude are presently at about $66.89 per barrel and $68.88 per barrel, respectively. The prices have made a slight recovery after declining by 2% yesterday. Volatility in the recent times in oil prices has been attributed to economic policy announcements, supply and demand, and geopolitical tensions. President Trump’s recent announcements of tariffs, such as a 35% tariff on imports from Canada and possible blanket tariffs on the remaining U.S. major trade partners, have planted seeds of fear over the expansion of the global economy, and the prices of oil have been volatile accordingly.
For the near term, the upcoming release of GDP numbers will dictate oil prices. Bigger-than-anticipated GDP readings can support optimism about the U.S. economy, which can support the dollar, hence exerting a bearish influence on oil prices. A less-than-anticipated GDP reading can assert fears about economic growth and therefore prompt investors to rush to oil as a safe haven, hence pushing the prices upward. Interplays of economic releases against volatility of geopolitical risk will continue to direct oil direction for the near term.
Bitcoin Prices – Friday, 11th July 2025
At the most current statistics, Bitcoin (BTC) is at a price of $116,529.00 USD and has risen by a 4.88% increase from the previous close. Intraday highs reached $116,687.00 USD, while intraday lows touched $110,761.00 USD. This increase brings Bitcoin’s year-to-date performance to around 24%, an indication of a strong bullishness in the marketplace.
The impromptu hike in the price of Bitcoin is due to a variety of factors. The Trump government has been more crypto-friendly and has even taken it to a level of creating a Strategic Bitcoin Reserve. That has created a seal of approval and faith among investors, especially institutional investors. Fidelity and ARK Invest are some of the larger financial houses that have also witnessed tremendous inflow into Bitcoin, which shows increased institutional purchases. Additionally, the 2025 halving of Bitcoin will cut down supply units, which could contribute to spiking prices.
In the future, the subsequent GDP data announcement will be significant in shaping the direction of Bitcoin. A positive GDP report better than expected will aim to reinforce confidence in the U.S. economy, with the potential to reinforce the dollar and put downward pressure on Bitcoin prices. Conversely, a lower-than-expected GDP reading might enhance worries about economic growth, and investor demand for Bitcoin as a hedging instrument might push prices upward. The interplay between economic announcements and regulatory news will continue to be significant in shaping Bitcoin performance in the near term.
ETH prices – Friday, 11th July 2025
Ethereum (ETH) currently exchanges at $2,969.96 USD, 6.93% higher than the last closing. Intrinsically, the intraday peak was at $2,981.44 USD, and the bottom reached was $2,767.25. Recent trends show heightened institutional demand for Ethereum. In the first week of July 2025, Ethereum exchange funds (ETFs) have witnessed high inflows with 93,427 ETH deposited over the course of seven days. ETF investments witnessing a wide-based rise show that institutional investors are more confident about the long-term potential of Ethereum.
Also, heavy whale activity has been witnessed. A prominent Ethereum whale wallet transferred 6,989 ETH from Binance across a three-week timescale, which indicates an increasing trend of accumulation. Such a transaction invariably signals bullish indicators, as the big players position themselves for likely price spikes. In the future, the direction of prices of Ethereum will largely be influenced by continuous institutional accumulation and whale activity. ETH might hit the target of $3,000 in the near future, assuming trends remain the same. External economic influences and volatility might, however, be the decider of the prediction.
