Where Are Markets Today?
U.S. and European equity futures have gained some ground on Thursday morning, with investors digesting the latest round of big-name earnings results and attempting to adjust their portfolios after the significant software sector sell-off during the previous two trading sessions. U.S. stock index futures have risen moderately, with the S&P 500 futures increasing by 0.29%, the Nasdaq futures advancing by 0.45%, and the Dow futures trading sideways. European stock market futures also displayed positive sentiment, with DAX and CAC 40 gaining ground due to the strong overnight gains of U.S. chipmakers.
The gains in the U.S. and European stock market futures can be attributed to the positive sentiment generated by the AI infrastructure spending, particularly after the latest earnings results by Alphabet, which revealed the possibility of up to $185 billion of capital expenditures for 2026, focused on artificial intelligence and cloud infrastructure. Although the shares of the search engine giant fell by close to 1%, the positive outlook for future spending has generated optimism for the sector. Other companies, including Nvidia and Broadcom, have gained after the latest earnings results, particularly after the massive spending plan was revealed by the search engine giant. This has generated optimism for the sector, with companies related to AI manufacturing and data infrastructure also gaining ground.
However, the 9% drop in the shares of Qualcomm after the latest earnings results due to weak forecasts because of memory shortages acted as a reality check for investors.
Rotation continues to be an overarching theme with investors moving out of overvalued tech and software names and into cheaper industrials, energy, and diversified financials. The spread between the S&P 500 and equal-weighted indexes, combined with the 260-point pop in the Dow yesterday, is an obvious sign that investors are seeking participation beyond tech. European markets seem to be following this rotation theme, especially with recent ECB comments indicating an extended period of pause in rate hikes due to mixed inflation data. Consequently, market breadth has improved slightly with an early bid in futures as earnings and economic data fight for market share. On Thursday, market participants are looking ahead to several key data points that will drive market sentiment. These include Amazon earnings out after the close, Peloton and Tapestry earnings out pre-market, and U.S. weekly jobless claims. These are the three legs that must hold for an equity market recovery. At Zaye Capital Markets, we believe that the performance of futures in the near-term will be dictated by these data points and the strength of the narrative that emerged yesterday with the tech sector’s recovery. If Amazon beats and the jobs data are solid, we could be looking at confirmation that the tech sell-off in early February was simply a technical move. However, with volatility remaining high and geopolitical tensions simmering in the background, we must remain data-driven.
Major Index Performance as of Thursday, 5 Feb 2026
- S&P 500: The S&P 500 is trading at 6,882.72, down 0.5%, as the overall decline of the mega-cap technology sector outweighs the gains from the energy and defensives sectors.
- Nasdaq Composite: The Nasdaq Composite is trading at 22,904.58, down 1.5%, as the overall decline from the semiconductors and speculative technology sectors outweighs the gains from the overall market.
- Dow Jones Industrial Average: The Dow Jones Industrial Average is trading at 49,501.30, up 0.2%, as the overall gains from the industrials and value sectors outweigh the declines from the technology sector.
- Russell 2000: The Russell 2000 is trading at 2,624.55, down 0.4%, as the overall pressure on the growth-sensitive small-cap sector outweighs the gains from the overall market.
The Magnificent Seven and the S&P 500
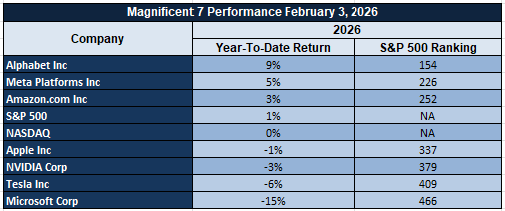
However, the “Magnificent Seven,” consisting of Alphabet, Amazon, Apple, Meta, Microsoft, Nvidia, and Tesla, have cumulatively declined by more than 18% from their recent highs, with significant declines from the shares of Meta and Tesla. The valuation compression, sensitivity to earnings, and slowing forward guidance for these companies have diminished their overall impact on the movement of the broader indexes. Nonetheless, these companies continue to remain a significant weight on the S&P 500 and the Nasdaq, and their underperformance will continue to be a headwind for these indexes unless a significant sectoral broadening occurs.
Drivers Behind the Market Move – Thursday, February 5, 2026
As the U.S. and European markets continue to process new earnings reports, political commentary, and international diplomatic developments, investors are adjusting their risk appetite in response to a plethora of new political and economic news. There are three major drivers currently impacting market sentiment and determining the future trajectory of the markets in the U.S. and Europe today:
1. Rate Cut Signals and Labor Market Anticipation
Market sentiment is currently being supported by President Trump’s renewed claim that “there is not much doubt that rates will be lowered.” This statement is particularly important as investors are awaiting new U.S. unemployment claims and JOLTS job openings data. As the labor market appears to be slowing down, investors are hedging their bets regarding the potential rate cut cycle and the implications this will have on the market.
2. U.S.-China Diplomatic Thaw and Agricultural Trade Boost
The latest phone call between President Trump and Chinese President Xi has brought about optimism to the global markets. This is because there are promises to increase the procurement of soya beans up to 20 million metric tons. This has helped European and US stocks regain ground after the initial sell-off. This is especially true as these developments are viewed as a relaxation of earlier tensions between the two countries. These tensions had negatively impacted global growth rates and cross-border trade.
3. Earnings Reactions and Sector Rotation Pressure
In the current scenario, the earnings season continues to produce mixed signals. Alphabet’s AI-based capital expenditure guidance has boosted hopes for chipmakers like Nvidia and Broadcom. At the same time, the same has hurt software stocks. Meanwhile, Qualcomm’s disappointing forecast has raised concerns about inventory-related issues. This has led to sector rotation pressure. This has brought about a fragmented picture for the futures market. This is especially true as major stocks are expected to rise while sectoral divergences are significant.
In summary, the current market sentiment is driven by factors such as dovish rate expectations, trade cooperation between two global powers, and volatile earnings reactions. Major economic data is expected to be released shortly.
Digesting Economic Data
The TRUMP Tweets and Their Implications
This week, President Trump’s activities, statements, and engagements have sent clear signals across all economic, diplomatic, and political domains. In particular, his high-level phone call with Chinese President Xi Jinping, focusing on alleviating tensions between their nations, was a deliberate attempt to stabilize the situation. In addition, the news that China is planning to increase its soybean imports by 20 million metric tons was immediately reflected in markets, especially soybean futures. From a macroeconomic perspective, Trump’s attempts to improve trade channels are a continuation of his attempts to recalibrate global supply chains, providing temporary relief to markets that are impacted by his trade policies. In other areas, Trump’s televised address, in which he said there is “not much doubt” that interest rates will be lowered, added another layer of weight to an already heavily debated monetary policy. In particular, markets interpreted Trump’s statement as a nudge towards a more accommodative interest rate policy, a move that, if implemented by the Fed, will provide tailwinds to markets. From a fixed-income perspective, Trump’s statement was a continuation of a narrative that is building up a sense of expectation that interest rates will soon be lowered, especially given recent economic data. However, from an equity perspective, markets are still divided, as a reduction in interest rates is expected to boost growth stocks, but there is still no clear sense of demand.
Domestically, the political environment has taken a more defined stance. Human Rights Watch issued a scathing attack against the Trump administration for undermining democratic institutions. This was followed by an aggressive counter-attack by the White House against the Human Rights Watch. While this is not immediately impactful for markets, this could be an indication of more volatility as the 2026 political cycle continues to evolve. Meanwhile, the administration appears to be active in optics and processes, including releasing videos of Vice Presidential speeches and statements about nominations, as well as the installation of a Columbus statue near the White House.
What this means for markets is that the overall policy approach by the Trump administration appears to be anchored by stabilization policies abroad and an aggressive approach to optics and communications domestically. With commodity markets reacting to the statements about China, rate-sensitive markets awaiting further action on dovish statements, and political markets pricing in mild turbulence, this is a highly sensitive environment for investors. At Zaye Capital Markets, we believe geopolitical clarity and rate signals will continue to be significant drivers for asset repricing in the short term for equities, commodities, and currencies.
Services Activity Holds Firm as Demand and Hiring Momentum Soften
Service sector activity in January 2026 continued firmly in expansion territory, reinforcing the view that the single biggest contributor to overall economic output is still providing stability and not drag. The data showed no change from the previous period, with the figure being boosted by a sharp increase in business activity, indicating that the service sector is still delivering on the existing order and operational flow. This is an important factor to note, as it suggests that the economy is still being driven by the fulfillment of existing demand and not the generation of new demand. The service sector, which is the dominant contributor to overall economic output, therefore appears to be stabilizing and not accelerating, indicating a move towards normalization.
However, if we scratch beneath the surface, we can see that the data is indicating a move towards caution, with new orders falling significantly and employment rising just shy of neutral territory. This is indicating that the service sector is becoming increasingly cautious with regards to future orders and is rebalancing the economy towards a period of optimization and cost-cutting. Whilst the overall data is indicating a healthy performance from the service sector, the fall in the rate of hiring Is indicating that the sector is becoming increasingly efficient and is working to reduce the cost of operation. Historically, this type of data configuration is indicating a move towards moderate and positive growth outcomes, and not contraction. Therefore, we believe that the stock is undervalued based on its position within the service-driven economy that is still functioning at scale and is therefore benefiting from the active nature of the services sector. As such, the company is still benefiting from the resilience in the services sector and the ongoing nature of the transactions market, even if the rate of hiring is slowing and new orders are falling. As such, we believe that analysts need to be monitoring the trends in discretionary service sector spend and the consistency of the transaction growth and the stability of the operating margins in order to determine whether the resilience in the service sector is still benefiting the company.
Private Hiring Slows Sharply as Wage Pressure Limits Expansion
Job growth in the private sector in January 2026 was less than what was expected, with the pace of hiring the weakest in over a year, indicating that the labor market’s resilience may finally be fading. Even though the pace of hiring was still positive, the data suggest that the private sector may be becoming less aggressive in hiring new workers, especially as the economy transitions from the recovery phase to the growth phase of the cycle. In terms of the economy, this indicates decelerating growth, but it does mean that the economy has less room to maneuver if the pace of growth slows down further.
A more detailed review of the sectors’ performance reveals a clear divergence from the overall employment figure. Education and health-related services continue to create jobs at a healthy rate, and financial services also recorded a positive employment figure, suggesting a stable defense and service sector. This is in contrast with the performance recorded by the professional services and manufacturing sectors, where jobs were cut. This situation increases the incentive for firms to delay hiring and focus on productivity rather than workforce expansion.
With the above scenario, the UnitedHealth Group appears undervalued compared with the firm’s exposure to the areas of the economy with a demonstrated employment growth rate. The fact that the healthcare-related service industry is a growing industry provides the firm with a positive employment environment rather than a cyclical employment environment. The firm’s size and pricing flexibility will enable it to manage the ongoing wage pressure more effectively than a labor-intensive industry with declining employment opportunities. Analysts should focus on employment trends for healthcare-related services, margin stability with ongoing wage growth, and cost management initiatives, as these will be the key areas for determining the firm’s earnings durability with the ongoing slowdown in the employment rate.
Gold Supply Skewed Toward Jewelry as Investment Liquidity Stays Constrained
Recent data on above-ground gold supply highlights a structural reality that is often overlooked during price surges. A large share of global gold holdings remains locked in jewelry form, underscoring gold’s long-standing role as a cultural and wealth-preservation asset rather than a purely financial instrument. This matters because jewelry-held gold is typically price insensitive in the short term, meaning it does not readily flow back into markets even when prices rise. As a result, headline price strength can occur alongside tight effective supply, reinforcing gold’s ability to hold value during periods of economic uncertainty.
By contrast, only a relatively small portion of global gold stocks exists in readily investable forms such as bars, coins, and exchange-backed vehicles, while official sector holdings represent another meaningful but largely immobile share. This concentration limits liquidity precisely at times when demand for financial protection increases. Over the past year, total gold demand reached record levels, driven by sustained official-sector accumulation and heightened uncertainty across global growth and monetary conditions. The Imbalance between strong demand and constrained investment-grade supply helps explain why price pullbacks have remained shallow despite volatility in other asset classes.
Given this backdrop, we find Barrick Gold to be undervalued relative to its leverage to structurally tight gold markets. As one of the largest and lowest-cost producers, the company stands to benefit from elevated prices without relying on speculative investment flows. Its diversified asset base and disciplined capital allocation position it well in an environment where supply constraints, rather than demand surges, underpin gold’s strength. Analysts should monitor production costs, reserve replacement trends, and official-sector buying patterns, as these will be critical in assessing the sustainability of gold’s support and the earnings outlook for major producers.
Retail Sales Momentum Holds Firm Despite Macro Cost Pressures
Weekly same-store sales data continues to signal healthy consumer activity, with year-over-year growth remaining firmly positive into early February 2026. The latest reading shows that discretionary retail spending is still expanding at a solid pace, suggesting households are maintaining consumption levels despite elevated prices and tighter financial conditions. As a high-frequency indicator, this data reinforces the view that consumer demand has not rolled over and continues to provide near-term support to overall economic activity, particularly within large retail chains and mass-market segments.
That said, the strength in sales growth needs to be interpreted in context. Part of the resilience reflects price effects rather than purely volume-driven demand, meaning inflation dynamics still play a role in headline performance. At the same time, borrowing costs and household budget pressures remain a key variable that could influence spending behavior as the year progresses. This creates a mixed but constructive setup, where consumption remains a stabilizing force, yet sensitivity to shifts in financing conditions and price levels is rising. For analysts, this phase typically favors retailers with pricing power, efficient inventory management, and exposure to everyday discretionary categories rather than big-ticket items.
Against this backdrop, we find Walmart to be undervalued given its alignment with steady consumer spending trends and its ability to capture demand across both essential and discretionary purchases. The company’s scale, pricing strategy, and diversified revenue streams position it well to sustain traffic and margins even if consumer behavior becomes more selective. Analysts should closely watch same-store sales momentum, changes in basket size versus pricing, and margin performance, as these will be critical in determining whether consumer resilience can translate into durable earnings growth through the coming quarters.
Leverage Crowds Into Tech Raise Rotation and Volatility Risks
Data on leveraged sector funds shows a clear structural bias toward technology, with a dominant share of long-leveraged product launches concentrated in this single sector. The preference reflects technology’s deep liquidity, consistent trading volumes, and higher price variability, all of which make it attractive for leverage-driven strategies. Over time, this has resulted in technology accounting for a disproportionate share of sector-specific leveraged exposure, reinforcing its role as the primary vehicle for amplified growth bets rather than broad-based sector participation.
However, this concentration also introduces a fragility that markets often underestimate. When leverage clusters around one sector, rotations tend to be sharper and more disorderly once leadership changes. If capital begins to shift away from growth-oriented positioning toward value or defensiveness, technology-heavy leveraged exposure can unwind quickly, amplifying volatility across both equity prices and derivatives-linked products. For analysts, the key takeaway is not that technology fundamentals are weakening, but that positioning risk has increased, raising the probability of exaggerated price swings during periods of reallocation.
Within this setup, we find Cisco Systems to be undervalued relative to the broader technology complex. Unlike higher-multiple growth names that dominate leveraged exposure, the company offers stable cash generation, recurring enterprise demand, and lower sensitivity to speculative rotation. This positions it as a defensive technology beneficiary if leverage-driven capital rotates out of higher-risk growth pockets. Analysts should monitor fund flow data within sector leverage products, relative performance between growth and value technology, and volatility spikes during rotation periods to assess whether concentration risks are beginning to unwind.
Credit Conditions Diverge as Small Firms Face Growing Lending Pressure
The latest senior lending survey data points to a subtle but important shift in credit conditions, with banks reporting modest tightening in commercial lending standards overall. While lending conditions for larger firms continue to show relative flexibility, smaller businesses are increasingly facing stricter requirements. This divergence suggests that credit availability is no longer moving uniformly across the economy, as lenders become more selective amid a less supportive growth outlook, rising risk sensitivity, and heightened regulatory constraints. Historically, such inflection points in lending standards tend to act as early signals of slower investment momentum rather than immediate contraction.
Beneath the headline, the split between large and small firms is becoming more pronounced. Demand for credit from larger companies has strengthened modestly, reflecting balance sheet resilience and continued access to capital markets. In contrast, demand from smaller firms remains flat, reinforcing the idea that higher borrowing costs and tighter standards are weighing more heavily on this segment. Over time, this imbalance can limit small business expansion, hiring, and capital spending, increasing the risk that economic growth becomes increasingly concentrated among larger, well-capitalized players.
Against this backdrop, we find JPMorgan Chase to be undervalued relative to its position within tightening credit cycles. The company’s scale, diversified lending base, and strong capital position allow it to navigate selective tightening while continuing to serve higher-quality borrowers. Analysts should monitor changes in commercial loan growth, credit quality metrics, and small-business lending trends, as these indicators will help determine whether tightening remains contained or begins to exert broader pressure on economic activity.
Upcoming Economic Events
BOE Monetary Policy Report, ECB Main Rate Decision, U.S. Jobless Claims, JOLTS Job Openings, ECB Press Conference, BOE Gov Bailey Speaks
As the world of global investors gets set to face a series of major economic events, the next few days promise to be a time of simultaneous communications from the European and American sides of the Atlantic, which in turn are expected to set the course for the future of monetary policy, foreign exchange markets, and risk assets in general. In the next few days, the world of monetary policy is likely to change course dramatically, with important implications for investors seeking to buy undervalued equities at attractive entry points. Below, you can see a breakdown of each of the major economic releases that are expected to set the course in the next few days, together with an estimate of how markets are likely to react to surprises on either side of the consensus forecast.
Bank of England: Policy Report, Rate Vote, Governor’s Remarks
The Bank of England is set to announce its Monetary Policy Report, its decision on the official bank rate, as well as a breakdown of the MPC voting results. Although the market consensus is that the Bank of England is likely to hold its official bank rate unchanged, the focus of the market is not on the level of the official bank rate per se, but on its tone. If the voting results show a majority in favor of raising the bank rate, or the Monetary Policy Report highlights the threat of inflation, the pound could soar to new heights as the market reprices its rate cut expectations. Yields are likely to rise in tandem with the pound, putting pressure on domestic equities, especially in the real estate space and utilities.
- However, in the event of a dovish voting outcome or a dovish tone in the Monetary Policy Report, the pound is likely to weaken significantly, with government bond yields catching a strong bid in the process.
- Governor Bailey’s speech is likely to set the tone in this regard, with a focus on wage growth or core inflation likely to result in a hawkish tone to the Bank of England’s policy statement, while a focus on low demand or external pressures likely to result in a dovish tone to its policy statement.
European Central Bank: Rate Path, Liquidity Outlook, and Market Interpretation
The Main Refinancing Rate of the ECB is due for no change, but this is not about policy decisions; it is about forward guidance and credibility. The latest inflation data for core services and energy prices have created uncertainty for the ECB’s narrative.
- If the policy decision continues to reflect the strong stance against inflation and Lagarde continues to emphasize data dependency with a hawkish slant during the press conference, then the Euro could appreciate across the board, particularly against those currencies whose easing cycles have already been factored in. This could also have the effect of raising bond yields for the Eurozone periphery.
- If the ECB starts to reflect growing concern about the slowdown in growth or starts to talk about the balance of inflation risks, then the equity market could rise on the back of dovish expectations, and the Euro could fall. Analysts should also keep an eye for any changes in the language used for the ECB’s quantitative tightening or long-term liquidity measures, which could become market focal points for the second quarter.
United States: Weekly Unemployment Claims and JOLTS Labor Demand Metrics
For the States, labor market indicators will continue to dictate near-term rate market speculation. Weekly unemployment claims are a key labor market indicator.
- If unemployment claims are lower than expected, it will imply labor market stress is under control. This will further reinforce the risks of wage-driven inflation. It may cause bond yields to rise, and growth stocks may be affected.
- On the other hand, a sharp rise in unemployment claims may trigger concerns of hiring freezes or reductions. This may cause investors to switch to safe havens like staples, healthcare, and bonds.
At the same time, the JOLTS Job Openings report will shed light on the demand side of the labor market.
- A stronger-than-forecast reading will imply that companies are still having difficulty finding workers, indicating a tight labor supply and ongoing wage pressures. This will likely support the dovish Fed, prolong rate cut expectations, and continue to pressure rate-sensitive assets.
- On the other hand, if the report is significantly weaker than anticipated, it will reinforce the notion that labor demand is finally easing. In this case, rate cut expectations will resume their upward trajectory, which will benefit growth stocks.
The above series of events will not only Influence market sentiment but also change the global monetary policy landscape. Investors should be ready for possible cross-asset moves, particularly in GBP and EUR currency pairs, government bond markets, and sectors of the equity market that are sensitive to hiring and household spending.
Stock Market Performance
Indexes Edge Higher in 2026, But Internal Weakness Still Weighs on Breadth
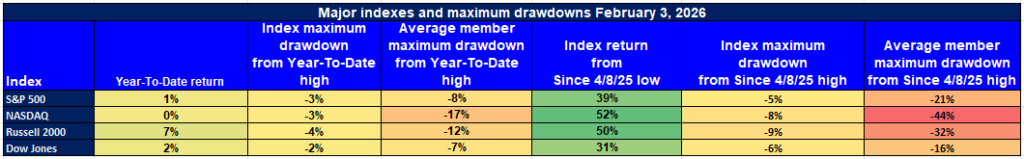
U.S. equity indexes continue to demonstrate their resilience in 2026 with moderate year-to-date gains building on the strong recovery since the April 8, 2025 low. However, underlying the indexes’ strength, member-level drawdowns remain significant, emphasizing the uneven participation, volatility, and the market’s ongoing struggle with low breadth. Breadth indicators continue to signal weakness across the majority of the major indexes, which continues to support our view of quality, defensively positioned names.
Let’s review the latest market performance for the major indexes:
S&P 500: Headline Stability Masks Member Strain
YTD: +1% | +39% off April low | -3% from YTD high
Avg. member drawdown from high: -8% | Since April low: -21%
The S&P 500 has made moderate gains with a 1% YTD return and 39% recovery since the April 2025 low. However, underlying the indexes’ strength, the member-level data shows the true strain on the market, with the average stock down 21% since the recovery peak and still 8% below the recent YTD highs.
NASDAQ: Strong Recovery, But Volatility Runs Deep
YTD: 0% | +52% off April low | -3% from YTD high
Avg. member drawdown from high: -17% | Since April low: -44%
Despite the 52% move from the April lows, the NASDAQ has not registered any YTD gains for 2026 so far. Moreover, the average member’s losses are still quite staggering. This means the NASDAQ average member is down 44% from post-April highs and 17% from the last peak.
Russell 2000: Outperformance Fades Underneath the Index
YTD: +7% | +50% off April low | -4% from YTD high
Avg. member drawdown from high: -12% | Since April low: -32%
The Russell 2000 has registered the highest YTD gains so far this year for the major US stock exchanges. With a 7% gain so far this year and an astonishing 50% rally from the April 2025 lows, the index seems to be faring well. However, this also means the average member has lost 32% from the post-April highs and 12% from the last YTD highs.
Dow Jones: Shallow Drawdowns Reflect Defensive Bias
YTD: +2% | +31% off April low | -2% from YTD high
Avg. member drawdown from high: -7% | Since April low: -16%
Despite the 2% gain so far this year and an impressive 31% rally from the April lows for 2025, the Dow Jones Industrial Average is not faring too badly either. This means the average member’s drawdowns are quite shallow for this index as well. Despite this, the average member is down 16% from post-April highs.
In addition, at Zaye Capital Markets, we continue to track the internal market dynamics beyond the performance of the market indexes. As such, while the recovery trends are evident, the persistent drawdowns in the members’ performance necessitate careful positioning in capital-efficient companies with pricing power, particularly in an environment of ongoing macro uncertainty, which has paused breadth-based recovery.
The Strongest Sector In All These Indices
Energy Leads 2026 Gains as Defensive and Cyclical Tails Diverge
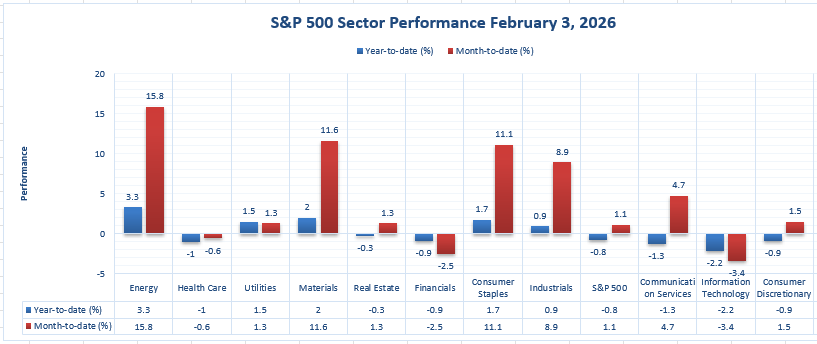
As of February 3, 2026, Energy is the strongest performing sector in the S&P 500 universe, well ahead of all other sectors with a dominant +15.8% year-to-date gain, and a strong +3.3% gain on the day. This solidifies Energy’s position as the strongest performing sector for the first half of 2026. This is a sharp divergence from other major indices, including the S&P 500, which is only up +1.1% YTD and down -0.8% on the day. Unlike other sectors that face headwinds from rate and earnings pressures, the Energy sector continues to benefit from supply constraints, geopolitical shifts, and strong pricing power among its constituents.
The Consumer Staples sector Is second strongest, gaining +11.1% YTD and +1.7% on the day. This reflects a healthy bid for defensive cash flow names as investors seek safer havens from the volatility plaguing other industries. Materials is another sector that holds its own with a gain of +1.3% YTD and +2.0% on the day. This reflects a rebounding appetite for cyclical names that are tied to industrial supply and demand. But again, it’s the Energy sector’s macro tailwinds, capital discipline, and flow dynamics that keep it in first place.
At Zaye Capital Markets, we continue to favor those sectors that have the strongest pricing power, capital discipline, and geopolitical tailwinds. And again, it’s the Energy sector that stands out for its absolute and relative strength, not just in terms of year-to-date returns, but in terms of flow. And as we continue to monitor macro and central bank shifts, we are watching for potential cross-sector rotation risks from underperforming sectors such as Information Technology (-3.4% YTD) and Financials (-2.5% YTD) into high cash-yielding sectors such as Energy.
Earnings
Yesterday’s Earnings Recap – February 4, 2026
- Alphabet Inc. reported Q4 2025 revenue of $113.8 billion, up 18% year over year, beating estimates of around $111.4 billion, while EPS reached $2.82, up 31% year over year. Full-year 2025 revenue exceeded $402.8 billion for the first time, reflecting strong momentum from Search, YouTube, subscriptions, and Cloud, with Cloud revenue rising 48% to $17.7 billion. Management guided for $175–185 billion in 2026 capital expenditure, largely focused on AI, reinforcing long-term growth ambitions but raising near-term investment intensity considerations.
- Novo Nordisk A/S delivered full-year 2025 sales growth of 10% and operating profit growth of 6% at constant currency, driven primarily by GLP-1 franchises such as Ozempic and Wegovy, with obesity care sales up 31%. EPS came in around 6.04 DKK, slightly ahead of expectations, while revenue reached approximately 79.14 billion DKK. However, the company issued a challenging 2026 outlook, projecting adjusted sales and profit growth of -5% to -13%, reflecting pricing pressure, U.S. market effects, and product mix shifts.
- ATS Corporation reported Q3 fiscal 2026 revenue of $760.7 million, up 16.7% year over year, with net income rising sharply to $30.0 million from $6.5 million. Basic EPS improved to $0.31, while adjusted EPS reached approximately $0.48, exceeding expectations. Adjusted EBITDA increased to $105.2 million, and order backlog remained strong at $2.05 billion, reflecting sustained demand for automation solutions despite some margin pressures.
- Fox Corporation posted Q2 fiscal 2026 revenue of $5.18 billion, up 2% year over year and ahead of estimates. Adjusted EBITDA declined to $692 million from $781 million, reflecting higher operating expenses, while adjusted EPS reached $0.82, beating forecasts. Advertising revenue rose modestly, supported by strength in cable news and sports, and distribution revenue increased 4%, helping offset tougher year-on-year comparisons.
- Eli Lilly and Company delivered another strong quarter, reporting Q4 2025 revenue of $19.3 billion, up 43% year over year, and non-GAAP EPS of $7.54, up 42%, beating market expectations. Growth was driven by Mounjaro and Zepbound, with key product revenue reaching $13.8 billion. Management guided for $80–83 billion in 2026 revenue and non-GAAP EPS of $33.50–35.00, supported by ongoing pipeline progress and regulatory approvals.
Today’s Earnings Preview – February 5, 2026
- Amazon.com, Inc. is scheduled to report results, with investors focused on profitability trends across AWS, core retail, and advertising segments. Key areas of attention include cloud growth sustainability, margin recovery in logistics, and cost discipline following workforce reductions. Forward guidance on capital spending and AI-related investments will be central to market reaction.
- Strategy Inc. is expected to report earnings with emphasis on software revenue stability and balance sheet management. Investors will closely monitor operating margins, subscription trends, and capital allocation policies, particularly in the context of volatile market conditions and enterprise spending patterns.
- Reddit, Inc. will release results that are likely to be evaluated on advertising revenue growth, user engagement trends, and progress toward sustainable profitability. Management commentary on monetization initiatives and platform expansion will be critical in shaping investor sentiment.
- Shell plc is set to report earnings with focus on free cash flow generation, capital returns, and integrated margin performance. Investors will assess upstream profitability, downstream resilience, and the company’s approach to shareholder distributions amid energy price volatility.
- CMS Energy Corporation will report results with attention on regulated utility earnings stability, infrastructure investment plans, and regulatory cost recovery. Guidance on capital expenditure and rate base growth will be key for evaluating long-term earnings visibility and dividend sustainability.
Stock Market Overview – Thursday, 5 Feb 2026
U.S. stock markets are opening with increased pressure, driven by the continued drag from the technology sector. Selling pressure in semiconductors, software, and AI-related names is pressuring mega-cap stocks. The Dow Jones is holding up well due to its value and industrial composition. The S&P 500 and Nasdaq are under pressure due to compression in the technology sector. At Zaye Capital Markets, we remain cautious of the current market leadership and are awaiting stronger participation before confirming risk-on sentiment.
Stock Prices
The current state of the economy is being affected by lower-than-expected private payroll growth, cautious consumer attitudes, and increased concerns regarding the sustainability of technology-driven growth. The latest labor market reports show weakening labor growth. The Federal Reserve is also divided regarding the direction of interest rates. Geopolitically, the capital markets are facing reduced liquidity, resurging trade tensions in Europe and Asia, and high levels of uncertainty regarding the policy coordination of the world’s natural resources. The 10-year Treasury yields are currently above 4.25%, which is pressuring the risk appetite of Investors.
Latest Stock News
GOOGL | Alphabet’s strong quarterly report was overshadowed by concerns regarding the deceleration of digital ad growth and the near-term profitability of its AI investments, which led to a selloff in the rest of the technology sector. The company reported that 60% of its capital expenditures are being used to build servers and ML machines, while 40% is being used to build data centers and network infrastructure. Significantly, the company is using half of its 2026 ML compute to power Google Cloud. Sundar Pichai reported that the company’s leading SaaS customers are embedding Gemini into their workflows to increase productivity and further reinforce the case for AI in the world of software, rather than replacing it.**
$NVDA | NVIDIA’s CEO Jensen Huang has sought to assuage investors’ fears of AI replacing software companies, stating that the fear is “illogical.” He further stated that AI will complement software companies, not replace them, and market movements reflect an incorrect understanding of the interrelationship between the two. Further, NVIDIA reported that the demand for NVIDIA chips is so strong that AWS has never decommissioned the A100 GPU, which was launched nearly six years ago. Each new generation of NVIDIA chips builds on the previous generation because the demand for the chips exceeds the combined supply of all the generations of the chips.
$AMZN | AWS CEO Matt Garman reiterated the unprecedented demand for cloud infrastructure, which has been further emphasized by the fact that AI workloads are growing at rates that make no previous generation of chips irrelevant. Garman reiterated the need for AWS to have layered chips, further stating that customer demand for older generations of NVIDIA chips, like the A100, has been sustained due to the shortage of capacity.
$META | Meta continued to lose ground due to the fear of tightening ad budgets for the core platforms and plateauing engagement. Despite the fact that the company has been investing heavily in AI, investors have clearly re-evaluated the earnings model and the long-term margin structure.
$TSLA | Tesla has been losing ground due to the sustained price cuts in the core markets and the increasing regulatory headwinds, particularly with respect to EV credits and data privacy.
The Magnificent Seven and the S&P 500

However, the “Magnificent Seven,” consisting of Alphabet, Amazon, Apple, Meta, Microsoft, Nvidia, and Tesla, have cumulatively declined by more than 18% from their recent highs, with significant declines from the shares of Meta and Tesla. The valuation compression, sensitivity to earnings, and slowing forward guidance for these companies have diminished their overall impact on the movement of the broader indexes. Nonetheless, these companies continue to remain a significant weight on the S&P 500 and the Nasdaq, and their underperformance will continue to be a headwind for these indexes unless a significant sectoral broadening occurs.
Major Index Performance as of Thursday, 5 Feb 2026
- S&P 500: The S&P 500 is trading at 6,882.72, down 0.5%, as the overall decline of the mega-cap technology sector outweighs the gains from the energy and defensives sectors.
- Nasdaq Composite: The Nasdaq Composite is trading at 22,904.58, down 1.5%, as the overall decline from the semiconductors and speculative technology sectors outweighs the gains from the overall market.
- Dow Jones Industrial Average: The Dow Jones Industrial Average is trading at 49,501.30, up 0.2%, as the overall gains from the industrials and value sectors outweigh the declines from the technology sector.
- Russell 2000: The Russell 2000 is trading at 2,624.55, down 0.4%, as the overall pressure on the growth-sensitive small-cap sector outweighs the gains from the overall market.
At Zaye Capital Markets, our assessment is that the overall environment is supportive for a disciplined approach with a focus on the overall quality of the earnings profile, sector diversity, and risk-controlled pace.
Gold Price: How Do Rate Cut Signals and Trade Talks Impact Gold Prices?
Gold prices are currently trading near $4,864 per ounce on Thursday, February 5, 2026. This represents a dip for the precious metal following its run to new heights above $5,000 per ounce as the U.S. dollar strengthened and risk appetite shifted amid shifting global economic narratives. With this backdrop, the recent round of high-level diplomatic engagement to ease U.S.-China tensions and increase agricultural purchases has served to reduce safe-haven demand for the yellow metal and put downward pressure on prices. At the same time, comments suggesting “interest rates are likely to be lowered” have also served to impact gold prices, as this represents a counter-narrative to the easing tensions and serves to impact gold prices. At Zaye Capital Markets, we recognize the impact of these factors and understand the counter-cyclical nature of gold prices. At the same time, the impact of yesterday’s economic releases serving to moderate labor markets has served to further underscore the motivations for investing in precious metals as investors continue to look to adjust their portfolios to meet uncertain growth prospects. Economic data serving to moderate labor markets serves to impact real yields and further bolsters the strategic investment thesis for gold as a hedge against slowing growth and low interest rates. With today’s slate of economic indicators including unemployment claims and central bank monetary policy statements for the UK and Europe, the risk for weaker economic data could serve to reignite safe-haven interest and further bolster gold prices. At the same time, if labor data surprises to the upside, this could continue to pressure gold prices as this represents the short-term impact of risk appetite and currency values.
Oil Prices: How Do Diplomatic Talks and Macro Data Impact Crude Oil Prices Now?
Oil prices have been stabilizing since recent volatility, with Brent oil currently priced at $68.02 per barrel and WTI oil priced at $63.80 per barrel on Thursday, 5th February 2026. Diplomatic efforts between the US and Iran have led to a reduction in the price of oil due to reduced risks of supply disruptions from the Middle East. The recent diplomatic efforts have led to a decline of 2% in oil prices despite an increase of over 2% just the previous day. Such instances reflect how rapidly changing risks, not just supply fundamentals, are influencing oil price movements. On the other hand, OPEC+ has decided to maintain its current production levels until March. Such an approach by OPEC+ indicates that they are cautious about demand patterns. On the other hand, forecasts by major energy agencies predict that supplies will not run out soon since supplies from non-OPEC sources will increase. The current situation is being influenced by a stronger US dollar and diminishing risks. Oil price movements are currently being influenced by macro factors.
Yesterday’s softer labor statistics, focusing on diminishing gains in private sector jobs and a slowing economic pace, are further dampening crude prices as they increase concern about future energy demand growth in transport, industrial, and consumption categories. These types of statistics tend to compress price expectations as they raise questions about the robustness of global energy demand, especially as markets await today’s slate of key statistics, including US unemployment claims, JOLTS job openings, and statements from UK and European monetary policy meetings. If these statistics affirm a further slowing economic growth rate or increase expectations of a dovish monetary policy, crude prices may find additional support through capitulation of long positions and safe-haven plays. From a Zaye Capital Markets perspective, we believe that direction of oil prices is heavily dependent upon a multitude of factors, including supply, risk, and economic statistics, and that it is essential to monitor demand statistics, geopolitical events, and producer strategies in real time.
Bitcoin Prices: Why Is Bitcoin Falling Despite Rate Cut Hopes and Risk-Driven Volatility?
Currently, the price of Bitcoin is $70,291 as of Thursday, February 5, 2026. The price has been experiencing a decline from its recent high of $98,000. The current price of Bitcoin is its lowest over the past year. Yesterday, it was observed that there was a high-volume flush below $73,000 before stabilizing intraday. The overall sentiment of all risk assets has been risk-off. Yesterday’s less-than-expected private payrolls and signs of labor momentum have further strengthened this. At Zaye Capital Markets, we believe that currently, the price of Bitcoin is trading within a fragile support band of $70,000-$73,000. Yesterday’s economic data has further strengthened investor concerns. The current volatility of Bitcoin is high. Institutional repositioning and leverage unwinds are currently influencing its price. From a macro and political point of view, Trump’s recent comments regarding rate cuts and opening lines of communication with China have not been able to create any positive momentum for Bitcoin. The recent communication has further strengthened investor confidence. The recent message of lessening inflation risks and improving US-China relations has further strengthened investor confidence. Therefore, they are choosing traditional safe-haven assets. The recent economic situation has further lessened the need for crypto hedging. Technical forecasts are currently flashing caution. Analysts are of the view that if global risk sentiment does not improve, then it may dip further below $70,000. Today’s economic data will include unemployment claims, JOLTS job openings, and central bank statements. The overall economic situation will determine whether it will ease or worsen. Currently, its status as an alternative asset remains unchanged. However, it is currently being put to the test.
ETH Prices: How Do Whale Activity and ETF Flow Shifts Drive Ethereum Price Pressure?
Ethereum is currently trading near the $2,100–$2,250 range on Thursday, February 5, 2026, oscillating significantly lower from earlier January levels and testing critical support amid broad crypto market drawdowns. The recent price weakness in ETH reflects intensified selling pressure, with the asset down more than 20 % over the past month as risk assets retraced sharply. Trading ranges have compressed below the $2,400–$2,550 zone earlier in the year, pushing the market toward bearish momentum territory and increasing downside risk if key support fails to hold. This softness has coincided with heightened liquidation events, with substantial liquidation flows in both spot and futures markets contributing to persistent bearish sentiment and amplified volatility around current price levels. At Zaye Capital Markets, we note that the current technical landscape remains fragile, with traders closely watching the $2,000 psychological threshold, as a break below this level could precipitate deeper declines toward $1,800 or lower.
Institutional flows and large‑holder behavior are also exerting material influence on Ethereum’s price trajectory. Recent on‑chain data shows that spot ETH products recorded modest net ETF inflows of around $14 million on February 3, signaling selective institutional interest after a period of sustained outflows—a dynamic that could help anchor liquidity and reduce near‑term selling pressure. However, large whale transactions tell a mixed story: some whales have been accumulating ETH at discounted price levels, while others have executed significant leveraged short positions or large liquidations, generating divergent forces in the market. For example, one whale reportedly executed a 25x leveraged ETH short, profiting as prices fell and adding downward pressure, while other large holders accumulated tens of thousands of ETH at mid‑$2,000 price levels, reflecting a longer‑term conviction that current valuations represent tactical entry points. These opposing pressures, along with broader macro stress and risk‑off behavior triggered by softer economic data and cautious institutional positioning, create a complex environment for ETH pricing. Future movements will depend heavily on ETF flow consistency, macro sentiment shifts, and the relative strength of accumulation versus liquidation patterns in large‑holder cohorts.
