Where Are Markets Today?
Global equity futures are beginning the day on slightly positive but mixed grounds, with US market futures making minor gains. Up to this morning, S&P 500 E-mini contracts rose approximately +0.1%, indicating cautious optimism on Wall Street. Deflating hopes for several big-tech names’ underwhelming earnings notwithstanding, sentiment remains supported by promises of a imminent rate cut at the Fed, with CME FedWatch data assigning a 96.7% probability of a 25 basis-point cut at the next policy meeting. Investors are cautiously positioning before major releases of key economy data, notably housing and labour, which may further warrant a shift in monetary policy. Nasdaq, and Dow futures are modestly positive, indicating that investors are looking beyond short-term earnings noise and more at a bigger picture macro context of monetary stimulus.
In Europe, futures are a tad stronger but not as convincing as in U.S. markets. Local indices, such as the DAX and Euro Stoxx 50, registered mild increases in initial trade but remained broadly range-bound. The cautious mood reflects increased local worries about inflation, export weakness, and increased divergence between central bank policies in Europe and America. While the Fed seems poised to cut rates to boost expansion, more hawkish thinking prevails at the European Central Bank as it holds firm despite continuing consumer price pressure as well as a falling euro. Eurozone investors are also responding to regional earnings with skepticism as growth prospects for major export-based economies such as Germany continue to be downscaled. The differential in futures positioning results from two key dynamics. One, global equities are being supported by monetary policy easing expectations, which helps to underpin high equity multiples, particularly in interest rate-sensitive areas such as tech and discretionary consumption. Two, regional markets in Europe face macro asymmetries precisely in weaker external demand, sticky inflation, and sluggish policy maneuverability. The U.S. comes to be seen as ever more at the tail-end of its tightening cycle, with room for cuts, whereas Europe remains mired in stagflation-esque conditions. Consequently, U.S. futures are mildly higher on central bank stimulus expectations, whereas European futures reflect indecision under conditions of policy uncertainty.
At Zaye Capital Markets, we interpret today’s futures landscape as one of tentative risk-taking, but highly selective positioning. The policy path of the Federal Reserve is clearly anchoring near-term bullishness in U.S. markets, even as earnings deliver mixed signals. In contrast, European markets remain in a holding pattern, waiting for clearer signals on inflation control, export strength, and ECB guidance. Until there is broader alignment between policy, growth, and inflation trends across both regions, we expect futures to remain choppy, with U.S. assets outperforming on the basis of more immediate policy flexibility and relative economic resilience.
Major Index Performance as at Thursday, 23 Oct 2025
- S&P 500: It was trading at 6,627.51, having lost 0.5%. It had narrow leadership.
- Nasdaq Composite: Down at 22,437.12, -0.7% as tech mega-cap drags on.
- Dow Jones Industrial Average: Trading at 46,089.07, up 0.1%, supported by strength in industrials and defensives.
- Russell 2000: Trading at 2,429.88, unchanged, a reflection of general strength in rate.
The Magnificent Seven and the S&P 500
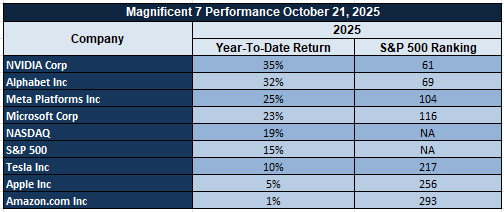
The “Magnificent Seven” — Apple, Microsoft, Nvidia, Amazon, Meta, Alphabet, and Tesla — are again under pressure this week, dropping collectively over 18% from recent peaks. Tesla and Meta are leaders of the selloff, egged on by margin compression, revenue sensitivities, as well as a levelling of AI exuberance. This group that had been responsible for an outsize block of index-level advances now weighs on the S&P 500 and Nasdaq Composite, stoking fears about concentrated leadership as well as dependency on earnings. Unless these names bounce — or a sector broadening ensues — upside for the market might stay range-bound as November approaches.
Drivers Behind the Market Move – Thursday, October 23, 2025
With US and European markets going ahead with a turbulent horizon of economic data, geopolitical risk, and policy news, several key factors now influence investor sentiment as well as market directions.
1. New Sanctions and Geopolitical Tensions
The U.S. government has unveiled fresh sanctions on major Russian oil firms, such as Rosneft and Lukoil, as a result of increased economic pressure with no end in sight for the war in Ukraine. President Trump ratified the abrogation of his meeting with President Putin, blaming stagnated diplomatic advances. This has added fresh geopolitical risk to market sentiment, driving interest in safe-haven assets in the U.S. while sowing uncertainty in euro-area markets with high exposure to energies as well as regional trade flows. Lingering doubts about future US-Russia and US-China relations are also fueling market indecision, most notably in industrial as well as energy-correlated industries.
2. Diverging Expectations of Monetary Policy
U.S. stock futures are aided by strong expectations for monetary easing, with markets implying a 96.7% chance of a 25-basis-point interest rate reduction at the upcoming meeting of the Federal Reserve. This contrasts with Europe, where a more inflationary environment and little room for policy easing in the near term faces the ECB. This central bank positioning divergence is weighing on the outperformance of U.S. futures over their counterparts in Europe, with rate-sensitive areas such as technology and discretionary benefiting in the U.S. despite disappointing corporate earnings.
3. Cautious Mood Ahead of Major Announcements
Investors are watching today’s release of U.S. Existing Home Sales data with a wider concern that continuing fiscal uncertainty and possible shutdown effects might hold back or confuse future macro indicators. Together with yesterday’s weak regional manufacturing and services information, such reports are stimulating a risk-averse mood across world equities. In Europe, export sluggishness and policy uncertainty are furthering defensive exposure. With further clarity being awaited by markets, trading volumes continue to languish, with investor attention now centered on economy durability and policy flexibility approaching year-end. In a word, this convergence of surging geopolitical tensions, diverging policy expectations, and major economic data is forming today’s market narrative. Such forces are being viewed by investors with a bit of caution, which translates into minor U.S. futures gains and a more subdued tenor across European benchmarks.
Digesting Economic Data
The TRUMP Tweets and Their Implications
A thorough set of statements by President Trump and the administration this week provided a shock to international markets, impacting as much as geopolitical risk and trade flows as fiscal policy and inflation views. Center stage was news of fresh Russia sanctions, which underlines a hardening of a US stance with no clear time horizon for an end to the Russia-Ukraine standoff. Canceling a meeting with President Putin and statements that suggest scant diplomatic traction indicate a deep-seated nature to this geopolitical standoff. Spillovers are real for global risk sentiment as well as for energy markets: extended sanctions could continue to disrupt Russian oil flows, boosting global oil price volatility, while a lack of diplomacy increases demand for defensive assets such as gold and US Treasuries.
At the same time, the Trump administration turns up the economic screws on China, floating a comprehensive export control regime aimed at all products made worldwide with US software—an export control regime that could further seriously strain global technology and manufacturing supply chains. Trump’s advisors have also hinted at collaboration with G7 allies to make such restrictions official, doubling down on a multi-lateral approach to decoupling economies. Such developments create systematic risk for tech industries, particularly for semiconductors, AI, and robotics, and may trigger retaliatory actions by Beijing. For investors, this move injects new uncertainty in an already tenuous global trade environment and may catalyze the re-shoring narrative and capex cycles in US-biased economies. The outcome: whereas such tensions might, in the near term, underpin dollar demand as well as safe-haven flows, they create structural inflation risk owing to likely supply bottlenecks. In trade, Trump validated that a US–India deal was going on, with India seemingly agreeing to gradually reduce Russian oil shipments and reduce US farm products such as non-GM corn and soymeal tariffs. If finalised, the deal may rebalance commodity trading, increase US farm export volumes, and exert price pressure on select agri-markets in Asia. This marks a subtle move towards reinforcing core bilateral strategic relations, aimed at shielding US trade from shocks in China and Russia. It, however, injects volatility in world supply flows since it may push global food price inflation, given that commodity rerouting lowers availability of supplies for certain importers.
Meanwhile, domestic fiscal issues are gaining traction, with the U.S. national debt now at over $38 trillion, stoking market fears about long-term solvency and control over inflation. Trump’s administration has hinted at large tax refunds for Americans as well as expressed confidence that CPI could start to come down over the coming months—a vote of confidence on disinflation notwithstanding sticky services data. Nevertheless, with threats of shutdown yet to get addressed as well as energy-driven inflation still festering beneath the horizon, such mixed messages may produce policy uncertainty that will make life more difficult for the Fed going forward. For us at Zaye Capital Markets, this string of Trump-era positioning serves as a cue for investors: get ready for volatility, keep a close eye on sector-specific exposure, and remain extremely selective as geopolitical as well as fiscal crosscurrents strengthen during Q4.
Rotation from Speculation to Stability
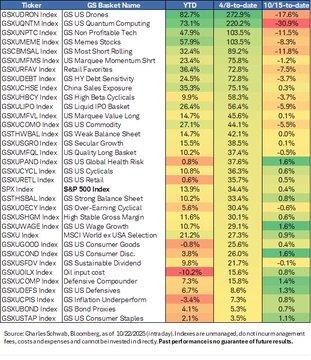
Recent market shifts indicate a definite re-balancing of investor sentiment as euphoria for risk shifts towards prudence. For months, large gains in high-beta sectors including drone technology as well as meme-related equities, which both spiked after April’s rebound, saw sharp losses wiping out much of their summer momentum. This reversal indicates that traders are becoming more aware of the consequences of decelerating expansion, sticky core inflation, as well as ambiguity over the policy path. Market sentiment seems to be drifting out of risk-rich positioning as investors are taking in mixed economic reports which indicate cooling demand as well as tighter liquidity.
At the same time, defensive areas have quietly held up, with consumer staples, utilities, and inflation-underperforming baskets remaining relatively resilient. This rotation towards a more stable mix highlights a larger appetite for more predictable-earnings, less-volatile, and sustainable-dividend generating companies. This flattening of the S&P 500 alongside simultaneous weakness in gold indicates that money is not necessarily leaving the market but rather rotationally moving towards quality- as well as value-driven plays. Put simply, investors prefer more fundamentally sound businesses over speculatively oriented high-growth stories that benefited during the initial rebound phase. We think this is more of a transition period, rather than a start point for a sustained deterioration. Repricing of spec areas offers a healthier platform for a subsequent market recovery, underpinned by fundamentals, not sentiment. Analysts must search for value in underpriced large-cap consumer and industrial names that are selling at discounts to prior multiples. Balance-sheet strength, recurring free-cash flow, and exposure to local demand themes remain key criteria. We think such factors are positioning for a more sustainable recovery once confidence stabilizes further and inflation pressures continue to fade.
Demographic Divergence and Global Growth Potential

The latest global demographic data paints a picture of a widening gap between youth- intensive and older economies, which holds immense long-run market implications. Africa continues to be by far the youngest continent, with over 20 nations recording a median age below 20, with a total population nearing 800 million. Put side by side with Europe’s rate of 43 or Asia’s range from Japan’s 50 to Afghanistan’s 20, it sharpens exactly how population structure is rapidly becoming a major driver of growth, productivity, as well as fiscal sustainability. They are not just a sociological phenomenon but a powerful economic driver that defines investment flows, consumption cycles, as well as a nation’s work-creating capacities.
Youthful areas possess great promise for continued growth if education, information technology, and industrial development come together to capture the swelling workforce. Demographic models suggest that such areas will experience per capita GDP expansion increased by as much as 1% a year to the middle of this century as productivity improves and domestic demand intensifies. Aging economies, by contrast, confront structural challenges from dwindishing pools of labour to rising social costs pressures that bind policy maneuverability as well as business profitability. This gap between demographic drive and stagnation will more and more dictate capital deployment, notably between emerging as well as developed market equities.
In Zaye Capital Markets’ view, this divergence offers a roadmap for long-term investment strategy. Undervaluation in frontier and select emerging markets, with a particular emphasis on countries having juvenile demographics as well as reform momentum, offers attractive entry points for patient capital. Analysts need to keep an eye on education funding shifts, digitalization of workforces, as well as regional manufacturing expansion, as foremost predictors about which economies will successfully translate demographic potential into growth dividends. This structural realignment that comes with a generation will, in our view, characterize the next structural outperformer cycle, representing diversified investors’ strategic opportunity in the decade to come.
Manufacturing Strain Increases as Global Corporate Insolvencies Increase
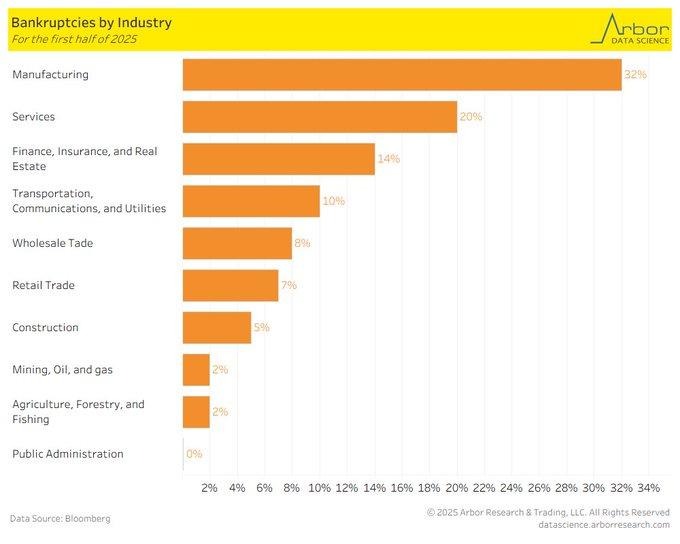
The sudden spike in large-scale US corporate bankruptcies in the first half of 2025 highlights building strain in the industrial economy. 59 companies with assets of more than $100 million declared bankruptcy—the highest first-half count since 2010—of which 32% were in manufacturing. This increase represents a collision of lingering headwinds: high costs of borrowing stemming from sustained 5.25–5.5% interest rates, disruption of global supply chains caused by tariffs, and stuttering pace of policy changes related to transition mandates on energy. The segment’s long-standing contraction has already seen more than 78,000 job losses this year, a harbinger of further structural strain that will continue to burden output during the final quarter.
The trend reveals how tighter finances and fragmentation of trade are taking a toll on balance sheet strength across mid- and large-cap manufacturers. Weakened factory activity for a seventh consecutive month, now in contraction, implies a possible 1–2% hit to industrial GDP if it continues. Mega-bankruptcies, with assets of more than $1 billion, account for almost half of manufacturing filings, which heightens systemwide risk to suppliers and logistics channels. Data reflects a distinct inflection in the industrial cycle, as business liquidity and stock management come to a head in maintaining solvency across volatile input prices and changing demand. We consider this environment selective opportunity with caution at Zaye Capital Markets. With weaker sentiment across broader industries, undervaluation is developing in high-quality, capital-effective manufacturers that also possess strong export exposure with minimal leverage. Analysts will want to watch for upcoming PMI readings, especially below 48, as a sign of stabilization or further deterioration of this downturn. Selective accumulation in companies with resilient margins, diversified supply chains, and flexibility for pricing may create value over the long term as money pressures start to abate as do trade pressures.
Service Sector Confidence Falls to Multi-Year Low
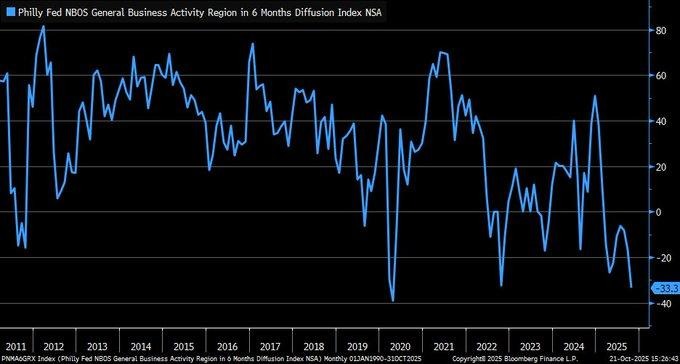
The most recent Philadelphia Fed Nonmanufacturing Business Outlook Survey shows service sentiment taking a sharp turn for the worse, with its six-month diffusion index falling to -33.3 in October—the lowest reading since 2020 and on a par with 2022 downturn bottoms. Measuring as a net share of companies that foresee improvement over decline, the index shows growing business pessimism about economy components that account for more than 80% of regional GDP. Coming with a decrease in its counterpart, the current activity index, to -22.2, it indicates not just diminishing expectations but a concurrent same-period retreat in demand, order intake, and employment across the wider service economy.
This regional deterioration appears out of step with national measures that continue to reflect moderate expansion, which would suggest regional weakness may be a precursor to overall economic slowdown. Increased finance costs, policy uncertainty, and variability in consumer spending patterns appear to be exacting a heavy penalty on confidence in the Mid-Atlantic corridor. Previously, such deep negative sentiment readings have been a forerunner to slowdowns in job gains and small-business spending, particularly in service-driven regions that are heavily dependent on discretionary consumption as well as business-to-business demand. This regional contraction-national expansion measures disparity may get narrow soon if overall demand weakens towards year-end. In Zaye Capital Markets, this sentiment collapse serves as a harbinger for near-term moderation in the economy but also as a value setup for oversold service-based equities. Numerous mid-cap companies in professional services, logistics, and local retail now reside below long-run valuation means yet possess steady revenue streams. Analysts must watch November’s countrywide ISM services data as well as employment sub-indexes for assurance of whether this pessimism extends across the country. For investors, disciplined accumulation in underpriced service businesses with pricing power as well as diversified customer bases may create attractive entry areas before sentiment recovery.
Health Plan Search Spikes Indicate Consumer Anxiety
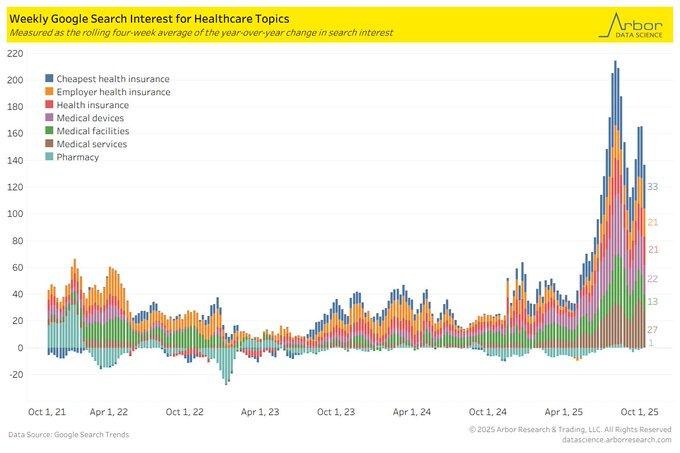
A 200% year-over-year increase in internet searches for “cheapest health insurance” indicates rising financial pressure across US households as healthcare costs continue to outstrip wages. Arriving as premium hikes for family coverage under employer plans come in around 6%—putting its typical premium at around $27,000 annually—and 18% for individual market policies, it seems consumers care more about affordability than about quality coverage heading into open enrollment, a sign that rising living costs are reshaping priorities for expenditures as much as for trust in benefit designs.
This new scrutiny of healthcare expenses reflects broader inflation fatigue, in particular as disposable income remains scarce and federal premium subsidies expire. It speaks to a foundational consumer economy weakness: healthcare inflation has been stickier than other price tiers as they slow, further tightening finances for middle-income consumers. As consumers seek out cost-saving alternatives such as cash-pay physician care or health-share ministries, this established paradigm of insurance faces more pressure from a cost-sensitive public. This trend may create secondary effects for providers, insurers, and business alike, both for labor market conditions as well as benefit design as we proceed towards 2026. In Zaye Capital Markets, we view this behavioral information as a significant consumer sentiment indicator—one that may temper discretionary spending and narrow margins in areas related to household service and retail health. Insurer enrollment trends and medical cost inflation metrics should be monitored by analysts for signs of stress in healthcare utilization patterns. We view undervaluation as developing in certain managed-care and healthcare technology companies well-positioned to benefit from demand for cost-effective coverage solutions. Selective exposure to these categories may provide insulation as consumers and corporates adjust to a more cost-effective healthcare environment.
Full-Time Jobs Weaken as Companies Ask for Flexibility
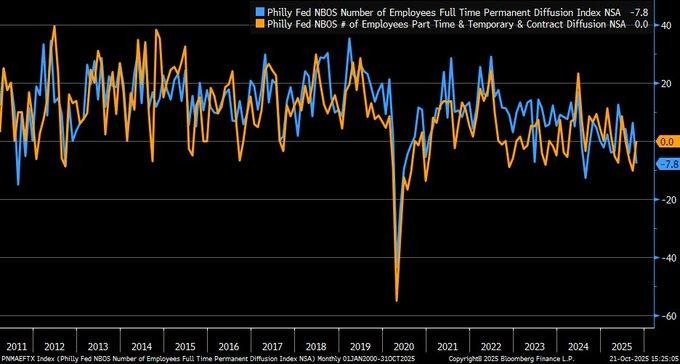
The Philadelphia Fed Nonmanufacturing Business Outlook Survey for October indicates a significant change in labor flows, as the full-time permanent employment diffusion index falls to -7.8—the first contraction since April. Approximately one in twenty firms cut permanent staff, more than twice as high as in the prior month, as caution increases with decelerating demand. At the same time, hiring for parts or by contract remained at 0.0, as if signaling that employers continue to maintain flexibility in operations by retaining contingent staff but refrain from making long-term commitments to staff. This deviation itself indicates service firms, as large as they are for regional output, are reshaping work structures to manage uncertainty but refraining from a general retrenchment.
The wider context of this survey’s results underpin this tentative tone: overall business activity remains strongly negative at -22.2, as with initial indicators of a service employment cooldown across the country. Related patterns in national statistics—where ISM services employment just slipped below its expansion barrier—signal a possible inflection in recruitment pace. Though such changes might maintain a lid on wages inflation, they also carry a risk of reducing consumer confidence and discretionary consumption, if November’s national payroll report shows further losses in full-time employment. This delicate balance between containing labour cost expansion, on one hand, and demand stability, on the other, will characterize this next phase of a services cycle. In Zaye Capital Markets, we consider this transition both a risk and a chance. Slow easing in full-time work could ease inflationary pressure and aid longer-term policy easing, yet it brings near-term earnings headwinds to consumption-linked areas. Analysts need to look for a confirmation of these work trends in forthcoming employment releases. We look for undervaluation in service-based companies with scaleable work models and multiple revenue streams—most notably, organizations that utilize automation as well as flexible staff structures to maintain margins during a slowing employment phase.
Strategic Petroleum Reserve Refill Signals Policy Rebalancing
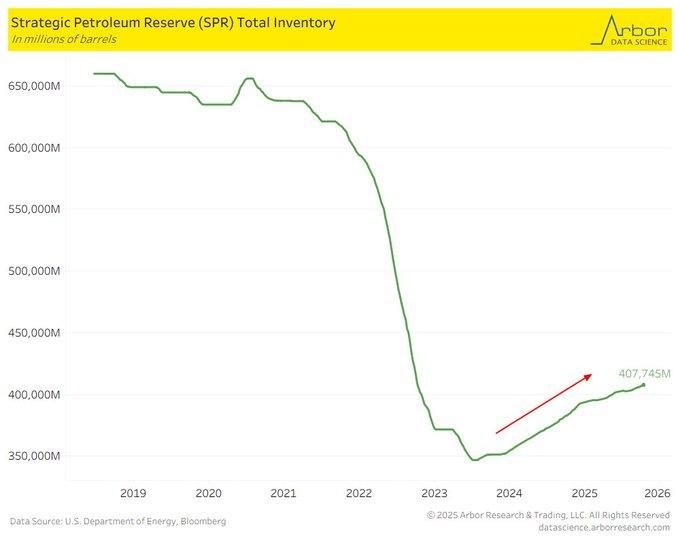
The slow replenishing of the U.S. Strategic Petroleum Reserve (SPR) constitutes a notable reversal of the administration of energy policy after a record-breaking emergency drain. Stocks increased slightly from a record low of 407 million barrels in 2023 to 408.6 million barrels in early October 2025 but are still 37% below levels prior to 2022. The prior release of approximately 240 million barrels constituted a decision to stabilize domestic fuel prices amid unexpected market disruptions, which commenced at the close of 2021 and continued in 2022 as global supply disruptions mounted. This replenishing initiative demonstrates both fiscal responsibility as well as a strategic about-face towards maintaining long-term energy resilience after several years of crisis-driven draining.
Discount crude prices provided cost-effective refills, with over $15 billion in peak acquisition price savings estimated over time by the Department of Energy during the 2022 energy crunch. This disciplined replenishment demonstrates a wholehearted commitment to price control in the near term that is tempered with long-term supply security. Storage infrastructure utilization also benefitted from replenishment work, signifying that global oil markets stabilized enough to replenish stock without destabilizing spot prices. Inventories, however, remain historically lean, which leaves the US more vulnerable to near-term disruptions of a geopolitical or weather nature. We interpret the SPR replenish as a positive sign for both market normalization and energy security. Replenishment at a gradual pace indicates policy flexibility in a way that does not compromise demand-driven price equilibria. Refining utilization rates, domestic production trajectories, and OPEC+ production decisions will hold important clues about how fast strategic stocks might be replenished. We view undervaluation developing at midstream/es storage-oriented oil corporations best-positioned to gain from more federal procurement as a result of heightened logistical momentum, which opens a stable investment gateway to a transitioning, volatility-healed structural balance-rich sector.
Upcoming Economic Events
Existing Home Sales
This week’s release of housing statistics comes as investors look for a fresh reading of Existing Home Sales, a crucial gage of consumer demand, credit, and overall economic momentum. This reading quantifies the monthly, yearly rate of existing homes sold, and it remains one of the most indicative reflections of home sentiment and financial confidence. With a background of high mortgage rates and moderating affordability, a reading will undergo greater scrutiny for insight as to whether or not the real estate market stabilizes or loses yet more traction.
Existing Home Sales
- If it turns out bigger than projected, it would indicate demand has been more resilient than initially thought, perhaps a sign of easier credit or improving buyer sentiment. This kind of upside shock would maintain the story about consumer fundamentals being okay, which would benefit cyclical groups such as homebuilding, building materials, and finance related to mortgage banking. Stocks would likely view the strength as a sign of core economy resilience, which would create short-term increases in home-related stocks—although bond yields might move slightly upward as financial players rebalance expectations about easy monetary policy.
- But if the true result falls below expectations, it would validate drags from high-cost borrowing as well as affordability ceilings, again threatening worries about decelerating household formation as well as weakening consumer balance sheets. Such a turn could strain equity markets, especially in real estate as well as financial sectors, but buoy bond-based defensive positioning alongside dividend stock exposure.
In our estimation at Zaye Capital Markets, analysts must monitor regional sales segmentation alongside inventories closely: further tightening in high-cost regions would suggest continuing weakness to come, but resilience at the level of mid-tier markets may suggest underlying stabilization across the overall cycle in housing.
Stock Market Performance
Indexes Bounce Back from April Lows, but Narrow Leadership Continues
US stock markets continue to rebound since bottoms on April 8th, but below the surface, we see a spotty rebound as well as sluggish breadth for major indexes. As headlines remain upbeat, repeated setbacks as well as big dispersion between individual components mean that risk sentiment centers on big-cap leaders, with most of the market mired in neutral.
That’s our snapshot of past performance on major indexes:
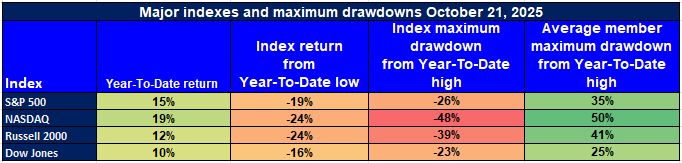
S&P 500: Solid Rebound, but Breadth Still Thin
YTD: +15% | +35% off April 8th low | -19% from YTD high | Avg. member: -26%
The S&P 500 remains headline resilient with a 15% year- to-date increase and a 35% retrace of April lows. Yet, a 19% decline from its yearly high and typical member losses of 26% illustrate narrow participation. Leadership in the index remains concentrated at mega-cap names, emphasizing selective as opposed to broad-strength.
NASDAQ: Tech-Led Rally Despite Severe Member Loss
YTD: +19% | +50% off April 8th low | -24% from YTD high | Avg. member: -48%
The NASDAQ leads charts of performance, up 19% YTD as well as 50% since April’s low, on sustained AI as well as semiconductor demand. All the same, the average NASDAQ index member’s 48% drawdown indicates underlying volatility as well as decreasing participation amongst non-megacap tech names—a key red flag for momentum players.
Russell 2000: Small-Caps Struggle for Conviction
YTD: +12% | +41% below April 8 low | -24% below YTD high | Average member: -39% After a spectacular 41% recovery from April lows, small-cap performance remains patchy. A 24% decline from peaks and a 39% average member decline continue to underscore persistent pressure on smallest, rate-sensitive businesses. Overall risk tone remains cautious, a reminder of burden of surging cost of borrowings and dissipating demand.
Dow Jones: Defensive Strength with Modest Profits
YTD: +10% | +25% off April 8th low | -16% from YTD high | Avg. member: -23% The Dow’s defensive lineup has provided relative stability, which rose 10% this year as well as 25% since its April low point. A relatively tame 16% correction shows steady industrial and consumer-staples components, but below-average member weakness shows selective leaders among defenders themselves.
Zaye Capital Markets remains upbeat but tempered, preferring quality to momentum, with a bias toward earnings endurance as market breadth remains inconsistent. Analysts should remain alert to volatility compression, sector rotation, and member drawdown themes for buy signals that a sustainable, broadly based rally will persist.
The Strongest Sector in All These Indices
S&P 500 sector performance as of 10/21/2025: Year-to-date vs
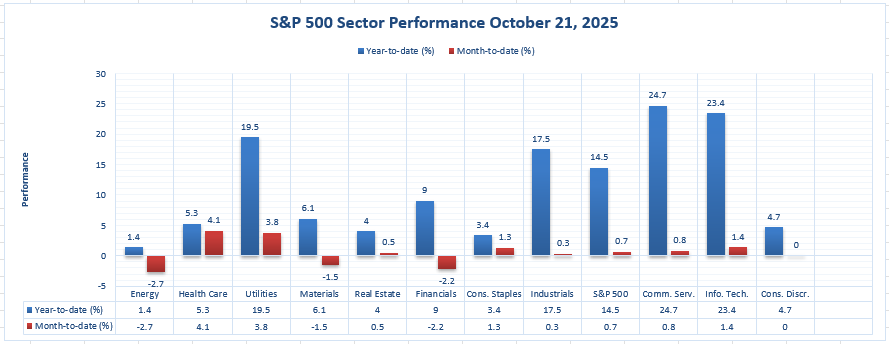
We note that leadership continues to concentrate amongst a few areas. On a year- to-date basis, Communication Services leads at +24.7%, followed by Information Technology at +23.4% and Utilities at +19.5%. Industrials at +17.5% outpaces S&P 500 at +14.5%. The rest: Financials +9.0%, Materials +6.1%, Health Care +5.3%, Consumer Discretionary +4.7%, Real Estate +4.0%, Consumer Staples +3.4%, and Energy +.
Month-to-date, strength changes: Health Care leads at +4.1%, followed by Utilities +3.8%, Consumer Staples +1.3%, Information Technology +1.4%, Communication Services +0.8%, Real Estate +0.5%, and the S&P 500 +0.7%. Laggards MTD are Industrials +0.3%, Consumer Discretionary 0.0%, Materials -1.5%, Financials -2.
Our takeaway at Zaye Capital Markets: the strongest sector YTD is Communication Services (+24.7%), while Health Care (+4.1%) leads MTD. These figures highlight concentrated market leadership YTD, with a defensive tone emerging in near-term rotation. We continue to watch whether Utilities and Health Care maintain their MTD strength, and whether Communication Services and Information Technology can sustain their YTD outperformance relative to the S&P 500’s +14.5%.
Earnings
Earnings Recap – Yesterday (22 Oct 2025)
- International Business Machines Corporation (IBM)
IBM posted Q3 revenue of US $16.3 billion, up around 9% year-on-year (7% at constant currency). Its software division grew 10%, while infrastructure rose 17%, supported by expanding hybrid-cloud adoption. The company also highlighted an AI “book of business” exceeding US $9.5 billion, underscoring rising demand for automation and data solutions. Management raised its full-year outlook to more than 5% revenue growth and approximately US $14 billion in free cash flow. Despite these upbeat metrics, shares softened as investors focused on concerns over moderating growth within IBM’s cloud business, which remains a key performance driver.
- Thermo Fisher Scientific Inc. (TMO)
Thermo Fisher delivered stronger-than-expected Q3 earnings, reporting an adjusted EPS of US $5.79 versus estimates of roughly US $5.50, and revenue of US $11.12 billion, reflecting around 5% growth. Margins improved to 23.3%, helped by efficiency initiatives and sustained bioproduction demand. The company also cited notable progress in its diagnostics and life sciences portfolio, including regulatory approvals for new oncology testing tools. Management raised full-year guidance to US $44.1-44.5 billion in revenue, highlighting confidence in recurring demand from healthcare and research end-markets.
- AT&T Inc. (T)
AT&T reported third-quarter revenue of US $30.7 billion, adjusted EBITDA of US $11.9 billion, and free cash flow of US $4.9 billion. Subscriber performance remained robust, with approximately 405,000 post-paid mobile additions and 288,000 new fiber customers. The results underscore steady network expansion and continued focus on deleveraging. However, competition in both 5G and broadband continues to pressure margins, placing emphasis on execution and cost discipline heading into Q4.
- Tesla, Inc. (TSLA)
Tesla’s results remained under close investor watch, with preliminary figures suggesting EPS near US $0.54 on revenue of roughly US $26.2 billion. Markets focused on the company’s margin trajectory amid cost inflation, as well as delivery trends across key global markets. Updates on autonomous driving, energy storage, and vehicle pipeline developments were central to investor sentiment. Tesla’s near-term outlook remains heavily tied to operating efficiency improvements and capital discipline as the EV market normalizes after a high-growth phase.
Analyst Takeaway (Zaye Capital Markets)
Yesterday’s results highlighted diverging themes: IBM and Thermo Fisher demonstrated strong structural momentum driven by technology and healthcare demand, while AT&T delivered consistent execution in a highly competitive telecom landscape. Tesla remains a volatility-sensitive name, reflecting shifting demand and innovation cycles. We encourage investors to focus on margin trends, guidance revisions, and capital efficiency metrics across these sectors to assess resilience amid moderating macro conditions.
Earnings Preview – Today (23 Oct 2025)
- T-Mobile US, Inc. (TMUS)
T-Mobile is expected to post EPS around US $2.40 on revenue of US $21.88 billion. Analysts are closely watching post-paid net additions, 5G average revenue per user, and churn rates as key indicators of network strength. With the U.S. wireless market approaching maturity, cost synergies from past integrations and pricing discipline will be vital for sustaining growth momentum.
- Blackstone Inc. (BX)
Blackstone’s expected Q3 EPS stands at US $1.24 with revenue near US $3.20 billion. The focus for investors remains on fundraising activity, fee-earning AUM expansion, and exit volumes within private equity and real estate portfolios. Given current market volatility, sentiment toward private credit and alternative assets will play a pivotal role in shaping forward guidance.
- Intel Corporation (INTC)
Intel is anticipated to report roughly break-even EPS (~US $0.00) on revenue of US $13.10 billion. Markets will dissect commentary around the company’s foundry progress, AI infrastructure demand, and cost-reduction plans. As semiconductor spending normalizes, execution on advanced node transitions and capital allocation efficiency will remain central to investor confidence.
- Union Pacific Corporation (UNP)
Union Pacific is expected to announce EPS of US $2.99 and revenue of US $6.25 billion. Key areas of focus include freight volume trends, intermodal traffic, and operating ratio improvement—an essential profitability metric. The report will also serve as an important gauge of industrial activity and transportation demand across the broader U.S. economy.
- Honeywell International Inc. (HON)
Honeywell’s Q3 expectations point to EPS of US $2.56 and revenue near US $10.15 billion. Investors are watching the aerospace aftermarket, building automation, and advanced materials segments for signals of cyclical stabilization. Management’s commentary on capex trends and demand outlook will help assess industrial recovery strength heading into year-end.
Analyst Takeaway (Zaye Capital Markets)
Today’s earnings lineup spans critical sectors—telecom, finance, semiconductors, transport, and industrials—offering valuable cross-sector insight into the economy’s momentum. We recommend monitoring forward guidance, cost control, and capital deployment strategies as key indicators of resilience. With macro uncertainty persisting, firms that demonstrate consistent execution and margin discipline are likely to outperform as market volatility continues to test investor conviction.
Stock Market Update – Thurs, 23 Oct 2025
U.S. stock markets opened softer as sentiment remains guarded with valuation extension, muddled earnings news, and lingering macroeconomic woes. Though large-cap leaders such as the S&P 500 and Nasdaq are under pressure, both the Dow Jones and Russell 2000 are faring slightly better as capital selectively shifts towards defensives, industrials, as well as lower-beta issues. Zaye Capital Markets is looking for a wider increase in participation prior to calling for a sustained push towards quarter-end.
Stock Prices
The Economic Indicators, as well as Geopolitical
The existing market sentiment reveals more anxiety over guidance sensitivity, valuation compression, as well as a tightening macro environment. Local service data from the Philadelphia Fed as well as cues of a gradual rate in hires continue to send alerts for investors. Geopolitically, fresh US trade friction leads headlines, with global resource alignment strategies further imposing a tilt towards a defensive positioning. With 10-year Treasury yields holding levels near cycle highs, risk premiums for equities remain under close watch.
Latest Stocks Results
Markets are undergoing a harsh correction in speculatory growth stocks, with numerous high-beta names recording sharp correction from recent peaks.
Largest corrections are:
- ONDS – −42%
- $QBTS – −40
- RGTI – −38
- OKLO – −37
- IONQ – −35%
- ALAB – −34%
- RR – −33%
- ASTS – −32
- $NBIS – −31
- QN – −30%
- IREN – −30%
- HIMS — -26%
- $CIFR – −26%
- $BMNR – −25
- HOOD – −21%
This sudden repricing reflects lower investor tolerance for loss-making or long-duration business models owing to a rising cost of funds and macro uncertainty. Money is moving out of speculative tech and into more stable earnings, stronger balance sheets, and dividend-supported areas.
The Magnificent Seven and the S&P 500

The “Magnificent Seven” — Apple, Microsoft, Nvidia, Amazon, Meta, Alphabet, and Tesla — are again under pressure this week, dropping collectively over 18% from recent peaks. Tesla and Meta are leaders of the selloff, egged on by margin compression, revenue sensitivities, as well as a levelling of AI exuberance. This group that had been responsible for an outsize block of index-level advances now weighs on the S&P 500 and Nasdaq Composite, stoking fears about concentrated leadership as well as dependency on earnings. Unless these names bounce — or a sector broadening ensues — upside for the market might stay range-bound as November approaches.
Major Index Performance as at Thursday, 23 Oct 2025
- S&P 500: It was trading at 6,627.51, having lost 0.5%. It had narrow leadership.
- Nasdaq Composite: Down at 22,437.12, -0.7% as tech mega-cap drags on.
- Dow Jones Industrial Average: Trading at 46,089.07, up 0.1%, supported by strength in industrials and defensives.
- Russell 2000: Trading at 2,429.88, unchanged, a reflection of general strength in rate.
We still believe that it remains a “selective risk-on” world. Vulnerability in mega-cap tech, speculative pullbacks, and interest-rate sensitivities are restructuring equity leadership. Investors must prioritize high-quality names with strong free cash flows, pricing power, and sector tails, but still need to watch breadth measures, revisions in earnings estimates, and rate volatility for confirmation of a more sustainable recovery in equities.
Gold Price – Thursday, 23rd Oct 2025
Gold now trades around USD $4,054.69 per troy ounce, representing sustained strength in the precious metal as investors react to a rapidly volatile geopolitical and macroeconomic climate. At Zaye Capital Markets, we observe that gold’s high prices represent more than just a manifestation of classic inflation hedging, but renewed expression as a geopolitical risk proxy. It was just this past week that news from the administration underscored this trend: new Russia sanctions, no deadline for an end to conflict between Russia and Ukraine, reports of tense diplomatic meetings with both Moscow and Beijing, once again stoked safe-haven demand. Risks for expansive export control over China—especially over software-bound technologies—the escalation of trade tensions, as well as uncertainty over U.S. participation in key global flashpoints, all conspired to create an environment in which risk aversion builds. Furthermore, the administration’s report that India might pull out of its oil purchases from Russia and reduce tariff barriers as a condition of a possible US-India trade agreement, speaks to a changing global supply picture—specifically over oil as well as over agricultural products—that often fuels inflation volatility, with supportive implications for gold. In tandem, a US national debt that now exceeds $38 trillion stokes, for the long term, concerns over fiscal sustainability, as well as real interest rate compression, both of which are classically bullish for precious metals. The macroeconomic perspective sees yesterday’s disappointing read on regional business activity, coupled with today’s expected Existing Home Sales, further fueling market concern about the rate of U.S. economic slowing. Coming as policymakers indicate inflation may start to decline in coming months, but lacking confidence that growth will bounce back accordingly, this saps sentiment further, with gold finding fresh demand from asset allocators that value safety during turmoil. With falling energy costs a clear risk mitigator that could temper CPI in the near term, but persistent weakness across housing, manufacturing, and services triggering talk of possible policy easing—a context in which gold more often holds its own, investor sentiment having changed from sole concern about inflation fears to more general fears about policy errors, as well as global fragmentation, gold finds continued demand from asset allocators that prioritize safety during turmoil. Unless there is a substantive compromise on trade, sanctions, or geopolitical risk, gold’s high levels will likely remain supported, with any near-term setbacks being viewed as consolidation, not reversal.
Oil Price – Thursday, 23rd Oct 2025
Crude oil prices remain pressured, with Brent trading just north of USD $62 a barrel, indicating a wider move towards surplus expectations and demand concerns worldwide. Latest estimates indicate global supply will grow by over 3 million barrels per day (bpd) in 2025, a further 2.4 million bpd in 2026, as demand growth tapers out at a measly 700,000 bpd for both years. This mismatch is building a bearish supply overhang, pushing oil to its lowest levels in over five months. Nevertheless, geopolitical risk remains a floor under prices. Continued concerns over Russia export capacity, Iranian production capping, as well as shipping route weaknesses, maintain a level of risk premium. But with yesterday’s bleak US manufacturing as well as regional business conditions data indicating further decline in industrial as well as transport demand, key in diesel-heavy users, sentiment shift was compounded further by a sudden dip in US oil refining activity as well as swelling US gasoline inventories, which indicate weakening winter-seasonal domestic fuel consumption. Donald Trump’s most recent comments are also affecting energy market sentiment. Announcements of fresh Russia sanctions, slowness in diplomatic solutions over Ukraine, as well as a hardening stance on China—with the administration considering widespread export restrictions on software—have escalated geopolitical risk and injected volatility in commodity arenas. Such news stokes the threat of supply disruptions, notably if allies also aim at Russian flows or if China responds with commodity restrictions. At the same time, Trump’s statements on possible Indian trade agreements, including stage-wise cuts in purchases of Russian oil, may reroute flows further and create disruptions in Asian market balance. Though such changes might consolidate regional supply, the global macro background—emphasized with muted economics data as home sales release today—still signals moderating demand. Should consumer retrenchment corroborate outside housing data, oil prices may confront further risk to its downside. At Zaye Capital Markets, we think oil resides between structural over-supply as well as episodic geopolitical outbursts. Until demand fundamentals firm or supply shocks occur more definitively, crude will most likely stay range-bound but with a bearish bias.
Bitcoin Prices – Thursday, 23 Oct 2025
Bitcoin currently sits at about USD $108,282, down mildly on the day, with intraday volatility still high despite a relatively peaceful macro environment. This price loss comes after a wider slide across the crypto sphere, which remains bedeviled by a combination of institutional reshuffling, regulatory ambiguity, and macro-agenda sentiment. Options flow analysis shows over $214.7 million in this week’s crypto-related ETF flows, which implies that institutions are hard at work managing exposure as implied volatility remains high. Beneath the surface calm, volatility at this high level reflects existing uncertainty in both global economies and crypto policy arenas. Donald Trump’s most recent geopolitical and trade-related pronouncements added fuel to this mixture. His remarks about renewed Russia sanctions, the open-ended nature of the Ukraine war, export controls aimed at China, and fluidizing U.S.–India trade alignments are generating a more-risky environment that often sees flows move towards decentralized assets such as Bitcoin. Concomitantly, this sort of assertive foreign policy stance increases the risk of retaliatory regulation of digital infrastructures, a move that could increase scrutiny of crypto platforms, miners, and trading houses. Dual effect? Bitcoin benefits from distrust of policy as well as global instability, but remains susceptible to headline-driven corrections. Wednesday’s disappointing economic news—namely, the Philadelphia Fed’s regional non-manufacturing survey and housing sentiment decline—highlighted a decelerating economy that’s cooled risk appetite. In conventional markets, that would bring a dovish policy pivot expectations game; in cryptocurrencies, it builds countervailing pressures. On the one hand, weaker growth and rate moderation expectations work in Bitcoin’s favor via the monetary easing channel. On the other, sluggish consumption and liquidity tightening hold back widespread investor participation and perhaps delimit momentum for near-term crypto adoption. All eyes now turn to today’s Existing Home Sales reading, which will no doubt confirm a consumer weakness narrative if true. In that event, Bitcoin will get a breather from a weaker dollar and a potential policy pivot, but institutional risk-management behavior, as well as regulatory tone, will remain crucial swing factors. Technically, in Zaye Capital Markets’ estimation, Bitcoin’s current range remains tenuous on its feet—any sustained policy misstep or aggressive enforcement move may either stoke a breakout or prolong a pullback, depending upon how it’s perceived by market participants as a juncture between risk-off conditions as well as long-term decentralization tailwinds.
Eth Prices – Thursday, 23 Oct 2025
Ethereum (ETH) trades at approximately USD $3,800 after maintaining steady ground amid brief intraday selling spurred by changing ETF flows as well as whale selling. Price action comes after a week of increased volatility, during which ETH was pressured by diminishing spot ETF demand yet benefited via targeted vehicles from institutions. Most prominently, Fidelity’s Ethereum ETF saw a $59.1 million influx on October 22, giving a hint that there remain institutional buyers who view ETH as a core holding in spite of macro volatility. This comes a few days after Statista reported that Ethereum spot ETFs saw three days of consecutive net redemptions amounting to about $145.7 million by October 20, indicative of a market sentiment mismatch between day-traders and long-term holders. Further muddying the waters, earlier this month, on-chain metrics indicated whales stashing over 800,000 ETH in preparation for larger ETF-related upside—just to now witness a few of the same holders taking profits. Such seesawing indicates Ethereum remains in a consolidation phase, with direction conviction set to rely on general risk sentiment as well as upcoming regulatory news. In Zaye Capital Markets’ view, this period represents a trial for ETH’s durability in the face of sector-specific volatility and macro softness. Yesterday’s regional business sentiment decline, coupled with emerging weakness in manufacturing, has muted risk appetite across asset classes. Crypto, given its hypersensitivity to liquidity cycles, is no exception. Though lower inflation and possible Fed easing could represent a long-term tailwind for ETH, near-term flows are more a sign of equivocation, least of which as ETF investors reposition exposure and as macro traders adopt defensive stands. Profits taken by whales, selective ETF rebalancing, as well as pockets of institutional inflows, point to a maturing ecosystem, albeit a still nascent one seeking a clear narrative beyond that of speculative rotation. Were today’s Existing Home Sales print exhibit a larger slowdown in consumer demand, it might continue to pressure ETH by reducing appetite for high-beta names. All that may change, meanwhile, if a stabilizing greenback, coupled with greater clarity on staking-related ETH products via regulations, might point to upside surprise in the weeks to come. For ETH, its ~$3,800 level for now stands as a psychological turn, with volatility cornered to continue at least as macro or regulatory catalysts stand a chance to inject directional clarity.
