Where Are Markets Today?
U.S. equity futures weakened today, as the Dow Jones Industrial Average futures fell by 68 points, down 0.15% (0.15%), as did the S&P 500 and Nasdaq 100 futures, falling 0.2% respectively. This followed the previous rise, as the S&P 500 climbed 0.32%, the Nasdaq Composite rose by 0.26%, and the Dow climbed 231.49 points, up 0.53%. The initial rise was dampened by the concerns of the statement of President Trump concerning Federal Reserve Chair Jerome Powell. Trump criticized Powell, referring to him as a “terrible chair” and insinuating the fact that Powell faced investigation, casting doubt upon the leadership of the Fed as well as future policy decisions. While denied later by Trump, downplaying the fact that he would replace Powell, the uncertainty has created caution among investors, placing U.S. futures under pressure.
While the European markets have come out higher, they are offering a more optimistic tone compared to the U.S. equivalents. The leading European stock-tracking index, the Stoxx Europe 600, has come out higher following improved visions of the economy by the investors due to the string of optimistic earnings announcements. Furthermore, the latest trade talk events, especially the possible defusing of the risk of trade war between the U.S. and China, are supporting the European shares. Investors are equally anticipating soon-to-come announcements, including the reading of inflation as well as the polls of the consumer sentiment, through which the entire health of the economy will be shed more light. The relatively strong European showing contrasts the cautionary tone in the U.S. as the European traders keep hopes up of the global economy’s health. These U.S./European hybrid futures result from only two factors. First, uncertainty of the Federal Reserve leadership, fueled by Trump’s critique, brings indecision to the U.S. market. To the degree the Fed leadership of the broader market’s monetary policy remains of leading significance, changes can be permanent ones. Second, European markets are buoyed by European hopes of ebbing of the political tension, especially the trade negotiating and favorable econ reporting, to counter the anxiety of the kind surrounding inflation as frequently as they do global supply chains. For that reason, European markets are higher, opening, while U.S. futures labor through rising political uncertainty.
Major Index Performance through July 17, 2025
- Nasdaq Composite: Closed at 13,784.50, -0.2% after closing a six-day
- S&P 500: Finished the day at 5,916.93, 0.3% higher for the day.
- Dow Jones Industrial Average: increased 0.7% to 38,650.00, the first increase in three days.
- Russell 2000: Closed at 2,092.10, a slight gain but 5.7% lower year to date
The Mag 7 and the S&P 500

S&P 500 has remained resilient, supported by the top tech shares, more popularly the “Magnificent Seven.” They comprise shares of Nvidia, Apple, and Microsoft, helped by gains in the sector of artificial intelligence, along with solid earnings reports.
But alongside the progress being made, meanwhile, the market overall is sending signals of problema. Retail buyers’ interest, much of which stood behind past comebacks, is fading. In the absence of the sector’s comeback, analysts say, it would be difficult to sustain the pace.
Drivers of the Market Movement – Thursday, July 17, 2025
Markets are drifting through a slew of economic data, political events, and political nervousness, and these are influencing investor sentiment in U.S. and European stock market futures today. They are the dominant influencers of the market’s movements:
- Trump’s Fed Criticism and Monetary Policy Uncertainty
President Trump’s recent remarks on Federal Reserve Chairman Jerome Powell added some uncertainty to the market. Trump referred to Powell as a “terrible chair” and seemed to imply that Powell is “under investigation,” sparking fears of possible U.S. monetary policy measures. The news has spurred speculation regarding the likelihood of the President’s quick temper at the Fed leading to leadership changes or policy shifts. In the backdrop of persistent inflationary pressures, even a break with the monetary policy status quo can lead to volatility, especially in interest-rate sensitive parts of the economy such as the tech sector and real estate. The market is brushing aside the comments because the comments gave rise to doubts regarding investors’ faith in the independence of the Fed.
- Geopolitical Tensions and Trade Policy Challenges
Trump comments regarding trade and tariffs, specifically the possible deal with India and the previous threat to impose tariffs on European imports, remain a dampener to market mood. Global trade volatilities, combined with the persistent U.S.-China trade hostilities, are inducing market volatility. Investors are afraid that these unresolved trade issues can impact global supply chains and inflation, resulting in increased prices of goods and services. Markets are therefore taking a cautious approach, with a move to defensive segments and a selling of cyclicals, especially the ones dependent on global trade and supply chain stability.
- Future Economic Statistics and Their Consequences
Friday’s macroeconomic readings such as Average Earnings Index, Core Retail Sales, and Unemployment Claims will play an important role in forming the market sentiment. The news of better-than-expected earnings and retail sales would be positive to investor sentiment, whereas the risk of weaker-than-expected reading can trigger concerns of economic slow-down. Markets are most responsive to reading inflation, as even the hint of persistent price rises can trigger concerns of tighter monetary policy. This macroeconomic reading will induce short-term volatility as investors are searching for signals on the strength or weakness of the economy as these influence sentiment among U.S. as well as European market participants.
In short, the market gets hit by Trump’s attack on the Fed, the latest geopolitical issues, and macroeconomic data today. Investors are nervous as they see the major econ reports, especially the areas of inflation and consumption expectations, as a lead indicator of the future path of the monetary policy along the pace of the economy.
DIGESTING ECONOMIC DATA:
Trump Twitter and Its Implications
President Trump‘s recent tirades against Federal Reserve Chairman Jerome Powell reignited fresh controversy and brought fresh uncertainty to financial markets. Trump publicly criticized Powell, labeling him a “terrible chair” and saying that Powell is doing a “terrible job.” The repeated tirades have centered on the leadership and independence of the Fed, a topic with a penchant for market-volatility. The President further said that Powell is “under investigation,” but said that the removal of Powell from office is “highly unlikely.” This language appears to be the extension of displeasure at the Fed’s policies, specifically the rate hikes and the way it has handled inflation.
This sentence has two-edged meaning. On the one hand, these words can fuel market anxieties for direction of U.S. monetary policy in the future. If Trump’s criticism were followed by further pressure on Powell, then it would result in policy shifts, and implications for decisions regarding level of interest rates and liquidity. More aggressive Fed policy will harm high-growth stocks and the world of tech, which are vulnerable to rising interest rates. On the negative, the “investigation” remark creates a small amount of uncertainty regarding the future of Powell and can render investors, who need predictable, certain Fed leadership, uncomfortable. In addition, Trump’s statement, and overall fiscal policy strategy, can impact investor sentiment towards the sorts of assets of crypto and gold. It can precipitate a destabilizing Fed atmosphere, more so during the age of macroeconomic doubt, that can move investors towards the safe-haven assets of Bitcoin, or even gold, traditionally acting as insurance against the peril of inflation and fiscal impropriety. General U.S. currency sentiment can be altered as well if more people doubt the independence of the central bank.
In looking beyond the Fed, it seems that Trump’s remarks regarding other contemporary issues of geopolitics, such as the potential trade deal with India, would see him take yet a more protectionist stance if he believes the current trade deals are more favorable for the U.S. economy. This would likely see global trade patterns changed, something that would impact global market segments that depend upon global supply chains. Finally, Trump’s remarks create significant uncertainty regarding U.S. domestic policy as well as the global economy as a whole, something that must keep the market more attuned to the tone of Trump’s remarks in the near term.
How News Affects Inflation And Market
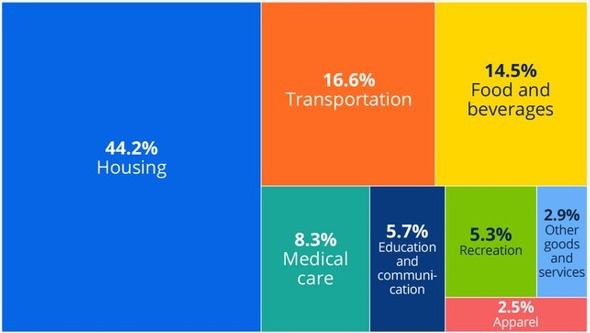
This U.S. Bureau of Labor Statistics February 2025 Consumer Price Index (CPI-U) report goods and services shine light on the rising influence of cost of housing and transport on inflation. 44.2% for housing and 16.6% for transport lead the way to be the biggest drivers of increasing consumer spending. Taxes and insurance are not factored into calculating the CPI, a big cost to families, particularly families of college-age students whose tuition skyrocketed. This education cost at the rate of $10,560 per year is a problem brewing, particularly given the goods and services of inflationary pressures still present.
Trade policy, especially the 2025 President Trump tariffs, has added to the problem of inflation. While wholesale inflation declined by 2.3% as reported, the actual effect of tariffs in goods prices remains masked. The tariffs have increased the cost of the imported goods, and while the CPI accurately captures the service-intensive spending like that of house, it does not account for the entire rise of prices of physical goods. The gap of the CPI tracking has therefore postponed the ability of the CPI to capture the global changes in the economy, which are affecting the market forces, especially the consumer industries based upon the imported goods.
Due to such varied history of the economy, the underestimation of stocks related to the transport and real estate sector becomes evident. The experts should pay special attention to these industries, as the impact of the tariffs and the increased cost of the real estate hold the potential of strategic investment. If the future adjustments of the economy should be forecasted after the recalculation of the market situation and the customers’ tendency, special attention should be paid to the products and services not covered by the full CPI.
Industrial Production And Capacity Utilization
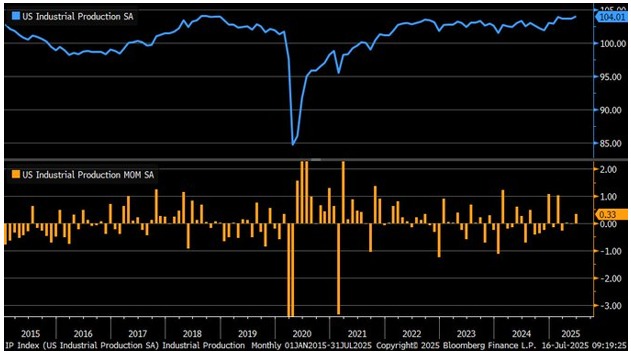
latest U.S. industrial output rate in June of 2025, according to Zaye Capital Markets, is 0.3% growth, which is above forecasted 0.1% growth. Manufacturing was also better, experiencing 0.1% growth, after the last month’s -0.2% decrease. All of the better growth despite it, however, industrial output remains less than capacity since Federal Reserve estimates capacity utilization at 77.6%. Low capacity utilization as a sign of current slack in the economy means, in essence, that while growth is only now being achieved, it still remains to be restrained by unused capacities. Capacity utilization is something that analysts need to watch for as signs of future expansion of levels of production since sustainable improvement would be quoted as a sign of better economic recovery in the long-term.
The subdued growth in manufacturing can be explained by seasonally recurring elements like labor shortages, high raw material costs, and supply chain bottlenecks, which impact the productivity of production. The latest Producer Price Index (PPI) numbers suggest stale wholesale price inflation growth, as the cost of goods increased by 0.3% and indicates the possibility that the tariffs instituted by President Trump would not have the inflationary effect projected. Though tariffs saw individual increases in the price of individual goods, the overall impact of tariffs on inflation has had a relatively tempered effect. This feeds the dovish stance of monetary policy by the Federal Reserve, which should maintain the same data-dependent position. The PPI, as well as the manufacturing numbers, must be closely tracked by analysts in order to assess overall inflation levels as much as the impact of tariffs on individual industries, namely goods production as well as manufacturing.
Capex Recovery And Tariff Effect
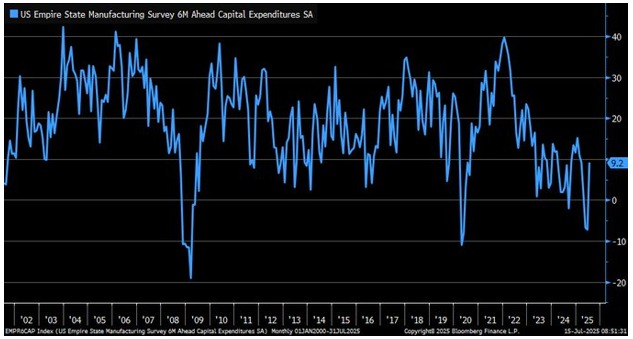
This latest rise in the capex portion of the NY Empire State Manufacturing Index, from -16 in June to 5.50 points in July 2025, indicates the manufacturing mood may be on the mend. The recovery follows a steep drop in the immediate wake of the imposition of the “Liberation Day” tariffs on 2 April 2025, imposing high tariffs as the 1930s model Smoot-Hawley Tariff Act. Although the recovery has followed, the rise in the capex might be temporary as a result of the rise in tariffs, which should cause the amount of $600 billion annually, having raised questions regarding the sustainability of the tariff and the long-run impact it will have on the economy. Without explicit economic modeling to substantiate the figure, historical data indicates tariffs can cut trade volumes, with negative GDP consequences, which challenge the sustainability of tariff-based growth.
Appeal to the analogy of the 1930s and the Smoot-Hawley Act, used often as the example of how growing protectionism deepened the Great Depression by reducing trade across the world, suggests the risk of such protectionism. In a 2019 National Bureau of Economic Research study, tariffs were shown to always result in trade and GDP reduction as the industries were facing higher input costs and reduced global market access. The same source of concerns is from the 2023 Journal of International Economics, which reports that the tariff retaliation had hurt targeted industries, especially, on average, contraction of 1.4% of the industry’s GDP. History of the difficulty of balancing protection of the U.S.’ industries by tariffs and the more general threat of reducing trade shows the political economy of the tension. With manufacturing confidence sharpened by rising capex and modest NY Empire State Index recovery, analysts need to be ever so cautious about the longer-term effects of these tariffs. Tariff-driven policy initiatives, originally designed to benefit U.S. sectors such as steel and aluminum, have unintended consequences, such as aggravating supply chain shortages. Analysts need to be guarded with respect to the wider implications at the level of the GDP and manufacturing output, in the coming months, as these trade restrictions will continue to apply the brake on global trade flow and overall economic growth, primarily at the sector levels most vulnerable to increasing input prices and supply chain squeezes.
Oer And Housing Market Trends
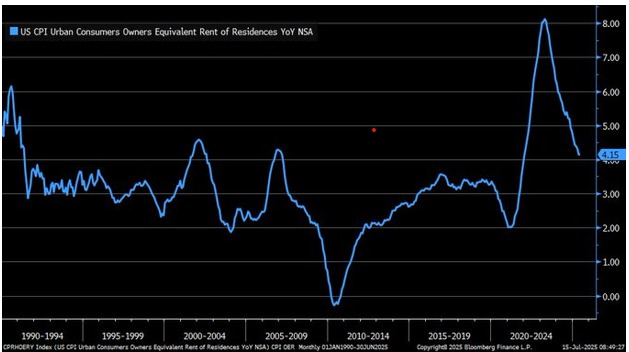
The Owner’s Equivalent Rent (OER) of the U.S. Consumer Price Index encompasses a very large percentage of the expense of homes, the Bureau of Labor Statistics’ estimate finds. The gage, representative of the cost to owners of renting out their own homes, has fluctuated wildly since the year 1990, skyrocketing after 2020 and falling slightly more recently. The year-over-year OER had increased to 4.15% as of June of 2025, reflecting the shelter price continues to underpin inflation even as the overall 2025 prediction of a 2.7% increase in the CPI, as forecasted, stands. With the cost of clothing increasing, in part spurred by tariffs, OER remains an inflation driver, reflecting the inflation forces in the dwelling category remain high, contra speculation of the slowdown to inflation across the board.
Federal Reserve researches (2023) indicate OER lags 6-12 months behind recent trends of the real home market. The lag of the OER reflects the fact that OER reflects rent values in the overall larger home market, rather than the recent home price movement trend. Through June of 2025, the OER stability would be more likely registering more restrictive 2024 home supply reported by Redfin. Such more restrictive home supply would be more likely constraining available stock to rent and lengthening the high rent and therefore the OER rise. The distance between the recent home market trends and the CPI’s components of the home sector reflects the challenge of implementing the OER measure as a recent gauge of the inflationary pressures. Comparing OER to the state of the housing market makes it evident that the application of OER to the CPI is not always representative of the real-time current activity of the housing market. Since rising rents tend to lag home prices by months, policymakers using CPI data to determine inflation levels may be oblivious to the prevailing state of the housing market. The maneuver of moving house supply, having the effect of the delayed realization on the rent price, presents a critical window through which to look at inflation, and the cost of shelters can continue to propel ends-based inflationary pressures well beyond the short-term immediate CPI readings. Analysts must closely monitor the state of the housing market as well as OER in order to more accurately ascertain long-term inflation trends.
Public Acceptance and Adoption of AI
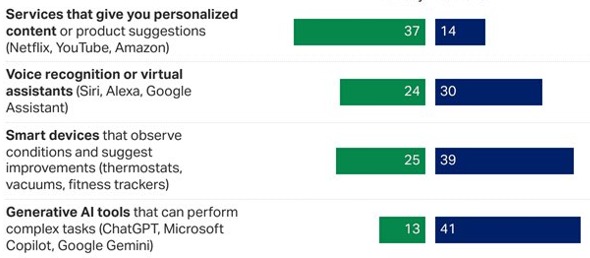
A new Gallup survey indicates the results of only 13% of U.S. adults in support of using generative AI platforms such as ChatGPT on a daily basis compared to a large gap of 37% supporting use of customizable content services such as Netflix. This reveals the generative AI adoption as slower than anticipated, presumably due to perceived complexity and perceived lack of immediate necessity. It should not have been unexpected given that 40% of U.S. adults indicated concern with AI’s increasing presence in everyday life in a 2023 Pew Research survey. The public, despite fierce investment by big tech firms such as Microsoft, investing as much as $13 billion in the year 2023 in OpenAI, is afraid of the widespread use of generative AI platforms.
Though slower for individuals, a June 2025 Business Insider column cites AI adoption by executives and leaders as twice as rapid, compared to individual contributors. Top-down adoption therefore means while executive leaders embrace AI in their organization relatively rapidly, the technology hasn’t yet reached the masses at a level that’s attractive to the masses. This means, even as AI is a big business driver of innovation, the full potential of mainstream, everyday use is in its early days of adoption. Demand for passive AI applications such as smart devices, used 25% of the time daily over more interactive ones such as ChatGPT is evidence of a cultural shift to less cumbersome, more intuitive technology. The shift can be linked to evidence in a 2024 MIT study where only 29% of US adults reported they felt competent at utilizing advanced AI tools. The report indicates that social competence at understanding and utilizing advanced AI is a critical barrier to adoption, indicating that AI adoption is lower than first estimated. Researchers and analysts must track future AI literacy and education trends as major drivers in getting the population at large to utilize more generative AI tools.
Global Internet Access And Economic Impact
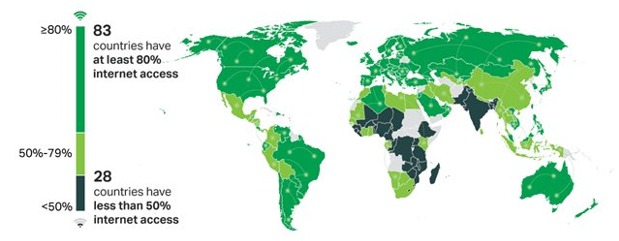
The 2024 Gallup report reveals the colossal global digital divide, where 28 nations have less than 50% internet penetration and 83 had 80% plus internet access. This extreme contrast reveals the fact that it represents the result of economic inequality resulting in uneven global connectivity. That 2011 Gallup data revealed, indicating that only 32% of the residences had global internet access, indicates how extensive the gap remains even after the advent of technologies. With increasingly more areas becoming networked, it is having prospects as well as problems, especially for the emerging economies, as they are having issues in accessing the required infrastructure in order for the far-reaching internet access.
A more detailed inspection of the Indian internet reach, as the survey discloses, makes the data less credible. Although Gallup indicates quite poor internet reach, WhatsApp user counts of WANotifier of 2025 indicate a whopping 853.8 million Indians, setting mobile internet penetration at a possible higher rate than estimated by Gallup. Widespread take-up of affordable data plans in rapidly digitizing geographies like India can be the reason for the gap, indicating the vulnerability of surveys based on wider measures of reach compared to the use of mobile internet, which becomes more relevant in the absence of areas of minimum fixed line presence. This increase in internet availability as indicated in the map is accompanied by the rapid expansion of market segments like the Internet of Things (IoT) and the networking of medical devices. The market segments are expected to hit $37.41 billion in 2031 (QY Research, 2025), and the market segments potentially might be able to leverage higher internet availability, particularly amongst untapped market segments. These market segments, however, with increased infrastructure, potentially can transition as drivers of the economy, under the adoption of utilization of IoT technologies as well as networked medical devices. Experts need to watch these trends closely, since additional connectivity globally could lead to a reshuffling of the global economy, particularly in future digital growth markets in emerging economies.
Upcoming Economic Events
With another big week ahead for market players, some of the week’s most significant of the week’s economic data is released, allowing us to achieve new insights of employment trends, retail trends, and emerging trends in inflation. Markets will be waiting keenly the average earnings, the retail sales, the unemployment benefit data, and whatever Federal Reserve members say. The list of what to look out for from these events, and how the market should respond to the outcome, is as follows:
Average Earnings Index 3m/ (m/m)
Average Earnings Index will be the single most important gauge of wage increases, the final inflation driver.
- If the reported number be above the forecasted number, it would be likely to affirm above-consensus wage pressures, fueling British inflation fears. It can increase the risk of a more hawkish Fed, fueling the speculation of rising interest rates.
- If the number be below forecast, it can alleviate the inflation fear and be the indicator of weakening labor market, potentially calling for dovish Fed tone and risk asset rally.
Claimant Count Change
The Claimant Count Change gives us a measure of the health of the jobs market, or more specifically unemployment benefit claims.
- Below forecast would be taken as the jobs market holding up, a good reading for consumer spending and further hopes for the economy. The impact would be a rally in risk assets as sentiment improves among investors.
- If the reading is above forecast, however, as unemployment benefit claims are on the rise, it can be a reading for the weakness of the underlying economy. The risk-off would be the prevailing one as investors are turning towards defensive assets, bonds, and defensive stocks, perhaps.
Core Retail Sales monthly/monthly
Core Retail Sales is a very important gauge of consumer household spending, following variable items such as auto’s.
- If it rises higher than expected, it would be a firmer reading of consumers’ demand, which would increase the level of inflation expectations. This would cause bond yields to rise and the currency of the U.S. to strengthen, as the market expects a more active Fed.
- If retail sales, instead, are weak, it would be bad for the pace of the recovery, and would provoke selling of shares and flight-to-safety in bonds.
Retail Sales m/m
Like Core Retail Sales, the Retail Sales reading overall reflects the propensity of the consumer to spend.
- An above-expectation figure would be a reflection of continued economic growth that pushes risk assets up and would stir up fears of inflation that would induce a rise in the Fed’s hawkish bias.
- A lower-than-expected retail sales report falling short of the forecast would be an indication of a slowing consumer, which would induce the equity market to correct as the investors rebalance the growth outlook.
Unemployment Claims
Being a key barometer of the wellbeing of the labor market, unemployment claims will be closely watched.
- A better-than-expected reading would reflect more vigor in the labor market, which would reinforce investor belief, sending equities higher again.
- Conversely, a stunning spike in claims can be a sign of trouble in the economy, and dismal hopes of a declining economy would follow, with higher demand for risk-free investments such as government bonds and defensive sectors.
FOMC Member Waller Talks
These Federal Reserve speeches typically tend to be of great importance in influencing the market consensus.
- If Waller speaks of hawkish policy, thereby recommending the sustained efforts towards halting the inflation surge by increasing the rates, it would result in the downside pressure in the stock markets, while the U.S. currency would experience a strength boost and bond yields would increase.
- But if he introduces dovish policy or wait-and-see approach, it would result in the rally of the risk assets, of which theequities would be the gainer because of the expectation of more accommodative money stance.
When these factors change, the investors and analysts need to consider how they correlate to the overall trends of the economy, namely inflation, jobs, and consumer spending. All of these metrics will give valuable indications of future economic growth, and can influence Fed policy and market tone in the next several weeks.
Stock Market Performance – Thursday, July 17, 2025
Markets are back up from the lows of the year, yet major losses prevail through major leading indices. The broad-based rally remains sporadic, as wholesale imbalances continue to prevail between top leaders and the overall market. Here’s comprehensive coverage of the performances of major indices:
S&P 500: Remaining Robust Amid Ongoing Volatility
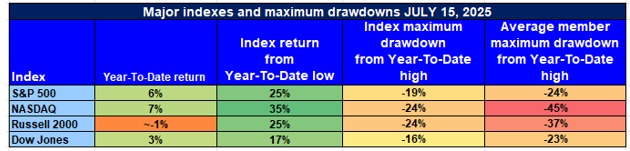
S&P 500: +6% YTD | +25% from 4/8/25 low | -19% from YTD peak | Avg. member: -24%
S&P 500 recovered nicely from the lows of April, higher by 25% since then, but still lower by 19% than at the YTD high. The average constituent down by 24% shows the rally not being as broad-based, as gigantic weakness in the small-caps and a selective sector weakness, e.g., the real estate sector and the consumer staples sector, exist.
NASDAQ: Technology Remains Ahead Despite Industry Woes
NASDAQ: +7% YTD | +35% from 4/8/25 low | -24% from YTD peak | Avg. member: -45%
While the NASDAQ has registered a definite 35% recovery from the low of the last month’s low due to the big tech stock strong rally, the index is still off 24% from the year high and the average member off 45%. It reflects the relentless pressure on the growth shares and the risk-related elements despite the broad-based strong rally of the AI-related and tech-heavily weighted stocks like Nvidia.
Russell 2000: Small-Cap Troubles Persist
Russell 2000: +1% YTD | +28% from 4/8/25 low | -24% from YTD high | Avg. member: -37%. Russell 2000 trails the larger siblings by 9% year-to-date after rebounding 28% from the bottoms of the bottoms of the bottoms in the bottoms of April. Small-caps as a sector experienced systemic selloff, declining 24% high-to-low, while the average members fell 37% as the investors continued their worries of the lower grades and more risky stocks of the small-cap universe.
Dow Jones: Consistent but Vulnerable to Volatility
Dow Jones: +3% YTD | +18% since 4/8/25 low | -16% to YTD high | Avg. member: -23 The Dow has fared better than the other major indexes, closing down a relatively tame 3% year to date. The 18% rally back from lows is a sign of overall health, supplemented by defensive names and industrials, yet down 16% from the year-to-date high, and the average member down 23%, a indication even the Dow has not escaped the volatilities of the broader market.
In the broader perspective, although U.S. shares are recovering from year-open bottoms, the overall equality of upsurge does not exist, as the Nasdaq, the tech-heavy gauge, takes the lead, followed by the small-caps and the broader industries. Investors need to keep their eyes fixed upon the results of earnings, the readings of inflation, and the entire macroeconomic factors, which impact the attitude of these diversified indices.
The Strongest Sector in All These Indices
Industrials Continues Lead Sector Performance As Broader Market Rotation Sets In
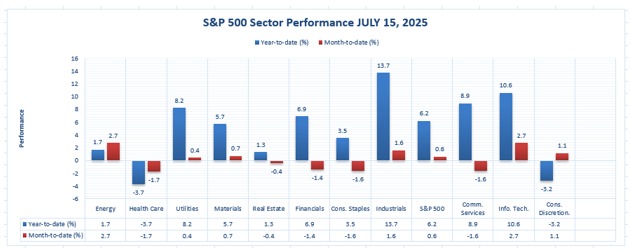
With the latest figures, Industrials continues to be the year-to-date top-performing sector of the S&P 500 since it managed a 13.7% return. The sector beat the entire market by a large margin, as the whole market only managed a 6.2% YTD rise. Second to the sector of Industrials, Information Technology sector held the line, delivering a 10.6% return largely due to the strong performance of the semi-conductor and AI shares, and Communication Services sector likewise held the line, delivering 8.9%.
On a month-to-date (MTD) basis, Energy has delivered a strong 2.7% gain, responding to continued demand for oil and gas in the face of macroeconomic headwinds. Information Technology has continued to be strong, posting a 2.7% MTD gain, supported by the likes of Nvidia that helped it outperform. Industrials continues to show growth, up 1.6% MTD, supported by strong demand for infrastructure and logistics-related stocks.
Big Picture: Industrials is also the best-performing sector and boasts the highest year-to-date cumulative return and coordinated monthly gains. The leadership of the sector confirms investors’ belief in the economy’s return, fueled by infrastructure spending as well as sustained industrials demand. Its resilience even during the time of widespread volatility still offers hints of sustained outperformance for the remainder of 2025.
Earnings
Earnings Recap – July 16, 2025
- Johnson & Johnson (JNJ)
We discussed at Zaye Capital Markets Johnson & Johnson surpassing quarter earnings and revenue expectations. The firm earned the quarter EPS of $2.77, surpassing the estimated EPS of $2.68, a 3.29% positive surprise. The quarter’s revenue was at $23.74 billion, as compared to the estimated revenue of $22.85 billion. These robust operating results signify trust in the healthcare sector of the firm and make the company the market leader, thereby likely enabling the investors to be more optimistic and putting the company in a more confident future.
- Bank of America Corporation (BAC)
EPS was provided by Bank of America as $0.89, surpassing the consensus of $0.86 by a slight margin, hence providing the 3.46% earnings surprise. The company’s revenue, at $26.46 billion, missed the forecast of $26.72 billion. The beat of the earnings, but the disappointment in the revenue, as a reflection of the strong margins, can be ascribed to higher interest income or cost discipline. Investors would be keen to see how the bank handles the macro environment today as it continues to sustain the maintenance of the profit margins.
- Morgan Stanley (MS)
Morgan Stanley beat earnings, posting EPS of $2.13, which topped the estimated EPS of $1.98, a 7.47% surprise. Also topping the estimated revenue of $16.07 billion at $16.79 billion, revenue beat estimates. Strong earnings are most likely the result of strong investment banking and wealth management growth, which are the biggest drivers of the Morgan Stanley business model. The earnings report should be positive for positive trends of the stock as investors seek continued growth of these segments.
- Goldman Sachs Group, Inc. (GS)
Goldman Sachs comfortably surpassed expectations by posting EPS of $10.91, which was far higher than the estimate of $9.65, posting a surprise of 13.03%. It also managed to surpass the revenue estimate, posting $14.58 billion versus the estimate of $13.51 billion. The smooth beat would be attributed to the robust deal or trading activity at the investment banking unit, and it should lead to a robust market response. Due to the phenomenal beat, Goldman Sachs will be well-placed to continue benefiting from positive trends in the market.
- Progressive Corporation (PGR)
Progressive Corporation generated EPS of $1.67, a nice surprise, beating consensus of $1.45. The revenue levels were not stated, but the nice EPS beat informs us favorable underwriting, favorable claims ratio, or a combination, and the strong beat informs us the sustained dominance of Progressive in the insurance space, and we take the company’s strong earnings as a good catalyst ahead for the stock.
Earnings Preview – July 17, 2025
- Netflix, Inc. (NFL)
With investors looking to the earnings report in Netflix, meanwhile, in Zaye Capital Markets, we particularly look out for user additions, especially in key foreign markets. The large beat in user adds can generate a much-awaited positive stock reaction. Any mild hint of slower growth, especially from veteran markets, however, can put investors in a jitter over the company’s ability to maintain the high growth rate. It will be a good gauge of future revenues and overall market positioning.
- GE Aerospace (GE)
For GE Aerospace, we would be looking for attention to global commercial air demand. Of special interest would be aircraft orders and backlogs. Investors will be watching for indications of production schedules and possible supply chain issues that impact results. Positive indicators can be optimistic forecasts of growth in aviation demand as well as backlogs increasing, but issues with production, deliveries, or schedules can be a risk.
- Abbott Laboratories (ABT)
Institution investors would be eager to see the company rise in the medical devices as well as diagnostics segments. The inclination of the company to rise further in the competitive healthcare space would be closely monitored. The margin squeeze, issues associated with the launch of the products, etc. would be negative, while positive movements in these segments would re-establish belief in the company’s long-term growth.
- PepsiCo, Inc. (PEP)
PepsiCo’s fourth-quarter earnings report will be used to gauge the demand for the company’s drinks and chips by the end user. Hitting rising input costs and potentially supply issues down the road, investors will be looking for signs of price strength, margin preservation, and volume growth. If PepsiCo puts up a strong report, it would be a good performer, but falling demand at the user level would be a danger to the overall consumer discretionary space.
- Marsh & McLennan Companies, Inc. (MMC)
Marsh & McLennan profits will be dependent upon insurance and risk management. The investors would be keen to see the ability of the corporation to take advantage of the increasing risk solution demand. Whatever mention of global trends either in the economy or premiums growth would be the most likely investor sentiment catalyst, and the outlook would be positive as the stock value would be higher.
- Cintas Corporation (CT)
Cintas would be expected to report solid growth supported by the need for the rental of uniforms and facility services, especially by the healthcare and hotel sectors. Investors would want to witness industry-demand trends and labour cost expense. Both Cintas’ business model and the long-term narrative would be supported by a strong earnings report.
STOCK MARKET SUMMARY – Thursday, 17 July 2025
Markets are facing a multi-dimensional scenario in the form of the latest economic facts, geo-political events, and corporate earnings. Investors are weighing the effect of easing inflation, the possibility of Federal Reserve policy shifts, and the effect of persistent trade tensions.
Stock Prices
Economic Indicators and Geopolitical Developments
New econ data have appeared indicating the inflation rate continues to decelerate, as the Producer Price Index fell, a precursor of wholesale prices stabilizing. Speculation of the Federal Reserve reassessing its monetary policy stance in the coming months has followed.
Geopolitically, the U.S. and China negotiated to lower tariffs by 90 days as part of efforts to ease trade tensions and boost the economy. The action has grown in popularity among market participants, and it enabled rally prices in recent months.
The Mag 7 and the S&P 500
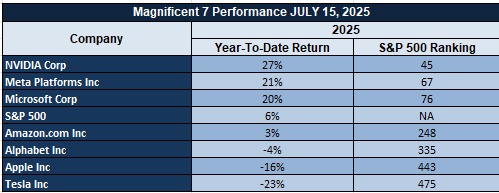
S&P 500 has remained resilient, supported by the top tech shares, more popularly the “Magnificent Seven.” They comprise shares of Nvidia, Apple, and Microsoft, helped by gains in the sector of artificial intelligence, along with solid earnings reports.
But alongside the progress being made, meanwhile, the market overall is sending signals of problema. Retail buyers’ interest, much of which stood behind past comebacks, is fading. In the absence of the sector’s comeback, analysts say, it would be difficult to sustain the pace.
Stock Update: The Lifeblood of Computing Today at ASML
ASML is ahead of the pack regarding contemporary computing, with the machines it produces supporting leading-edge technology. With such intricate supply chains, Nvidia develops the GPU engines, Taiwan Semiconductor Manufacturing Company (TSMC) manufactures them in high volume, and Broadcom handles the connectivity and integration. The ASML technology is on the cutting edge of the innovation throughout the tech industry, yet again setting it at the head of the international market.
Major Index Performance through July 17, 2025
- Nasdaq Composite: Closed at 13,784.50, -0.2% after closing a six-day
- S&P 500: Finished the day at 5,916.93, 0.3% higher for the day.
- Dow Jones Industrial Average: increased 0.7% to 38,650.00, the first increase in three days.
- Russell 2000: Closed at 2,092.10, a slight gain but 5.7% lower year to date
In the short term, the market will be closely watching the next batch of economic data and corporate earnings as investors look for greater clarity on the health of the economy and potential policy responses. The macroeconomic indicators vs. geopolitics tug of war will be the dominant driver of the trends in the market.
Gold Price – Thursday, July 17, 2025
Gold prices are rising and falling these days, trading at almost $3,341.68 per ounce, as investors digest recent economic data as well as geopolitical tensions. The recent U.S. Consumer Price Index readings, marking their five-month highest reading, stoked the higher inflationary fears, which else would uphold prices of the yellow metal. But the same higher inflation, however, lowered hopes of Fed rate cuts, thereby lowering investors’ requirements for no-yield holdings like the yellow metal. Geopolitical tension, particularly between China and the U.S., remains the dominant force, as President Trump had singled out Fed Chair Jerome Powell last week, adding to the degree of uncertainty. While Trump himself called Powell a “terrible chair” as well as insinuated the fact that Powell himself is “under investigation,” yet he stated that getting rid of Powell is “highly unlikely,” thereby obscuring the future of the outlook of the monetary policy.
For the future, the Economic data released today, which includes the Average Earnings Index, Claimant Count Change, Core Retail Sales, Retail Sales, and the Unemployment Claims, would be instrumental in outlining the market expectations. Better-than-expected readings would enhance the economy’s confidence, pushing the U.S. dollar higher and bearish pressure on the prices of gold. Lack of delivery would re-kindle the slowdown fears of the economy, supporting the appeal of the safe-haven asset, i.e., gold. Hence, though gold remains the most favorite bet-cum-hedging against the price rise and the volatility of the economy, the near-term price move of the same would be subject to the prevailing market conditions as much as the future Economic data.
Oil prices – Thursday, July 17, 2025
Prices of oil are under rising momentum today as Brent crude trades at $68.79 a barrel while U.S. West Texas Intermediate (WTI) crude trades at $66.69 a barrel. The rally follows a historic draw of U.S. crude stockpiles, which fell by 3.9 million barrels, surpassing market forecasts. Robust Chinese demand, as shown by a 8.5% rise of June crude oil throughput, has also supported stanching the tone of the oil market. All these, together with a strong balance of supplies as well as demands, are providing underpinning support to rises of oil prices. Geopolitical factors, like potential relaxation of U.S.-China trade war tension and elimination of limits in AI chips sale to China, have calmed down fears of slowdown of the global economy and therefore boosted hopes of oil demand.
But the latest comments by President Trump, disparaging Federal Reserve Chairman Jerome Powell and intimating that Powell is “under investigation” have added an element of uncertainty to US monetary policy. Even as Trump comments that Powell is “highly unlikely” to be fired have added a degree of market volatility, its impact on oil prices is unclear. The market will be eyeing today’s economic releases, i.e., the Average Earnings Index, Core Retail Sales, and Unemployment Claims. More-than-expected figures would bolster the US currency, potentially squeezing the price of oil, and weaker figures would trigger fears of the economy slowdown, thus sustaining oil as a safe-haven asset. The interplay of all these factors will also continue to dictate the price of oil in the near term.
Bitcoin Prices – Thursday, July 17, 2025
Bitcoin is at about $118,682.77, within $115,000-$118,500. The price stability is following the week high of $123,000, driven by the investment sentiment surrounding the U.S. political developments of the so-called “Crypto Week.” While the House of Representatives is debating a series of bills beneficial to the sector, including the GENIUS Act, blessed by President Trump, these would be intended to give the cryptomarkets a clearer set of regulatory requirements, and thus more institutional backing.
Also, President Trump’s government has moved to add Bitcoin to the national finance strategy. In March 2025, he signed an executive order calling for the creation of a Strategic Bitcoin Reserve, and he classified Bitcoin as a national reserve currency. The action demonstrates the government’s readiness to support the digital currencies and can give Bitcoin, as an investment vehicle, greater credibility, and attractiveness, among investors. Also, the government of Pakistan, among others, is allocating energy infrastructure to facilitate the use of Bitcoin mining, and firms like MicroStrategy are buying more Bitcoin reserve, seeing more acceptance by the rest of the world of the cryptocurrency. The actions add the positive tone of the Bitcoin market, signifying future gains expected through the months ahead.
ETH Price – Thursday, July 17, 2025
Ethereum (ETH) trades at around usd$3,336.68 and up 7.3% over the last 24 hours. The spike follows a historic institutional demand, as Ethereum ETFs saw more than usd$890mm of inflows in the month of July alone. The largest spot Ethereum ETF, the iShares Ethereum Trust (ETHA), increased by 5.3% on July 11, 2025, the largest daily return of the year so far. The spike, analysts say, follows the much-awaited passage of the GENIUS Act, which would offer more explicit regulatory clarity to crypto, something which would be likely to make institutions more confident in Ethereum.
In addition to ETF activity, whale buys are also stimulating ETH price action. There has been a consistent flow of three whales buying more than 174,000 ETH, totaling nearly $540 million, as a clear signal of institutional demand. One of the accounts bought a maximum of 68,141 ETH, valued at $213.8 million, while another set of accounts bought more than 106,000 ETH from a large exchange. The action reflects a bullish sentiment among big players, which creates the positive sentiment in the Ethereum market.
