Market Today
Global equity futures are declining today, with US and European futures experiencing a decline. The S&P 500, Nasdaq 100, and Dow futures are experiencing a decline of about 0.3% each. This is the third day of a decline for US futures. The DAX and Euro Stoxx futures are declining in Europe, with investors reacting to mixed earnings from Wall Street, declining economic confidence, and government funding risks in the US. The market is not panicked, but rather repricing, due to a potentially major announcement from the US central bank leadership and changing global market sentiment. One of the major factors contributing to declining futures is the uncertainty over the Federal Reserve. The US President, Mr. Trump, announced that his announcement for a new Federal Reserve chairman could come today. The potential candidates are Kevin Warsh, Rick Rieder, and Kevin Hassett, with different reputations. The markets are not concerned about the reputation of the person, but rather the impact it will have on monetary policy. For example, will the new chairman of the Federal Reserve be more aggressive with cutting interest rates or more cautious about inflation? This will have a major impact on the markets and even the strength of the US dollar.
Meanwhile, tech stocks are having their most scrutinized moment of the year, which is contributing to the futures sell-off. The Microsoft sell-off following their earnings report, which saw their biggest one-day percentage drop since March 2020, has investors questioning their faith in growth stocks fueled by artificial intelligence. While Apple reported a solid earnings report, investors now want to see a clear earnings story before investing in any tech stock. Software stocks are under selling pressure, and investors are becoming even more cautious about any stock that does not have a clear earnings story. This is now being reflected in European stocks related to cloud, chipmaking, and digital infrastructure.
Lastly, rising political tensions in Washington D.C. are also contributing to the sell-off in futures. The failure of a Senate procedural vote last night has put the U.S. government one step closer to a government shutdown. With already ambiguous central bank policies, poor earnings guidance from major tech stocks such as KLA Corp, and lingering geopolitical tensions related to Venezuela, Cuba, and Ukraine, futures have moved from growth optimism to capital preservation. The question now is whether investors will get clarity in the next 48 hours, which will determine whether the sell-off in futures is a correction or a reset.
Major Index Performance as of Friday, 30 Jan 2026
- Nasdaq: Trading near ~23,600, down by ~0.7%.
- S&P 500: Trading near ~6,970, lower.
- Dow Jones: Trading near ~49,071, higher.
- Russell 2000: Trading near ~2,655, higher.
The Magnificent Seven and the S&P 500
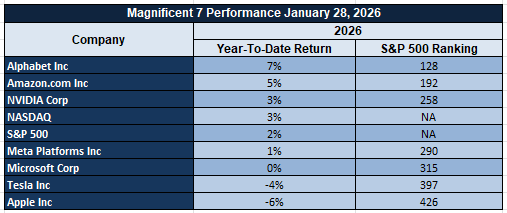
The Magnificent Seven, comprising Apple, Microsoft, Nvidia, Amazon, Meta, Alphabet, and Tesla, are now under pressure as their combined stocks have retreated by more than 18% from their recent highs. Microsoft has denied any commercial ties, Tesla has made an aggressive move into AI, and Apple has experienced supply chain pressures, which have led to these stocks losing investor interest. Although Meta has a great narrative and fundamentals, these stocks are still under pressure due to tech and rate sensitivity, which has impacted both the S&P 500 and Nasdaq.
Drivers Behind the Market Move – Friday, January 30, 2026
As the U.S. and European markets continue to traverse the complex macro and geopolitics landscape, the markets are reacting to a combination of factors related to policy decisions, economic data releases, and risk re-pricing of equities.
1. Risk of Leadership Transition at the Federal Reserve
One of the key factors influencing the markets today is the rising uncertainty related to the U.S. central bank’s leadership transition. In this regard, it was confirmed by President Trump today that the announcement of the next Federal Reserve chair would be made this morning, with speculation revolving around key policymakers. The markets are reacting to the potential leadership transition at the U.S. central bank, which may influence the direction of monetary policy decisions related to the timing of rate cuts. As such, the U.S. and European markets are reacting negatively to the potential leadership transition at the Federal Reserve, which may influence the direction of monetary policy decisions.
2. Geopolitical and Policy Risk Emanating from Washington
Geopolitical risks are rising, and this has been prominently reflected in trading behavior. Trump has issued an executive order declaring a national emergency due to Cuba-related threats. He has also hinted that a new tariff system will be put in place for countries that are providing oil supplies to Cuba. All this has increased trade policy risks, leading to an increase in energy-related disruptions, which are favoring a rise in risk-off behavior in futures trading worldwide. Although there are talks about new security and prosperity agreements in Ukraine, geopolitical risks are dominating the policy rhetoric.
3. Anticipation of Key Macroeconomic Data
Investors are also positioning themselves for major macroeconomic data releases due today, such as German preliminary CPI and GDP data, as well as US Core PPI data and US PPI m/m data. The market is trying to gauge inflation and growth trends in both Europe and the US, which may influence ECB and Fed rate decisions. Yesterday, inflation data was mixed, as US producer prices fell, but US consumer demand data remained mixed. Until today, macro data releases provide a clear indication of inflation or growth trends, futures in both Europe and the US are influenced more by anticipation than conviction.
To summarize, it appears that a combination of leadership changes at central banks, geopolitical risks, and a macroeconomic data trifecta are driving market behavior today. Investors are taking a cautious approach as futures are directionless, awaiting clear policy signals from central banks and macroeconomic data.
Digesting Economic Data
The TRUMP Tweets and Their Implications
In late January 2026, a series of executive orders and announcements from the White House have dramatically altered both geopolitical risk pricing and investor risk sentiment. In a series of announcements, President Trump signed an executive order declaring a national emergency with respect to what the administration defines as a series of Cuba-related national security risks. The order defines the national security risks emanating from the island nation’s affiliation with adversarial nations and international security actors. The order also created a new mechanism for imposing a series of potential tariffs on nations that supply oil to Cuba. This is occurring at a time when Mexico is cutting oil shipments to the island nation due to pressure from the US government, further exacerbating the energy crisis that is affecting the nation. The situation is exacerbated by the fact that the US government is declaring this a national security issue, which is affecting the way that investors are viewing a series of commodities and currencies.
Outside of the direct impact on monetary policy, the overall messaging of the administration, ranging from the promise of an upcoming announcement on the new Fed chair to the linkage between rates and housing affordability, is injecting an element of uncertainty on monetary policy going forward. The markets are caught between the hopes of future liquidity and the potential for tightened trade policy, which has created an uncertain environment for risk assets. The overall tone of the administration, touting the ‘unprecedented achievements’ of the administration while railing against geopolitical foes, has exacerbated the overall level of global uncertainty premiums. In the commodity space, the overall impact of the administration’s messaging has coincided with an increase in oil prices to near multi-month highs as the overall supply chain risk and the potential for escalating global geopolitics weigh on the markets. Equities and other riskier assets such as Bitcoin and ETH are similarly reacting to overall macro and policy noise, as opposed to fundamentals, as the markets consolidate risk levels in an attempt to balance the overall promise of rate cuts with the reality of escalating trade tensions and overall foreign policy.
The overall impact of the administration’s messaging on the markets has created an environment where risk levels are being priced on the intersection of geopolitics and monetary policy ambiguity. Investors are grappling with the potential for supply chain disruptions, the overall impact of tariffs on the broader economy, and the overall level of uncertainty related to the next Fed chair’s overall approach to monetary policy, all while trying to navigate the overall macro landscape. Any measures related to the expansion of overall tariff authority, especially those tied to national security, are injecting an overall level of risk related to the potential for broader trade conflicts, which could impact capital flows, currency levels, and overall investment strategies. At Zaye Capital Markets, we believe this overall level of messaging to be more than just the rhetoric of the administration; it is an active participant in the overall repricing of risk levels in the commodity, FX, and overall risk space.
Going forward, the interplay of policy narratives and economic data releases, including inflation and economic growth, will be important in establishing whether the current risk premiums persist or are unwound. The policy implications of the administration’s moves on Cuba, and the inferred extension of tariff authorities, highlight a developing geopolitical risk theme that could interact with monetary policy expectations in a way that redefines correlations. Until there is greater clarity on policy or a clear monetary policy shift, markets are likely to be in a heightened state of vigilance.
Metals Drive Bloomberg Commodity Index Surge as Energy Prices Flatline
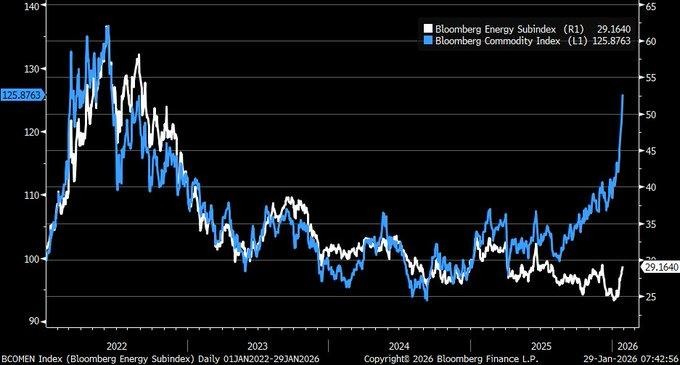
While the Bloomberg Commodity Index breakout in 2026 has garnered significant market attention due to its steep rise, a deeper analysis reveals that this rally is anything but broad-based. While the Bloomberg Commodity Index has reached new all-time highs, the Bloomberg Energy Sub-Index has remained flat, suggesting that this rally is not driven by core commodity groups like oil and natural gas. Instead, metals like gold and silver are driving this rally due to rising geopolitical tensions and a weakening global currency. The lack of a broad-based rally in commodities suggests that inflationary pressures are rising, albeit in a very specific and concentrated manner.
There are two broad forces at work in this market. The first is that metals like gold and silver are being driven by a global repricing of uncertainty. In a world where tensions are rising and real interest rates remain low, investors are seeking safe havens like precious metals. The second force at work is a subtle change in the Bloomberg Commodity Index, which has seen a rise in metals and agriculture due to its 2026 rebalancing. The Bloomberg Commodity Index has shifted its composition due to this 2026 rebalancing, and metals and agriculture are now playing a more important role in this index. The lack of a breakout in the Bloomberg Energy Sub-Index suggests that this rally is not driven by core commodity groups like oil and natural gas. Instead, metals like gold and silver are driving this rally due to a weakening global currency and rising geopolitical tensions.
The Bloomberg Commodity Index has reached new all-time highs, while the Bloomberg Energy Sub-Index has remained flat. This suggests that this rally is not driven by core commodity groups like oil and natural gas. The metals rally is a clear reflection of a weakening global currency and rising geopolitical tensions. In this backdrop, precious metals miners with operational leverage and cost discipline are undervalued. Companies with exposure to silver and gold and a lack of exposure to energy and other commodities will benefit from this rally. Analysts need to focus on three things: margin performance relative to spot prices, capital inflows into commodity-linked funds, and forward-looking cost models. The metals rally is not a broad-based commodity cycle; rather, this is a capital rotation play.
US Mortgage Refinancing Wave Sustains Growth Tailwinds into 2026
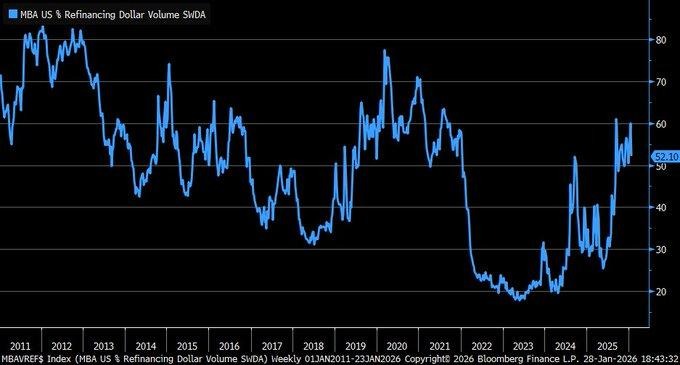
Mortgage refinancing activity, as captured by Bloomberg’s SWDA index of weekly mortgage refinancing data, continues to sustain higher levels well into early 2026 despite a minor dip from the year’s previous peak. This is an important trend change, as households are benefiting from refinancing at lower interest rates after the multi-year tightening cycle. The interest rate cuts initiated by the Federal Reserve in late 2024 to the present have reduced the average 30-year mortgage interest rate from a 7.8% peak to 6.5%. This has provided an opportunity for millions of households to refinance their mortgages, thereby reducing their housing costs. According to data, this refinancing wave has provided an average saving of $300 per month per household.
This is an important refinancing relief for the overall US economy. The reduced interest burden will provide households with increased liquidity, allowing for discretionary spending while maintaining overall consumption levels despite an overall credit market slowdown. This is also important at a time when overall credit market trends are witnessing increasing credit delinquencies for consumers beyond the housing market. MBA’s 2026 forecast of $2.2 trillion of mortgage originations, an 8% increase from 2025 levels, is an important indicator that this is not just a blip but a secular trend change towards refinancing-driven economic support. The overall implication for the US economy is that household interest relief is a buffer against any weakening of consumption trends in the near term.
From an investment perspective, non-bank mortgage originators with diversified servicing portfolios are undervalued at present and are poised to benefit from this refinancing wave as well as the overall improvement in asset performance metrics due to the better credit quality of the underlying borrower pool. Analysts should focus on the trends in forward lock volume, servicing rights valuations, as well as margin trends for conventional loan pipelines. If overall origination levels continue to increase with stable interest rates and improving credit quality, some of these non-bank originators with efficient cost structures could see a material rerating through 2026.
Private College Tuition Outpaces Inflation, Raising Affordability Red Flags
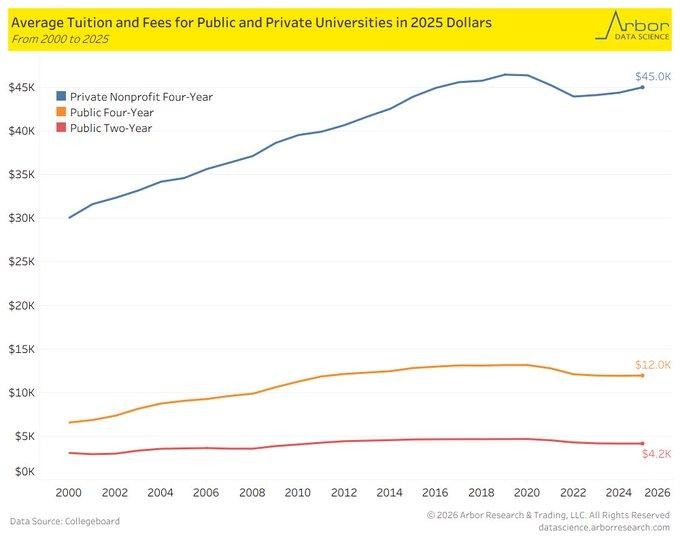
According to the latest data released by the College Board, the average cost of tuition and fees at private non-profit four-year colleges is projected to increase by 4% to $45,000 for the upcoming 2025-26 school year. Despite the increase appearing to be a modest one, the fact that it is a continuation of a long-term trend where the cost of college outpaces the growth rate of household income is a cause for concern. More alarmingly, a chart provided by DataArbor that adjusts the data for inflation reveals that the cost of private colleges has increased by a whopping 125% since the year 2000, compared to a more modest increase of 60% for public colleges.
While the actual cost of attendance after taking into account scholarships and grants is significantly lower at $16,910 for first-time full-time students, the fact that even this number is up by 3.7% over the last year is a cause for concern. The fact that the cost of private colleges continues to increase is a result of the rising cost of higher education as a whole. As the student debt burden continues to be a significant one, the impact that the rising cost of education is having on the economy is a cause for concern.
In our opinion, the sectors that are likely to benefit from the rising cost of traditional education are those related to digital credentials, student finance solutions, and workforce skill enhancement. These sectors are likely to benefit as more and more individuals look for alternative routes to higher education that provide a better return on investment. As such, we believe that investors should look at these sectors as a potential alternative to traditional education routes. As the cost of education continues to rise, more and more individuals are likely to look towards alternative routes to gain the skills that they need to enter the workforce.
Health Premium Burdens Spike in Low-Income States, Threatening Spending Power
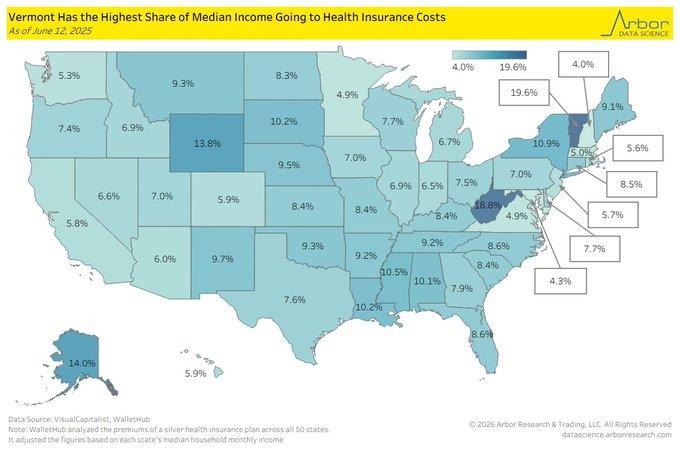
A WalletHub analysis of 2025 silver plan premium costs adjusted for median income reveals significant affordability challenges in several states across the country. Vermont ranks the highest at 19.6% of income, followed closely by West Virginia at 18.8%. The problem is not just the cost of the insurance premium; the problem is the relative wage growth that is outpacing the premium increases. The disparity between states is significant. In the state of Iowa, the cost of the premium is only 4.9% of income, while Vermont is sacrificing nearly 20% of income before deductibles or out-of-pocket costs are considered. These regional cost disparities are emerging in a period of rising inflation. The 2025-26 premium increases range from 6% to 7%. The problem is not just healthcare; the problem is the relative increase in the cost of insurance premiums on the household balance sheet. These fixed costs can significantly limit discretionary income in rural states where the wage floors remain low and public subsidies have stricter income eligibility criteria. Even a moderate increase in premium costs can negatively impact consumption in critical categories such as food, utilities, or housing. From a macroeconomic perspective, the economy still relies on consumer spending as a primary engine for economic growth. The high cost of healthcare is an underappreciated drag on the economy. From a market perspective, the environment underscores the underappreciated potential for cost management platforms and digital primary care companies that focus on affordability. These companies have the potential to gain significant traction in the states that face the greatest relative cost-to-income ratios. Analysts should consider regional medical loss ratios for each state and the relative shifts in insurance carrier public exchange enrollment. If the cost of insurance remains structurally high, the companies that can deliver insurance premium cost reduction should enjoy a tailwind through 2026 and beyond.
Upcoming Economic Events
German Prelim CPI m/m, German Prelim GDP q/q, USA Core PPI m/m, USA PPI m/m
The week ahead holds a high concentration of inflation and growth data, which has the potential to significantly impact both the equity and fixed-income markets, especially as the global rate expectations are shifting from certainty to doubt. Investors will need to process the latest inflation and growth data from Germany just hours before digesting two important inflationary gauges from the United States, the Producer Price Index (PPI) and Core PPI. The timing of the data will play a crucial role in market positioning, as the European inflation and growth data will set the stage for early morning positioning, followed by the US data, which has the potential to significantly impact market expectations prior to the next central bank policy meeting. Volatility is low, and positioning is skewed towards rate cuts, and any deviation from market expectations can lead to a sharp market realignment.
German Prelim CPI m/m
The preliminary Consumer Price Index from Germany will attract market attention, not only because of its fundamental value but also because of its ability to reflect the inflationary trends in the entire Eurozone.
- If the actual figure is reported to be higher than market expectations, it would indicate that inflationary pressures are still alive and well in the Eurozone, despite the weak economic growth. In such a case, the Euro would strengthen, and the sell-off in the bond market would continue, along with a negative impact on the rate-sensitive stocks in the DAX, such as real estate and utility stocks.
- Conversely, if the CPI numbers come in lower than forecasted, this would support the thesis for a dovish pivot. In this case, the European bond market would likely see yields fall, and this would be positive for equities in sectors such as construction, housing, and consumer discretionary. The performance of domestic-oriented German stocks will also be an important focus, especially considering the inflation-sensitive consumer’s spending patterns.
German Prelim GDP q/q
The quarterly German GDP figure will provide the most direct indication of whether the largest economy in Europe is emerging from its stagnation cycle or slipping further into structural weakness.
- A positive surprise in this figure will provide further confidence in the outlook for the European Union and will support the thesis for selective positioning in cyclical sectors such as industrials, chemicals, and automobile manufacturers that benefit from an improvement in internal demand and export capacity.
- However, if this figure disappoints the market, the risk of a sharp repricing in German sovereign bonds and the risk of the German economy’s energy supply dependencies and productivity issues will likely come to the fore. In this case, German bank shares and companies with high exposure to European capex cycles will likely be negatively impacted. Of particular interest will be the euro’s price action as a proxy for confidence in the European Union’s economic recovery, especially if growth and inflation surprises are divergent.
USA Core PPI m/m & PPI m/m
From a US perspective, all eyes will be on the producer price index data, which is one of the last inflation data points ahead of the next FOMC meeting. Core PPI data strips out volatile components and provides a clearer picture of underlying inflation trends in the US economy.
- If either data point prints higher than expected, it will make it more difficult for markets to clearly point to a progression in disinflation, especially as services and shelter-related inflation have remained stubbornly high. A hotter inflation print will likely result in a rise in Treasury yields, a less enthusiastic tone in equities, particularly in tech and consumer growth stocks, and renewed debate over how long the Fed can stay in a holding pattern.
- A softer print will reinforce the narrative of easing inflation pressures and provide room for margin improvement in a range of sectors, particularly in industrials, transportation, and discretionary retail. Small- and mid-cap equities may benefit in this scenario as a result of higher sensitivity to domestic input costs.
Stock Market Performance
Indexes Hold YTD Gains, But Member Drawdowns Reveal Fragile Market Breadth
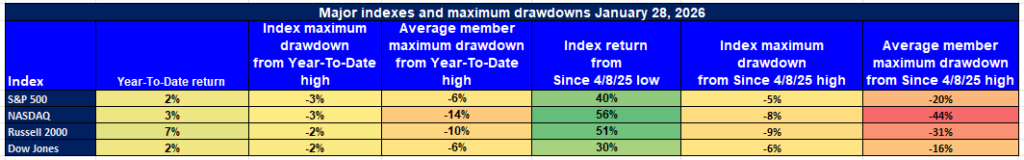
While all four major U.S. stock market indexes have maintained year-to-date gains, the latest drawdown data available through January 28, 2026, continues to highlight the disconnect between the strength of the major indexes and the weakness of the underlying stocks that comprise the indices. While the S&P 500, NASDAQ, Russell 2000, and Dow Jones Industrial Average have all maintained gains from their respective lows in April 2025, the underlying stocks that make up the indices have continued to exhibit significant volatility, particularly in the growth and small-cap space. The strength in the major indexes since the lows in April 2025 has been significant, but the breadth of the move has been relatively narrow, and the underlying stocks that make up the indices have experienced much greater drawdowns.
S&P 500: Headline Strength, Underlying Strain
YTD: +2% | +40% off April 8 low | Max Drawdown YTD: -3% | Avg. member: -6%
Since bottoming in early April 2025, the S&P 500 has risen 40% and has maintained its year-to-date gain of 2%. However, underlying the strength of the S&P 500, the average underlying stock has fallen 6% from its year-to-date high. This is evidence of the underlying strain that continues to exist within the S&P 500, where the strength of the top stocks is masking the underlying weakness of the stocks that make up the S&P 500. While the S&P 500 has fallen only 3% from its year-to-date high, the 20% drawdown experienced by the average underlying stock in the S&P 500 since the low in April 2025 is significant.
NASDAQ: Sharp Gains Mask Deep Member Losses
YTD: +3% | +56% off April 8 low | Max Drawdown YTD: -3% | Avg. member: -14%
The NASDAQ continues to show strong year-to-date gains, rising 3% year to date and an impressive 56% from its April lows. However, the NASDAQ is still the most internally fractured of the three major indices. The NASDAQ still has an average member down -14% from its year-to-date highs and -44% from its highs since April. This reflects the extreme concentration in the handful of mega-cap technology names and leaves the space highly vulnerable to profit-taking and volatility re-entries.
Russell 2000: Small Caps Lead the Pack, But Breadth Still Lagging
YTD: +7% | +51% off April 8 low | Max Drawdown YTD: -2% | Avg. member: -10%
The Russell 2000 has posted the strongest year-to-date gain, rising 7%. This is largely driven by the 51% gain from its trough in April. However, the average member still trails its highs since April by -31%. The average member has also fallen -10% from its year-to-date highs. This suggests the small-cap space is still showing uneven signs of improvement, driven by better risk appetite but still lacking conviction across the entire range of constituents, especially in the economically sensitive names.
Dow Jones: Stability Returns, But Breadth Still Lagging
YTD: +2% | +30% off April 8 low | Max Drawdown YTD: -2% | Avg. member: -6%
The Dow Jones Industrial Average has demonstrated moderate strength, rising 2% year to date and 30% from its trough in April. The index itself has seen minimal drawdowns, losing only -2%. However, like the S&P 500, the Dow Jones still has its average member down -16% from its highs since April and -6% from its year-to-date highs. This suggests the Dow Jones still has elevated levels of rotation pressure, especially in the legacy and value space. The defensive nature of the index is providing some insulation, but the Dow still lacks conviction across its broader constituents.
At Zaye Capital Markets, we continue to monitor breadth deterioration beneath headline gains. Our near-term view remains selective on companies with clean balance sheets, strong cash flow visibility, and limited valuation risk as volatility reasserts itself across the broader equity landscape. Member-level drawdowns are not noise – they are a reminder that market breadth remains too narrow to support an unchecked move.
The Strongest Sector in All These Indices
Energy and Materials Lead the S&P 500 as Defensive Rotation Powers Early 2026 Gains
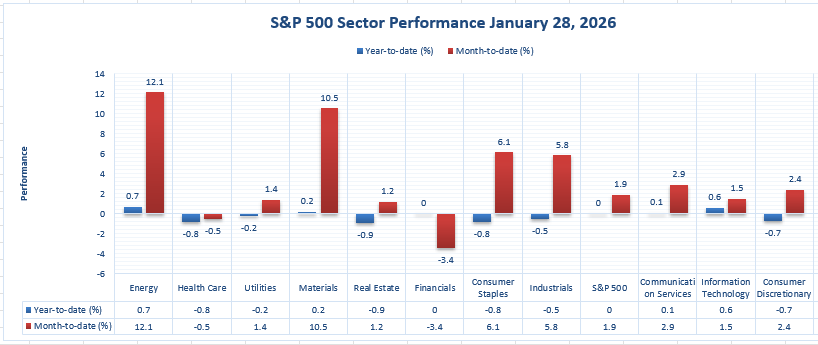
Within the S&P 500, as of January 28, 2026, the latest available sector-level data reveals that there is a strong divergence in the performance of the S&P 500 sectors in the first part of the year, with a small handful of sectors significantly outperforming the +1.9% year-to-date performance of the S&P 500. Among the strongest sectors are Energy, with a +12.1% year-to-date performance, and Materials, with a +10.5% year-to-date performance, significantly outperforming the rest of the sectors in the S&P 500. These sectors are continuing their strong performance as the capital rotation favors sectors sensitive to inflation in the midst of crosscurrents in the macroeconomic landscape, including geopolitical risks, supply chain issues, and a weakening global currency.
Energy had a marginal increase of +0.7% on the day on January 28. The 12.1% YTD performance is a result of stable demand fundamentals, positive supply fundamentals, and rising investor appetite for companies that have pricing power and positive free cash flow generation in a world of uncertainty. The materials sector, which comprises metals, chemicals, and commodities-related equities, gained +0.2% on the day but 10.5% YTD. The materials sector has benefited from rising industrial metal demand and inflation hedging in precious metals, evident from the recent rebalancing of the commodity indices.
Consumer Staples gained +6.1% and Industrials gained +5.8% YTD but significantly trail behind the performance of the Energy sector and the Materials sector. Information Technology gained +1.5% and Communication Services gained +2.9% YTD but significantly trail behind the performance of the Energy sector and the Materials sector. Financials have underperformed the broader market, losing -3.4% YTD but gained flat on the day on January 28.
From the Zaye Capital Markets perspective, the performance of the Energy sector and the Materials sector indicates that the market is seeking tangible asset plays with positive margin fundamentals in a world of macro uncertainty. Sector rotation is no longer theoretical; sector rotation is now a reality.
Earnings
Thursday Earnings Recap, January 29, 2026
- Apple Inc. reported fiscal Q1 2026 results with revenue of approximately $143.8 billion and EPS of about $2.84. Gross margin stood near 45%, while net income reached around $36.3 billion. Segment performance was led by strong double-digit iPhone growth and record services revenue. Apple’s installed base reached an all-time high. Looking ahead, management expects sequential revenue growth with sustained elevated margins.
- Nokia Corporation delivered Q4 2025 revenue of €6.1 billion and a comparable operating profit of €1.05 billion, representing an operating margin of approximately 17%. EPS (comparable) stood at €0.16. For the full year 2025, revenue totaled about €24.6 billion with positive free cash flow and a maintained dividend. The company reaffirmed its 2026 operating profit range and continues to focus on network infrastructure, private wireless, and AI-related demand.
- Roche Holding Ltd posted full-year 2025 revenue of CHF 61.5 billion and a core operating profit of approximately CHF 19.5 billion. Net income was CHF 12.4 billion, while core EPS came in at around CHF 16.30. The dividend was maintained. Outlook guidance pointed to low single-digit sales growth, with currency headwinds flagged. The oncology portfolio remained stable, and attention is growing around Roche’s obesity drug pipeline.
- Honeywell International Inc. announced Q4 2025 revenue of around $10.1 billion and adjusted EPS near $2.60, with an operating margin close to 22%. Full-year 2025 revenue reached approximately $38.6 billion, while adjusted EPS stood at $9.60 and free cash flow totaled about $5.8 billion. For 2026, the company expects EPS growth, led by strength in aerospace and industrial automation, with continued portfolio restructuring in motion.
- Caterpillar Inc. reported Q4 2025 revenue of approximately $19.1 billion and adjusted EPS near $5.45, with operating margins at roughly 21%. For the full year 2025, Caterpillar achieved revenue of about $67.6 billion and EPS of approximately $22.50. Free cash flow totaled around $9.5 billion. Management highlighted ongoing demand from energy, infrastructure, and data-center power, with cost discipline helping to preserve margin strength.
- Nasdaq, Inc. posted Q4 2025 net revenue of approximately $1.4 billion and net income of $519 million, resulting in adjusted EPS near $0.96. Full-year 2025 revenue stood around $5.2 billion, with $4.0 billion derived from its growing solutions segment. Guidance remains focused on continued expansion in market technology and data services.
- Comcast Corporation delivered Q4 2025 revenue of roughly $32.3 billion, adjusted EPS of around $0.84, and net income of approximately $4.2 billion. Free cash flow reached $4.5 billion. Despite continued broadband subscriber losses, Comcast benefited from strength in its theme parks and wireless segments, while streaming division losses narrowed meaningfully during the quarter.
Friday Earnings Preview, January 30, 2026
- Chevron Corporation is scheduled to report today with a focus on upstream production volumes, refining margins, and capital deployment efficiency. Investors will closely examine free cash flow generation and updates on capital expenditure plans in a flat-to-soft commodity price environment.
- Exxon Mobil Corporation is also set to report earnings, with analyst attention centered on global liquids and natural gas production, dividend stability, and downstream performance. Any revisions to 2026 capex and production guidance will be closely scrutinized.
- Verizon Communications Inc. will release results with the market focused on postpaid subscriber trends, wireless average revenue per user (ARPU), and 5G monetization. Margins and churn rates will be key indicators of operational strength in a competitive pricing environment.
- Air Products and Chemicals, Inc. is expected to provide insight into industrial gas demand and project backlog conversion. Market participants will assess earnings sensitivity to global manufacturing trends and the company’s hydrogen infrastructure buildout.
- Colgate-Palmolive Company is reporting today with investor focus on pricing strategies, volume growth in emerging markets, and gross margin stabilization amid input cost pressures.
- American Express Company will report earnings with key metrics around cardholder spending trends, net interest income, and loan loss provisions. Early indicators of credit quality will be critical for evaluating consumer resilience.
- SoFi Technologies, Inc. will release results tied to member growth, lending volume, and net interest margin expansion. Analysts will be watching for updates on banking license utilization and profitability progress across business segments.
- IES Holdings, Inc. is expected to report earnings with an emphasis on backlog growth, execution margins in its electrical infrastructure business, and visibility into 2026 contract wins.
- Aon plc will post results highlighting its performance in commercial risk, health solutions, and reinsurance. Retention rates and pricing power in the current renewal environment will be key to forward earnings trajectory.
- Hexagon AB is due to report with investors focused on order intake, software license growth, and strength in its industrial measurement and geospatial divisions.
Stock Market Overview – Friday, 30 Jan 2026
The US stock markets are navigating a cautious path as the combination of mixed earnings, AI-driven capital expenditures, and macro factors continues to weigh. With several major companies having reported their earnings over the past 48 hours, the markets are navigating a challenging environment, particularly the Nasdaq, where investor sentiment seems to have become less sympathetic. Despite the high valuations of the S&P 500, we are seeing some evidence of rotation into defensives, value, and industrials. As always, we are focused at Zaye Capital Markets on the quality of the earnings revisions and the ability of these companies to execute on the AI revolution.
Stock Prices
Economic Indicators and Geopolitical Developments
The markets are still largely influenced by the interest rate environment, corporate earnings guidance, and the evolution of geopolitical events. The 10-Year Treasury remains high, and the rise in energy prices continues to cause investors to become cautious. The markets are also responding to the corporate comments that have been issued recently about the AI infrastructure spend, the regulatory environment in the capital markets, and the high levels of capex that are being reported by the tech industry. In addition, the proposed changes to the way that retail accounts are structured are also creating a new dynamic in the space.
Latest Stock News
- META is being recognized as a winner in the application layer of the AI economy. The most recent earnings report from the company highlighted the fact that AI is already having a positive impact on the growth rate of the business. However, the stock trades at 17x earnings and investors are still not rewarding the company for the AI flywheel that we believe is in the very early stages of compounding.
- $TSLA’s earnings call made one thing very clear: Tesla is no longer just a car company, but a real-world AI systems operator. Elon Musk announced the pivot to autonomous fleet services (cybercab), humanoid robots (optimus), and custom AI chips (AI5/AI6). With 650,000 robotaxi miles driven and new compute infrastructure (cortex 2) in development, Tesla is aggressively positioning to scale its autonomy, just like LLMs—if scaling laws apply.
- $MSFT dismissed rumors of a “close collaboration” with $RR, Rolls-Royce, claiming it was just a normal customer interaction and not a commercial partnership. This comes amid market speculation about AI and industrial integration.
- $AAPL made a rare $2 billion acquisition of audio AI startup QAI, indicating its interest in physical AI applications such as spatial audio, real-world awareness, and context-based interfaces. Apple’s Tim Cook admitted that tight supply of TSMC’s advanced process nodes is affecting its ability to produce system-on-chip, even though increases in memory prices from $MU are already included in its guidance for a 48% gross margin.
- Elon Musk is in talks to merge SpaceX with xAI, a move that may happen ahead of a potential IPO. He is considering merging his ventures, potentially with $TSLA or xAI, given the overlap between AI and space exploration ventures and the need for a unifying structure to operate both ventures.
- Rep. Strong announced his first stock trade in three years, acquiring shares of $IREN just days after Congress advanced an appropriations bill to achieve energy dominance, rare earths, and nuclear infrastructure, directly affecting the committees he serves on.
- $HOOD is being considered for use as the operating platform for the proposed “Trump Accounts,” tax-advantaged investment accounts for American children, further adding to its status as a policy-sensitive fintech play.
- OpenAI has begun expanding its finance team as they prepare for a possible Q4 IPO. This move has been viewed as both defensive and strategic, as they are worried that Anthropic might beat them to the public markets.
- “RKLB” Neutron launch program has achieved another milestone as its “Hungry Hippo” spacecraft was successfully delivered to its assembly facility located in Virginia. This comes after the second Electron launch for 2026.
The Magnificent Seven and the S&P 500

The Magnificent Seven, comprising Apple, Microsoft, Nvidia, Amazon, Meta, Alphabet, and Tesla, are now under pressure as their combined stocks have retreated by more than 18% from their recent highs. Microsoft has denied any commercial ties, Tesla has made an aggressive move into AI, and Apple has experienced supply chain pressures, which have led to these stocks losing investor interest. Although Meta has a great narrative and fundamentals, these stocks are still under pressure due to tech and rate sensitivity, which has impacted both the S&P 500 and Nasdaq.
Major Index Performance as of Friday, 30 Jan 2026
- Nasdaq: Trading near ~23,600, down by ~0.7%.
- S&P 500: Trading near ~6,970, lower.
- Dow Jones: Trading near ~49,071, higher.
- Russell 2000: Trading near ~2,655, higher.
At Zaye Capital Markets, our view remains cautious and selective. Although our view remains bullish for these stocks, their leadership and participation are still narrow, and rate pressure remains high, so we are keeping our focus on companies with strong balance sheets and positive free cash flows and those with direct participation in secular trends, particularly those with AI narratives that are now translating into monetization.
Gold Price: Why Is Gold Holding Above $5,200 as Trump Actions and Inflation Data Collide?
Gold price has retreated somewhat from its recent record highs above $5,600 per ounce but remains solidly anchored above $5,200 per ounce as the global financial community digests a two-pronged shock to global markets. President Trump’s executive declaration of a national emergency regarding U.S.-Cuba relations and his threat to impose tariffs on countries that are key oil suppliers has ratcheted up geopolitical risk across Latin America and the energy sector. At Zaye Capital Markets, we believe that other moves, including reopening Venezuela airspace to commercial air carriers and indicating oil majors’ interest in revisiting Venezuela, and Trump’s national security justification for revisiting U.S.-Cuba relations, have accelerated hedging interest. The data releases today for German CPI, German GDP, and U.S. PPI will dictate what happens next for real yields, and if inflation surprises to the upside and GDP disappoints, then the case for stagflation plays will continue to support gold prices. On the other hand, softer data will compress yields, and gold prices will continue to benefit as geopolitical risk remains front and center.
Meanwhile, the recent data points, particularly the underperformance of the US Core PPI and the sticky forward inflation surveys, have set the stage for what appears to be a sentiment recalibration in the gold price. The market is now in a structurally supportive place, where the three concurrent tailwinds of the past year persist. These include the persistently high geopolitical tensions in the form of energy trade routes and strategic alliances, the monetary policy indecision of central bankers who lack the conviction to act in the face of disinflation, and the institutional investment in physical assets that provide a buffer to macro volatility. The fact that AI and defense stock volatility has spiked in the past few days only makes the non-correlated benefits of gold that much more compelling. As long as Trump’s foreign policy continues to upend the narrative on global supply and economic data continues to leave interest rate markets fluid, Zaye Capital Markets is of the view that the price of gold will continue to remain above the $5,000 mark, not in speculative terms, but in terms of a new equilibrium in the balance of the global capital structure.
Oil Prices: Why Are Oil Prices Rising as Tariff Tensions, Iran Risk, and Economic Data Collide?
Oil prices continue to trade at high values as we head towards the close of January, with West Texas Intermediate crude oil futures currently changing hands near $65.38 per barrel and Brent crude oil futures near $70 per barrel. These values represent an increase in oil prices over the month so far and indicate that oil prices are not just rising because of seasonality; rather, they’re rising as a result of an overall mix of factors that have created tensions in the oil price markets over the last 72 hours or so. President Trump’s executive order on imposing a new tariff structure on nations that export oil to Cuba is a direct cause of oil price volatility in the region as it could create ripples in trade routes in the Caribbean region as well as Venezuela. We’re also keeping an eye on President Trump’s policy pivot in Latin America as he’s ordered Venezuelan airspace to be reopened for trade, spoken about oil majors returning to Venezuela, and created a new national security policy for oil routes out of the White House. In addition to this, tensions in the Middle East as a result of the United States monitoring possible kinetic actions against Iran have also created a scenario in which oil prices have been structurally supported in recent days.
Underneath all of the geopolitical drivers, there’s an overall macro-economic background which subtly supports the bullish case for oil prices. Yesterday’s PPI data was softer than expected for the US, but inflationary expectations remained strong, which should help maintain real yields low and continue to underpin the risk-on sentiment and the assumptions on the demand side of the equation. This has somewhat offset the impact of the lower global industrial growth rates. Moving on to today’s German GDP and CPI, and US PPI, the overall macro-economic data will provide an important gauge of the demand side of the equation. A stronger-than-expected inflation reading will continue to underpin the view of continued healthy levels of energy demand, and the view that central banks are willing to accept the impact of inflation on input costs, which would both be positive for oil prices. On the other hand, weaker-than-expected readings could temporarily weigh on the overall demand side of the equation, but until then, the overall geopolitical situation and the tariffs are likely to continue to underpin oil prices at levels well above $60 per barrel. The IEA and OPEC are both predicting stronger growth rates for oil demand going into 2026, and oil traders are starting to position accordingly. At Zaye Capital Markets, we believe this creates an important ‘macro-geopolitical dual support zone’ for oil prices, where the risk does not come solely from macro-economic factors but also from the overall geopolitical drivers of trade wars, security risks, and the overall themes of the shift towards more oil-friendly global geopolitics.
Bitcoin Prices: Why Bitcoin Is Dipping Below $83,000 Even as Geopolitical Risks Intensify, Policy Risks Persist?
Currently, Bitcoin is trading at $82,815.70, having fallen significantly from the recent highs of $96,000. The current Bitcoin prices are showing a clear fall, indicating that the crypto market is experiencing a volatile correction of the initial risk-on positions that were adopted at the start of the year. The crypto market is currently showing clear signs of exhaustion, having experienced a strong surge at the start of the year based on the optimism of ETF approvals and Fed policy speculations. On-chain analysts are reporting that there is a clear stagnation of spot buying and ETF flows, while there is a surge of short-term hedging activity, according to the current futures data. The recent spate of Trump administration activity, which has involved executive orders against Cuba and Venezuela, coupled with a warning of potential trade penalties against any country that could be involved in the supply of oil, under different conditions of liquidity, could be viewed as bullish drivers of Bitcoin’s hedge narrative. However, under current conditions, Bitcoin is trading more like a high-volatility macro asset, which is being influenced by equity markets, yields, and capital flows, rather than geopolitical events. The current fall of Bitcoin over the last 48 hours has mirrored the fall of the Nasdaq, indicating that it is more likely being influenced by the current waning of risk appetite rather than any crypto-specific drivers. The current conditions, whereby Asia, Europe, and even Latin America are reporting that even the instability of local currencies is failing to propel Bitcoin inflows, are a clear indication that the fear of Bitcoin is just not strong enough, nor is the liquidity cheap enough.
The lack of fuel in yesterday’s US PPI data does not help spark a reversal. The disinflationary trends are still in place, and the market remains uncertain whether the Fed will pivot quickly enough to spark another speculative risk-on cycle. Trump’s comments regarding US housing and interest rates and his upcoming announcement regarding the Fed chair hint at a pro-liquidity environment in the future, but timing remains ambiguous. Until then, Bitcoin remains in what we define as a macro-bound zone—not in crisis, not in control. The lack of momentum above $90,000 remains a structural level for Bitcoin, according to crypto strategists. The $80,000 level now becomes the level of support. The market remains in wait mode, where narratives are in place, but confirmation is still needed. Until Bitcoin can decouple from its equity beta or until significant changes in the overall macro environment are seen, such as a clear Fed pivot, a sovereign buying event, or explosive ETF inflows, Bitcoin remains stuck in the geopolitical and monetary environment.
ETH Prices: Why Is Ethereum Falling near $2,750 as Whale Activity and ETF Flows Change?
The current price of Ethereum is around $2,753.70. This represents a substantial fall of approximately ~6.6% during the last 24 hours. The Ethereum price has been declining as the overall crypto market continues to face challenges. The price of Ethereum was unable to break past the key resistance level during the earlier part of January. The Ethereum price was able to break past the key resistance level but was unable to sustain it. The price of Ethereum was unable to break past the key resistance level of $3,400-$3,500. The supply cluster was able to reject the price of Ethereum. The price of Ethereum has now entered a bull trap. The price of Ethereum has now entered a bull trap as it was unable to break past the key resistance level. The price of Ethereum has now entered a bull trap as it was unable to break past the key resistance level of $3,400-$3,500. The price of Ethereum has now entered a bull trap as it was unable to break past the key resistance level. The price of Ethereum has now entered a bull trap as it was unable to break past the key resistance level of $3,400-$3,500. The price of Ethereum has now entered a bull trap as it was unable to break past the key resistance level. The price of Ethereum has now entered a bull trap as it was unable to break past the key resistance level. The price of Ethereum has now entered a bull trap as it was unable to break past the key resistance level. The price of Ethereum has now entered a bull trap as it was unable to break past the key resistance level. The price of Ethereum has now entered a bull trap as it was unable to break past
The influence of whale behavior also provides additional context to ETH’s current price movements. From an on-chain perspective, large holders have been accumulating at the dip, reflected by an increase in aggregate balances by approximately 430,000 ETH at the $3,000 line. This type of behavior is often seen as a strategic move by longer-term capital rather than short-term speculative behavior. Nevertheless, such behavior is also taking place in a macro environment where ETFs continue to experience outflows in Ethereum-based ETFs, thereby dampening institutional demand and creating directional price movements. In a separate instance, a long-dormant whale has also been sending 85,000 ETH to a major exchange, creating intermittent selling risks in the market even though no selling has been executed. This behavior also represents indecision in Ethereum’s market, where whales continue to express interest at lower levels but the rest of the market remains unwilling to commit to new macro trends or ETF inflows. Ethereum’s price movements will likely continue in a range until such a time that whale accumulation results in a breakout or ETF inflows increase significantly.
