Where Are Markets Today?
US and European futures move south today as traders digest a multi-pronged basket of earnings surprises and trade policy developments. At early Friday, S&P 500 futures declined 0.16%, those of the Nasdaq 100 lost 0.23%, while Dow Jones futures declined 0.15%. On European markets, Stoxx 600 futures and those of the DAX also trade edgeward down, reversing earlier rises fueled by earlier hopes of slim U–EU tariff pact. The caution is before a critical US jobs report later today after markets had worried with keen interest the manner news would re-shape Federal Reserve’s stance on interest rate hikes.
Near-term drag is the immediate effect of the newly imposed Retaliatory Tariffs by President Trump, initiated today. These involve 10%–41% tariffs on selected goods and a further 40% tariff on transshipped merchandise. On the quest for more compliance in trade, it put new global uncertainty-all the more so since Mexico is not yet threatened with the 25–50% tariffs on initial exports such as steel, copper, and automobiles. While short-term extension of the deal with Mexico eased most of the panic in the markets, investor demand remains suppressed with cross-border cost structures more uncertain. Corporate-wide earnings volatility made markets subject to weaknesses. Amazon’s 6% after hours loss on weaker-than-expected forward guidance overwhelmed Apple’s 2% gain on robust services and iPhone numbers. Decoupling is symptomatic of performance divergence within the high-technology universe—the definitive “Magnificent Seven,” defying mega-cap titans underpinning health of broader indexes. European markets saw cycle sectors of business suffering the most stress with poor Chinese PMI prints and weak demand outlook deflating businesses with export orientation.
Sentiment in markets over the next few days shall be dictated substantially by non-farm payrolls, July jobs and average hourly wages later today. A disappointing labor report would spark relief rally as it would support later-year Fed policy easing argument, on top of Bessent’s story and Trump’s Fed rant. Strong jobs/wages, on the other hand, might spark new inflation fear, higher yield and pressure on stocks. We at Zaye Capital Markets closely watch prints on economics today as directional spark,—not only futures, but general capital flows on all important global asset classes.
Major Index Performance as of August 1, 2025
- S&P 500: Trading at 5,792.48, down 0.5% on the day.
- Nasdaq Composite: Currently at 18,041.32, down 0.8%, dragged by tech declines.
- Dow Jones Industrial Average: Holding flat at 41,183.09, supported by defensive sectors.
- Russell 2000: Trading at 2,129.74, down 0.3%, reflecting weakness in small-cap financials and healthcare.
The Mag 7 and S&P 500
The “Magnificent Seven” remain quite far apart. Microsoft and Nvidia are relatively flat ex-earnings, while Alphabet and Meta move down double-digit percentages off July highs. Tesla’s 15% decline last week set off group declines as fear of delivery issues and margin compression builds. Meta is down 11% as ad pricing rails lose steam. The group on the whole is down an average 19% off peak highs—the latter of which is a result of valuation compression and fear of AI-fatigue.
The S&P 500 is dragged down since it is over-exposed to tech behemoths. With breadth deteriorating and mega-cap exhaustion taking hold, the index rally is being further made vulnerable with no new leadership off of the value or industrial names.
Drivers Behind the Market Move
As global markets approach the month’s opening bell with trepidation, investors have to navigate through a bumpy blend of geopoliticking, corporate earnings divergence, and macroeconomic expectations. European and U.S. indexes respond to fluid events—from the White House redeployment of tariffs to hopes-generating off of last month’s payroll report. These are the reasons markets have moved as they have.
1. Trump’s Reciprocal Tariff Shock
President Trump’s official announcement of retaliatory tariffs as sweeping as 10% to 41% shocked world trade sentiment. An announcement of an additional punitive 40% tariff on trans-shipped imports through third countries left exporters and global supply chain operators on red alert. Mexico is forced to absorb a tariff of 25% on cars and 50% on steel, aluminium, and copper while America’s producers gear up for margin squeeze as well as possible supply chain disruption. Although 90 days of temporary relief with Mexico allayed broader concern, nervousness persists among other affected partners, such as India and Taiwan, generating defensive positioning in markets.
2. Combined Tech Revenues Raise Sectoral Dispersion
Earnings season offered mixed signals as Amazon fell more than 6% after hours following weak guidance on operating income, while Apple gained 2% on better iPhone and services results. Such divergence in the “Magnificent Seven” is illustrative of weak equity rally leadership. With Tesla and Meta already disappointing throughout the week, investors grow increasingly dubious of the technology sector’s capacity to keep leading the gains in the index—are valuations still stretched and direction of interest rates still uncertain?
3. The Spotlight is on Labour Market Data
All eyes thus now turn to next Wednesday’s July non-farm payrolls, unemployment rate, and average hourly earnings. Yesterday’s month-to-month pick-up in job cutting announcements (+139.8% YoY) increased concern about the persistence of the labour market. A disappointing south employment print today would be enough to support Trump’s and Bessent’s expectations of rate cut justification–supporting rate-sensitive stocks as well as safe-haven assets. Alternatively, positive prints could be at odds with dovish expectations, supporting a rise in equity volatility in European and American markets.
Digesting Economic Data
The Trump Tweets and Their Implications
US President Trump’s recent spate of media sound bites and policy announcements shocked world markets with impact on as far as interest rate expectations as global trade flows. The fact that characterizing Fed Chair Powell as “too late” is an instance of building divergence between macro-economic perception of the executive and dovish perception of the central bank gives credence to pressure on monetary policymakers. Political overhang is acting catalyst on bond markets as much as on rate-sentient valuations of assets, more importantly on commodities, crypto, as much as stocks.
Trump is still fiercely protectionist in trade. Trump asserted that new retaliatory tariffs take effect today, August 1, on vital sectors such as motor vehicles, pharmaceuticals, and heavy metals. The 90-day auto tariff renewal agreement with Mexico involves the extension of a 25% tariff on fentanyl, vehicles, and a broad 50% tariff on steel, aluminum, and copper. Mexico’s removal of non-tariff barriers under the deal is a key concession that Trump positioned as a win for American manufacturing. These tariffs, however, can dampen cross-border volume of trade and raise the cost of American industry inputs—potentially driving inflation and changing patterns of corporate profits. Geopolitically, co-briefing with Mexican President Sheinbaum indicates Trump’s strategic thinking, primarily on energy deals and supply chain sovereignty. Trump’s remark on negotiating Ukraine–Russia war settlement by 8 August, however, added timelines to a basic geopolitical powder keg, stoking investor expectations on defense, energy security, as well as global diplomatic re-shuffling. White House reassurance words that America is “on the right track” with Beijing more stokes hopes of good news on U.S.–Asia tensions, with implications on chip flows as much as on export-driven equity markets.
Overall, these comments sketch out a long-term plan of muscular economic nationalism. Near-term market responses are mixed, but the long-term signpost is as plain as day: Trump is deliberately re-drawing the playing field within trade, monetary policy, and foreign overtures. Investors would do extremely well to be on extremely high guard for volatility—but opportunity—in the areas of especially in sectors of tariffs, crypto policy, energy infrastructure, and currencies. Here at Zaye Capital Markets, we carefully monitor the implications of these realigning dynamics in being able to re-order asset class correlation and sector leadership through the rest of 2025.
Dollar Surges Amid Trade Gains And Policy Signals
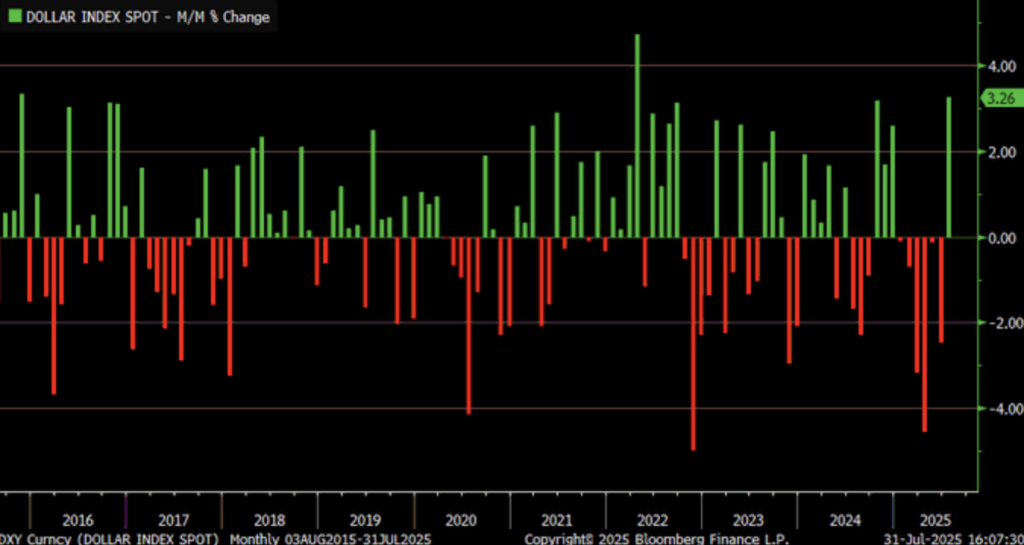
We observed the U.S. dollar recording a robust 3.32% gain in July 2025—its sharpest monthly climb since April 2022—despite a 4.12% year-on-year decline. This rebound appears to stem from a complex interplay of short-term risk aversion and shifting trade dynamics, reinforced by a modest daily uptick of 0.22% to 100.0372. The momentum coincides with fresh trade data showing a significant drop in the U.S. goods trade deficit in June, the lowest in nearly two years. We attribute this to weaker import demand and potential dollar support from reduced external spending, alongside structural labour effects tied to recent policy shifts.
We view it as continuing confirmation of broader volatility cycles followed on the DXY since 2015, responding thus far to tightening cycles, fiscal stimulus, and global uncertainty. The surging dollar has the effect of cutting commodity prices and adds yet more pressure on foreign debt burdens in emerging markets, therefore hampering recovery once more. Global equity flows into the United States can gain traction too as yield spreads increase and the currency strength promotes capital safety.
We continue to consider Caterpillar Inc. ($CAT) as undervalued at these levels. As an exporter of heavy machinery, it lags as the dollar rallies but can catch up on the lost ground as currencies normalize. Investors will be observing cross-border flows, forward-looking estimates of inflation, and any Fed guidance on the path of interest rates on whether the dollar rally is corrective or self-perpetuating.
Persistence Of Inflation Re-Shapes Rate Outlook
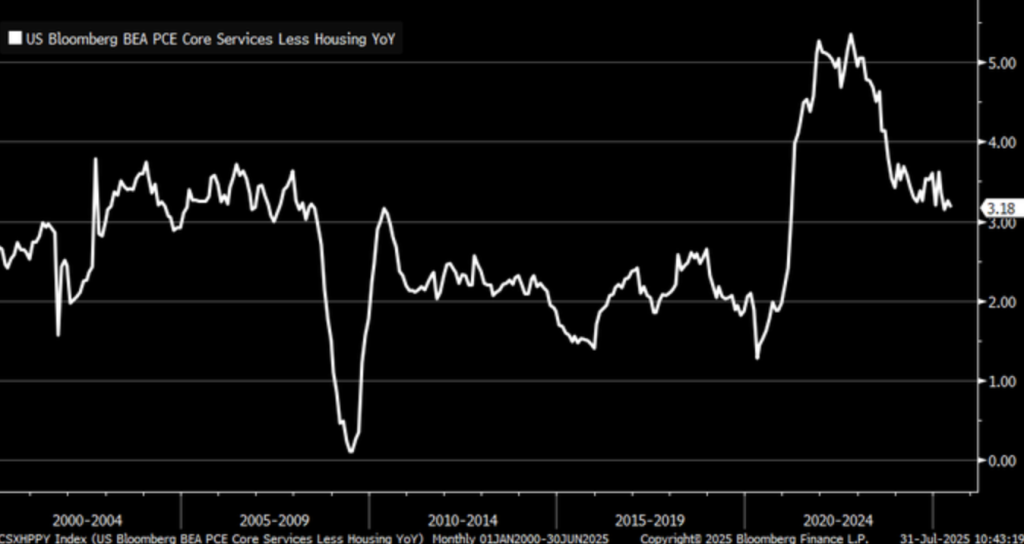
Supercore PCE inflation–a leaner indicator net of dwellings–added 3.18% year ago in June 2025, signaled deviation from Federal Reserve’s 2% goal. Closely in tandem with pay developments, it is an indicator of inflationary stickiness as broader macroeconomic indicators move towards disinflation. The rebound rejects cycle cooling forecasts as being driven by news of being over 2% higher than pre-2020 as being supportive of sustaining demand in services sectors with high labour intensity.
Such growth makes it difficult for the rate path of the Fed. Such post-2008 tendencies ensure supercore inflation never spikes high without eliciting policy response. Even as the headline prints have steadied, the unabating supercore increase, as confirmed by Bloomberg’s house-stripped index, ensures rate cuts to be preterm. Tightness of the labour markets, as it relinquishes at the peripheries, continues fueling cost pressures, menacing preterm cuts with causing an inflation second wave.
Here, Procter & Gamble ($PG) is inexpensive. It is a defensive consumer staple with pricing power that provides insurance through long periods of inflation. Be on high alert later on news of wages, August labor reports, and any Fed discussion of flexibility of policy with services inflation. The supercore trend needs very close attention—the slightest surprise re-acceleration can re-ignite hawkish positioning.
Jobless Claims Signal Labour Resilience, Defy Recession Fears
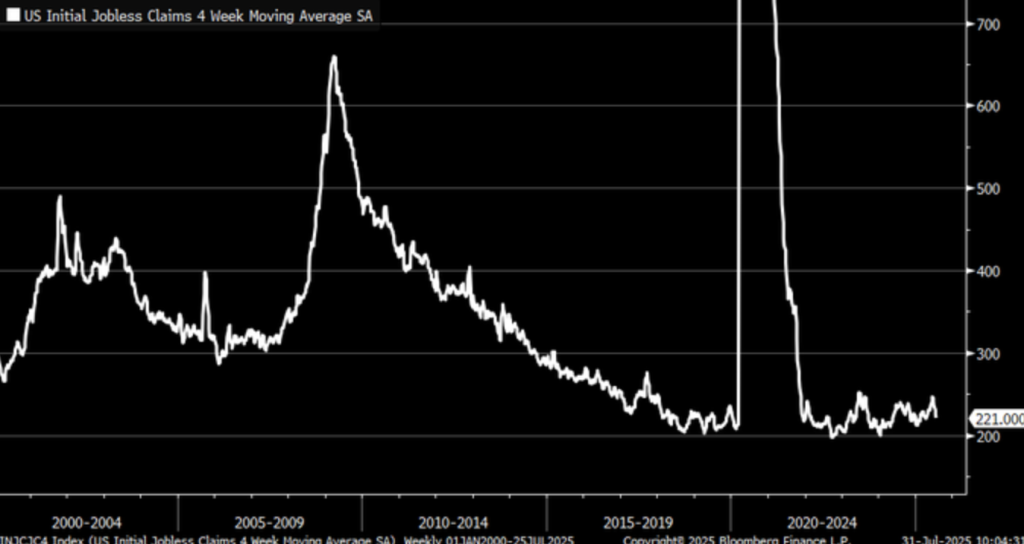
The first U.S. unemployment claims 4-week average dipped below 200,000—the trough since the early 2020 months—the gauge of solid labour market optimism in the face of best recession expectations. A stark contrast with past norms, much more so than the 2008–2009 recession, during which claims breathtakingly breached the 700,000 mark. Such a decrease indicates solid hiring trends and company optimism in the face of top-line economic numbers whose indicators are at variance.
Historically, opening claims of over 400,000 have preceded economic declines, so the under-200,000 pattern currently in play is all the more impressive. Data released by U.S. Employment and Training Administration verifies repeating work maintenance patterns, with corporations loath to lay off employees as pools of talent converge. GDP prints and sentiment gauge may be looking as much backward as forward, but real-time unemployment claims predict the present condition of the underlying economy, and their declining pattern puts doubt on immediate-term prospects of recession.
Here, Home Depot ($HD) is cheap. Its recent shares underperformance is at odds with the robust labour marketplace it occupies—the least of all things being residential activity and renovation is being fueled through hiring. Next month’s nonfarm payrolls, pay rises, and work vacancies all warrant attention by pundits as means of reinforcing labour dynamics such as these as being long-term. A healthy labour marketplace is the method of sidelining recession discussion off or indeed perhaps evading it.
Wage Growth Stable But Underlying Pressures Mount
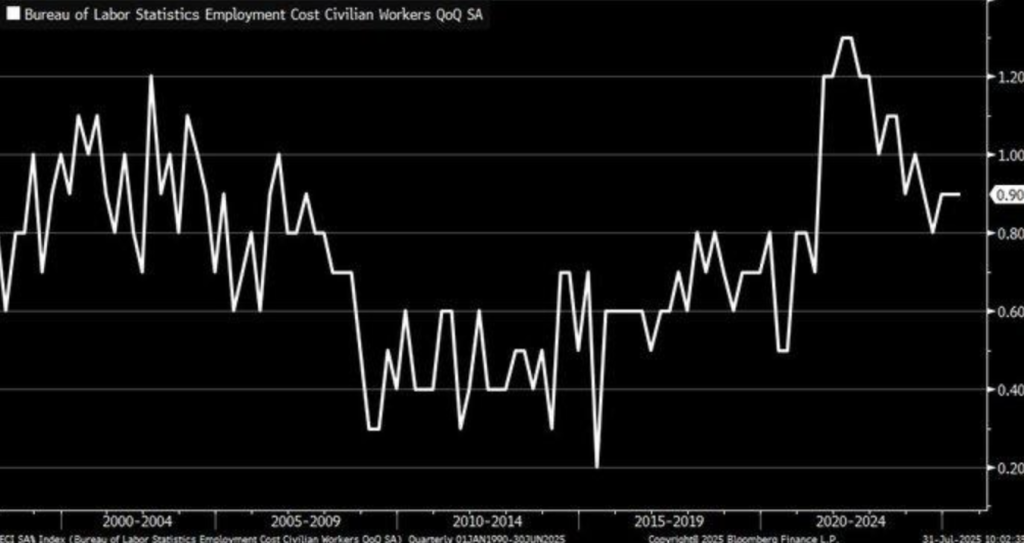
US labor expenses increased 0.9% in Q2 2025, just like in Q1, added the Employment Cost Index (ECI). The flatness is evidence of equally weighted wage and benefit pressure, while macro metrics had shown the cooling of the labor market. The ECI is based on data collected from more than 7,000 non-farm entities and is a broad measure of pay hikes—but is it perhaps hiding larger structural changes under the radar?
A June 2025 U.S. trade deficit decrease is indicative of future GDP tailwinds, but the decrease was more of an outcome of weaker imports, revealing weaker domestic consumption power. Weaker demand can have short-term downward impact on employer compensation plans, most notably in industry sectors experiencing cyclical downturns. As long as pay is kept at a constant rate, decreasing economic production momentum can pressure employers’ capacity to sustain such rates through the latter part of the year.
We think Dollar General ($DG) is value-priced here. Its cost-price selling strategy is underpinned by cost-price and cash-strapped consumers. Investors ought to be looking out for forthcoming unit labour cost numbers, July retail sales, and immigration-driven labour market numbers. They will inform them whether wage durability persists—or trailing indicator set to temper.
Microsoft’s $4t Milestone Signals Ai’s Long-Term Value Shift
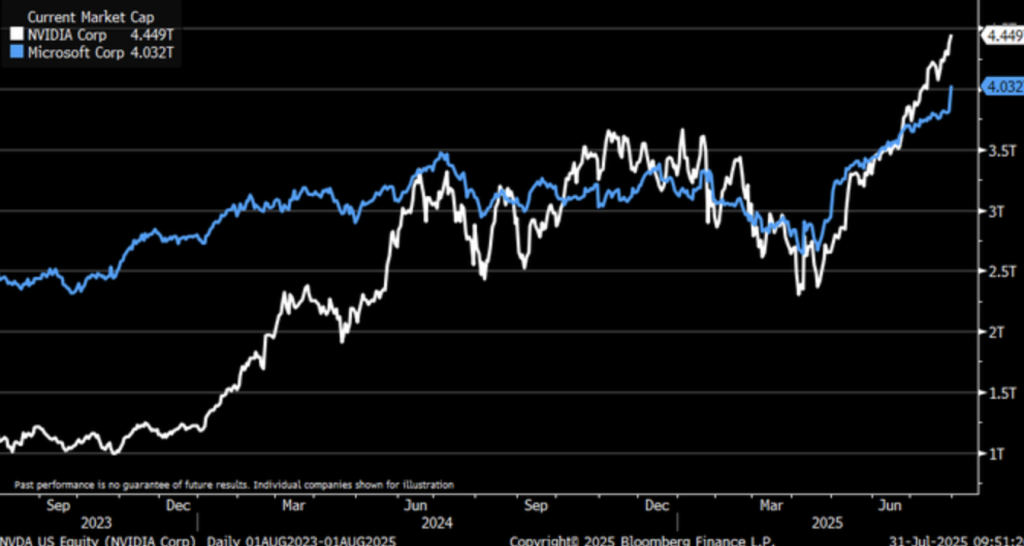
Microsoft at last breached a $4 trillion valuation threshold on the back of 34% year-to-year Azure cloud revenue growth to more than $75 billion annually. The milestone–a month after Nvidia’s corresponding crossing–also serves as an indicator of the structural leap of AI-driven enterprise demand. Anything but peaking, however, momentum is more signaling that generative AI infrastructure is more than a episode of euphoria but indeed an imperative redefinition of company expenditures on technology.
Microsoft’s projected $30 billion Q3 2025 capex validates this shift, as does concurrent investment among other industry titans—the latter of which would more accurately be termed buildout of sustainable ecosystems and not speculative overreach. Where this phase differs is infrastructure emphasis: companies are not merely testing AI but integrating it into cloud infrastructure and productivity suites. Such deployments would be a harbinger of productivity gains that would percolate through service-oriented as well as industrial foundations in the coming quarters.
In this backdrop, we consider Salesforce ($CRM) to be under-valued. While too frequently ignored in tandem with hyperscalers, their SaaS enterprise approach enjoys AI integration tailwinds in the form of automating the customer relationship. Analysts need to monitor mid-tier firm cloud capex expenditure on allocation, quarter-to-quarter margin actions in AI-focused industries, and the depth of AI adoption yielding steady revenue productivity payback. The $4 trillion club could be only at the start of a long capital rebalancing cycle.
Copper Plunges As Tariff Exemption Triggers Short-Term Unwind
Copper futures sank sharply 19.1% to $4.517 per pound on July 31, 2025—which is one of the sharpest month declines in years. The sharp correction happened after the U.S. government re-imposed an exemption of previously-announced 50% tariff on copper cathodes, effective Aug. 1. The action wiped out speculative positioning on hopes of trade restrictions, causing a marketplace repricing. A policy-driven reaction, it reflects risk sentiment’s frailty among top industrial commodities.
That selloff is in sharp contrast to earlier bullish expectations, where Fed rate cuts and Chinese infrastructure stimulus were being tallied up as leading tailwinds. What did happen instead was the month-on-month 14.27% loss in July, arguably as much as signaling a break in long-term EV trends over short-term trade policy developments. Shorts brought down the over-extended rally with tariffs rolled back, reifying the point that markets are still on commodities high alert with continuing geopolitical fine-tunings.
In this volatile configuration, we consider Freeport-McMoRan ($FCX) to be undervalued. As low as the price fell, its cost curve and structural significance to worldwide copper supply sit well for a pop when fundamentals again take hold. We would be watching pre-emptive worldwide trade statistics, China stimulus roll-out, and inventory action at the London Metal Exchange for signs of when the price stabilizes versus structural demand hitting the energy transition.
Shrinking u.s. Savings rates highlight consumption risk ahead
US personal saving rate as a percentage of disposable income declined as low as 4.5% in June 2025, down sharply from the pandemic peak at 33% in April 2020. It is representative of the overall economic trend in that pandemic-era fiscal buffers have had their day and are now consumption-driven terrain. While high expenditure in the short term sustained growth, consumer financial cushion depletion is representative of rising fragility in long-term economic resilience.
History comparables, including the post-stimulus curve of Kosovo, have registered saving rates more often than not as being lesser than spending pressures and poor capital formation. Despite certain Federal Reserve interest rates, the slim saving ratio is foreboding for the ultimate retirement horizon, as far as pay increases flag or reaccelerations of inflation occur. Even as today’s deposits earn close to 5% APY, the private sector’s capacity—or desire—to replenish buffers of capital is limited as things stand.
We consider Charles Schwab Corporation ($SCHW) to be under-valued at this point in time. As both retail brokerage and high-yield cash management market leader, it can gain from increased interest income and possible change of direction in the direction of financial prudence. The analysts would need to watch household debt, consumer credits in July, and retail bank flows in order to determine if the current selloff is the beginning of the new normal or an interim bottom in attitudes towards house saving.
Trade Policy Uncertainty Eases, But Market Scars Remain
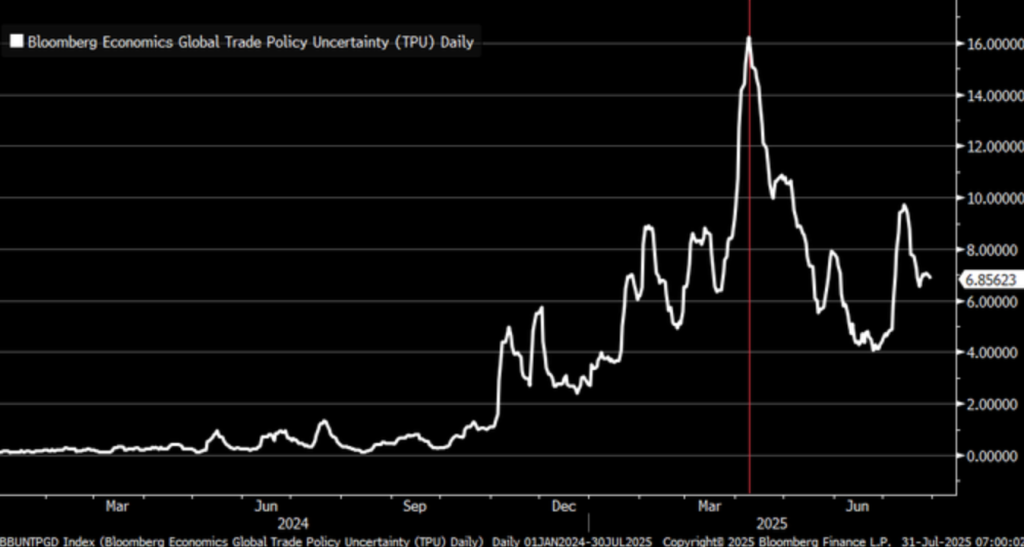
The Bloomberg Economics Trade Policy Uncertainty Index spiked at a record high in early 2025 as markets were wary of rapid U.S. trade aggression like tariff threats that shook global supply chains. But the precipitous falls through July 31 more closely resemble the opposite of that scene, much as behavior finance laws matching emotional euphoria with corrections. The flipped-about reversals indicate markets have priced in policy predictability—or at least momentary stability—their peak episode of peak geopolitical unpredictability.
Historical TPU reaction after 2008 crisis has enduring impacts on business outlook and investment long after the passing of headline uncertainty. The latest moderation of the index may be more reflective of investors’ re-positioning than normalization of the risks. The UNCTAD forecast of world trade of $33 trillion in 2024 is today subject to dis-aggregation as companies re-position capital expenditures with changing trade blocs and tariff regimes, especially as it pertains to high-technology advanced goods and prime primary materials.
As such uncertainty-to-stability transition is on the horizon, we mark Emerson Electric ($EMR) as undervalued against equilibrium. It enjoys global diversification and infrastructure-automation exposure but is presently priced below history while fundamentals continue to support. Analysts will need to monitor future trade agreements negotiations, August PMI export components, and multinational guidance on profits for clues on whether such TPU weakness is bringing on real normalisation—the calm before the next geopolitical storm.
Yield Curve Signals Stagflation Risk As Policy Pressures Build
U.S. Treasury yield curve 2- year vs. 10- year bond yield spread fell to its lowest since mid- April 2025 on Thursday, confirming marketplace assumptions of economic slowing. Curve inversion, where short- term lending is more expensive than long- term, had in the past signaled recessions and reflects investor skepticism over future growth prospects. The fall is also accompanied by rising policy- induced uncertainties, primarily tariffs and regulatory shifts remapping corporate cost structures and inflation expectations.
Recent American protectionist actions have stoked stagflationary currents: higher input costs, cautious hiring, and declining output. The modest June 2025 goods trade deficit decrease, while positive in the headline sense, is hiding declining import demand as businesses delay capital expenditures in reaction to unforeseen policy developments. The caution is accompanied by changes in the labor markets all the way to immigration reform that brake the growth of the labor supply without unwinding wage pressure.
For this, we view 3M Company ($MMM) as currently undervalued. The company’s cycle-prone and product-diversified business is likely to suffer in yield inversions but is capable of recovering once direction in policy takes hold. Investors would be paying attention to the Fed’s inflation guidance, demand at Treasuries auctions, and upcoming ISM manufacturing data in their estimation of by how much markets already factor stagflation. The curve is all it says: capital is getting riskier—a good thing.
Tech Layoff Surge Reflects Early Stage Of Ai-Led Labour Reset
US layoff announcements surged 139.8% year-over-year in July 2025 as counts surged 47,999 in June to 62,075. The IT sector led the way with more than 13,000 redundancies as it concluded an existential structural change instigated by the rollout of AI. Whereas June had seemed relatively subdued, the sharp spike in July is an omen of an undeniable tilt towards automating, cost rationalization, and restructuring of personnel.
Rationalization by AI is speeding up world corporate restructuring. More than 4,550 technology layoffs were reported in one week alone, reports news covering the linked imperative of the transition. While automation is killing off industries of rooted employment, it is sowing seeds of future productive gain. Historically similar and recent studies indicate present dislocations as part of an interlude of adjustment, with short-term labor distress to be balanced by more economic benefit in the coming few decades.
As we go into this transition phase, we see Oracle Corporation ($ORCL) as under-priced. With being right at the very forefront of the cloud and AI rollout, sentiment remains lagging in the face of tech lay-offs. Its solutions to the enterprises address precisely the very efficiency turn that creates redundancies. Analysts would watch nonfarm payrolls throughout August, hiring in industries off technology, along with company AI capex commitments, in anticipation of whether thoselabour realignments peak—or have yet to begin.
UPCOMING ECONOMIC EVENTS
Core CPI Flash Estimate y/y, CPI Flash Estimate y/y, Average Hourly Earnings m/m, Non-Farm Employment Change, Unemployment Rate, ISM Manufacturing PMI, ISM Manufacturing Prices, Revised UoM Consumer Sentiment
Impacting at the beginning of an important part of the economic calendar, investor attention through the period will be on a string of high-impact indicators capable of either solidifying expectations of the soft landing or re-igniting stagflation concerns. From inflation outlook through labour markets all the way to manufacturing activity, the resultant data through the period of the week can trigger re-considerations on monetary policy anticipating, position within markets, as well as risk willingness. Here is how each of the releases can buoy markets depending on whether the numbers beat or miss forecasts:
Core CPI Flash Estimate y/y & CPI Flash Estimate y/y
The flash inflation prints are previewing inflation direction by Fed.
- If final numbers surprise with hotter numbers, investors can look for sustained rate hold or further tightening, particularly if core prices keep creeping higher on their own merit regardless of volatile segments like food and energy. The growth stocks—the general tech stocks—their valuations would suffer, whereas the U.S. dollar would gain.
- If numbers come in lesser than expected, disinflation bets will take hold. The move would lift equities all over, particularly rate-sentient sectors like real estate and consumer discretionary, while also pushing yields down and underpinning gold.
Average Hourly Earnings month/month & Non-Farm Employment Change
Labor market robustness is one of the cornerstones of American economic strength.
- A higher-than-anticipated print on employment/wages would solidify that the labor market is no more cooling down as fast as many assume—not just boosting the risk of inflation and maybe supporting the Fed to keep on hard-money track. That would be beneficial for cyclicals headed by financials, but would reduce hopes for rate cuts in the near future.
- Weaker-than-stated wage increases or employment, on the other hand, would be the very first indication of economic fatigue. That would support safe-haven demand for government paper, while benefiting technology and growth stocks, top performers in down environments.
Unemployment Rate
- A lower unemployment figure may offer short-term confidence in labour market stability, but it could also complicate the Fed’s inflation-fighting path.
- Should the rate unexpectedly rise, it could signal underlying fragility in hiring and earnings power, reinforcing a cautious stance. Markets may respond with a flight to safety—strengthening utilities and healthcare, while dragging on banks and consumer cyclicals.
ISM Manufacturing PMI & ISM Manufacturing Prices
ISM PMI will shed timely light on the real economy.
- Healthy PMI reading would be good news on industrial output resilience during trade friction and policymaker confusion, underpinning optimism on final GDP growth. But increasing manufacturing expenses would also spark renewed inflation fear, more severely on input prices.
- Below-estimate readings would re-ignite fear of sputtering industrial core, pulling down commodities as well as energy shares, and cementing forecasts of weaker global demand.
Revised UoM Consumer Sentiment
This index gauges how confident consumers feel about the economy’s direction.
- An upward revision would validate expectations of steady spending and support for services sectors. Retailers and travel stocks could benefit.
- However, a downward revision would reflect growing public anxiety over prices, jobs, or policy uncertainty. This could reduce risk appetite broadly and strengthen defensive names, while weighing on small-cap and consumer discretionary stocks.
During the week, we would like to observe non-symmetric market response—the greater sensitivity of inflation positive shocks and growth negative shocks. Analysts ought to be focusing on headline-to-core inflation spreads, labour markets breadth, and factory order backlogs. This data stage can impart form to rate fate, rotation of assets, and investor sentiment as well.
EARNINGS
Yesterday’s Earnings Recap – July 31, 2025
(AAPL, AMZN, MSTR, SO, NET, EXC, XEL)
- Apple Inc. (AAPL)
Apple reported strong fiscal Q3 earnings with revenue of $93.2 billion and EPS of $1.28, surpassing forecasts. The upside was led by robust iPhone 16 Pro Max sales and services expansion. However, a 7% decline in iPad sales in China dampened sentiment. While overall margins improved modestly, investors remain focused on Apple’s regional performance and how services will offset hardware saturation.
- Amazon.com Inc. (AMZN)
Amazon exceeded expectations with $146.9 billion in revenue, driven by a 17% year-on-year surge in AWS, reflecting accelerated AI adoption across cloud services. Despite this strength, its core e-commerce business remained stagnant, sparking concerns about the longevity of retail momentum. Operating income guidance was maintained, but investors are now watching advertising and logistics for the next growth lever.
- MicroStrategy Inc. (MSTR)
MicroStrategy turned heads with a surprise profit of $76.3 million, reversing a $32 million loss year-over-year. This was largely due to gains from Bitcoin holdings, which now stand at 243,000 BTC. However, a 3% drop in software revenue signals weakening core business demand. Markets continue to question the sustainability of its Bitcoin-centric strategy.
- Southern Company (SO)
Southern reported earnings of $0.81 per share, slightly beating expectations. Despite lower residential consumption tied to mild weather in the Southeast, ongoing infrastructure upgrades offered some balance. With guidance unchanged, attention turns to seasonal demand and regulatory developments across southern grids.
- Cloudflare Inc. (NET)
Cloudflare posted a strong 29% year-on-year revenue increase to $417 million. While topline growth beat estimates, widening net losses due to heavy AI infrastructure investments raised investor concerns. Though customer acquisition remained healthy, profitability pressures persist and could weigh on the next quarter’s outlook.
- Exelon Corp. (EXC)
Exelon delivered $0.68 per share in line with expectations. The company’s investment in transmission and grid modernization helped counter lower industrial power demand. Regulatory outcomes, particularly in Illinois, remain a key focus as the company adjusts its long-term capital strategy.
- Xcel Energy Inc. (XEL)
Xcel beat slightly with EPS of $0.56. Continued investment in renewables and grid reliability was welcomed, though severe weather disruptions affected residential usage metrics. Management reaffirmed its capex outlook, with attention shifting to cost recovery and policy alignment in energy transition efforts.
Today’s Earnings Preview – August 1, 2025
(XOM, CVX, LIN, CL)
- Exxon Mobil Corporation (XOM)
Exxon is set to report amidst margin compression across refining segments. However, strength in upstream production, particularly in Guyana and the Permian Basin, could help balance the books. Investors will be focused on capex discipline and any signals around dividend growth or capital returns amid volatile oil markets.
- Chevron Corporation (CVX)
Chevron faces headwinds from lower LNG prices and regulatory friction in Australia, potentially weighing on its earnings. While upstream output is expected to hold steady, downstream profitability may underperform. Markets will watch free cash flow closely, especially against the backdrop of capital allocation and future investment outlooks.
- Linde PLC (LIN)
Linde’s results will be scrutinised for clues on global manufacturing activity. Pricing strength in industrial gases and performance in Asia will be in focus, alongside margin stability. Currency effects could be a swing factor this quarter, particularly in light of recent euro-dollar fluctuations and regional demand variations.
- Colgate-Palmolive Company (CL)
Colgate is anticipated to post stable top-line growth with steady volumes. The spotlight will be on how it manages cost pressures in emerging markets and whether pricing power can sustain margins. With rising competition in the staples sector, investors are keen to hear updates on international demand, FX impact, and margin preservation strategies.
Stock Market Summary – Friday, 1st August 2025
US equity markets begin abysmally in quite new month with chronic inflation stickiness concerns, world trade tension, and worsening breadth of tech leaders still preserving pressure. Earnings season, however, still provides pockets of optimism, but the atmosphere remains strained as President Trump reaffirms actions on trade–in the shape of 25% tariff on Indian imports today–again fueling international diplomatic pushbacks. Investors grapple once more with the sequence of economic indicators bolstering hopes of slowing-but-not-stopping economy.
Stock Prices
Geopolitical Changes and Economic Markers
Today’s session opened under pressure of macro indicators that blur the Fed’s way. The latest wages and the latest UoM consumer sentiment survey indicate an economy slowing down yet still suffering from persistent inflation. The tariff expansion of President Trump has, in turn, provoked threat of reprisals by India that add to an overarching atmosphere of trade fragility already amplified by Brazil sanctioning and by allies of the commodity. The geopolitical situation is sparking defense positioning of stocks and pushing on sectors of the cycle.
Recent Share News
- Apple Inc. ($AAPL) Even following healthy profits, Apple stocks are on the back foot after the news of iPad China sales slowdown. Investors are keenly observing whether high end iPhone devices and services demand would compensate for the regional weakness. The share drops by close to 11% from July highs.
- Amazon.com Inc. ($AMZN) Amazon had a good AWS quarter, but e-commerce sales growth flattened as it prompted a series of downgrades by various analysts. The stock fell down close to 2.1% today as investors ask whether AWS is sufficient to trigger valuation beyond 3Q.
- MicroStrategy Inc. ($MSTR) Topped by surging Bitcoin prices, MicroStrategy climbed 4% in morning trading. Yet the volatility persists as the market decides if its crypto-laden balance sheet can weather it.
The Mag 7 and S&P 500
The “Magnificent Seven” remain quite far apart. Microsoft and Nvidia are relatively flat ex-earnings, while Alphabet and Meta move down double-digit percentages off July highs. Tesla’s 15% decline last week set off group declines as fear of delivery issues and margin compression builds. Meta is down 11% as ad pricing rails lose steam. The group on the whole is down an average 19% off peak highs—the latter of which is a result of valuation compression and fear of AI-fatigue.
The S&P 500 is dragged down since it is over-exposed to tech behemoths. With breadth deteriorating and mega-cap exhaustion taking hold, the index rally is being further made vulnerable with no new leadership off of the value or industrial names.
Major Index Performance as of August 1, 2025
- S&P 500: Trading at 5,792.48, down 0.5% on the day.
- Nasdaq Composite: Currently at 18,041.32, down 0.8%, dragged by tech declines.
- Dow Jones Industrial Average: Holding flat at 41,183.09, supported by defensive sectors.
- Russell 2000: Trading at 2,129.74, down 0.3%, reflecting weakness in small-cap financials and healthcare.
At Zaye Capital Markets, we continue to advise a cautious stance—focusing on balance sheet strength, margin durability, and geopolitical risk mitigation. Until market breadth improves and policy clarity emerges, equity rallies are likely to remain fragile and highly sector-dependent.
Gold Price Today – Fri, Aug 1, 2025
Gold sits at $3,298.47 an ounce currently, 0.6% higher on the day, as safe-havens demand spikes with fresh geopolitical stress and building expectations of Federal Reserve reversals. The hardline rhetoric of President Trump on tariffs—the 50% tariffs on Mexican copper, steel, and aluminium—their tit-for-tat trade reprisals and hard drug requirements have all stoked investor fear of global supply lines. Leaked talks with Mexico’s President Sheinbaum and White House leaks of breaking agreements with China and the UN have pretty much cemented the market’s doubt. At the same time as all of that, Trump’s criticism of Fed Chair Powell and rate cut suggestions later in the year have produced a dovish rate expectations flip, cutting the cost of owning gold and re-energising its upward trajectory.
Tomorrow’s flash core CPI, non-farm payrolls, and wage growth forecast will be the trigger for gold’s next move. Weaker-than-forecast prints can cement in the market’s psyche the view of Fed rate cutting and gold higher, while hotter figures can generate near-term consolidation. But underlying economic vulnerability—the follow-through on yesterday’s hard jump in layoff increases and ongoing fears of the integrity of inflation—is ongoing to drive defensive positioning. Gold remains an attractive hedger not just against interest rate risk but against macro and geopolitical risk more generally that pervades trade, manufacturing, and global diplomacy. Where we sit at Zaye Capital Markets, current conditions still justify gold’s strategic attractiveness, not least with real yields stabilizing and inflation proving stubborn.
OIL PRICES – Friday, 1 August 2025
Crude is trading at around $71.74 per barrel for Brent and $69.27 per barrel for WTI as markets weigh the impact of Trump’s hard-line trade stance and escalating geopolitical tension. While prices fell yesterday in reaction to historic high U.S. crude inventories and historic 13.49-mm-bpd production, selling was moderated by concern about Russian sanction and supply restriction. Trump’s latest tariff threat, such as 50% tariff on Mexican metal and potential penalty on Russian oil consumers, is stoking supply-side fear. OPEC+, in turn, is raising output incrementally—the 548,000-bpd increase through September,—which has taken the edge off some of the bullish apprehension, leaving the oil in a fairly tight range.
The previous day’s economic readings—the higher-than-anticipated sacking of jobs and ongoing pay increases—contributed investor unease over U.S. demand prospects, reversing sentiment against crude. The larger picture is a weaker consumption rebound, more so if consumers turn back under mounting cost pressures. Today’s first-tier news—the flash CPI, non-farm payrolls, and ISM manufacturing—their prints will typically guide oil price action. A weak print could beat down demand expectations and leave oil in the selling zone, while elevated numbers could drive prices up on short-term expectations of increased economic activity. But overall impetus is Trump’s unpredictability on trade and geopolitical crossfire, each of which leaves the energy markets in limbo in terms of volatility.
Bitcoin Price – Friday, 1 August 2025
Bitcoin is up at $118,630, defying the over $118,000 ceiling as institutional conviction picks up and macro stories become more crypto-bullish. Trump’s recent Fed criticism in terms of framing Powell as “too late” and Bessent’s suggestion of rate cutting by year end are fueling hopes of long-enduring monetary ease. Such dovish green lights cut real interest rate expectations, and as such, remain a primary bullish trigger of Bitcoin, whose home is places of low rates/high liquids. Trump’s tough stance on Mexico’s tariffs and general global tensions have meanwhile re-added volatility to traditional markets, driving a rotation into decentralized, non-sovereign assets such as Bitcoin. Crypto is gaining as a macro hedging vehicle through it all, especially in challenging policy cycles.
On the regulatory side, high-order SEC and White House communications are changing perceptions. The SEC’s “Project Crypto” establishment and rule-making on digital tokens and the White House Crypto Working Group leadership have brought legitimacy and added importance to the relevance of Bitcoin in today’s economics. An era of institutional acceptance is heralded by Tether’s $2.6 billion in revenue on Bitcoin and gold reserves and Michael Saylor’s articulation of an era of “hyper-adoption.” At the same time, almost 25% of CFOs anticipate using crypto in 2027, per Deloitte, affirming long-term structural demand. Yesterday’s economics reads—are rising layoff announcements and stick wage increases—the macro fragility risk complemented capital flows into inflation-proof off-ramps such as Bitcoin. Today’s payroll and inflation prints will drive near-term flows, but regulatory momentum, institutional foundation, and geopolitically-driven tensions in effect keep Bitcoin’s ecosystem firmly in expansionary mode.
ETH PRICES – Friday, 1 August 2025
Ethereum is at $3,854 with positive weekly performance remaining despite recent declines within the past 24 hours. Spot demand by institutions remains at the top, with net inflows of $2.3 billion having occurred within the past week alone for spot ETH ETFs. BlackRock’s ETHA fund had logged noticeably 59,309 ETH on the 29th of July, propelling holdings past 3 million ETH—a healthy sign of long-term plans. At the same time, on-chain whale activity indicates continued accumulation as wallets have registered 790,000 ETH (∈ aprox. $2.89 billion) within 20 days. Also at nine-year lows within exchange reserves, indicating fading sell pressure and shifting supply narrative of tightening underpinning Ethereum’s institutional bullish tone.
In spite of such accumulative rally, Ethereum remains range-bound above the important $3,900 resistance area as spot open interest of ETH futures jumps, gaining 40% of combined market share, last recorded in 2023. Breakout target of $5,140 is anticipated by the technical analysts on the heels of support around $3,300 holding good, supported by whales’ activity and ETF demand. Such volatility of price would scale higher on macroeconomic news releases or regulatory news affecting risk appetite. On the whole, convergence of ETF flows, whales’ long-term holdings, and declining exchange supply keeps ETH on the bullish momentum trajectory, subject to breaking of key resistance points and persistence of its on-chain bullish setup.
