Where Are Markets Today?
Stock futures were little changed to lower Tuesday morning as investors hedged before the highly anticipated U.S. consumer price index reading. In the United States, Dow Jones futures increased 39 points, or below 0.1%, S&P 500 futures decreased 0.12%, and Nasdaq 100 futures decreased 0.21%. In Europe, Euro Stoxx 50 futures decreased about 0.2%, FTSE 100 futures decreased 0.15%, and DAX futures were soft. This cautious approach is characteristic of a global market reluctant to go whole hog in either direction until inflation data provides more definitive direction on the course of policy.
Of more concern are the July CPI print numbers, and economists expect headline inflation to rise 0.2% month-to-month and 2.8% year-over-year and core CPI 0.3% m/m and 3.1% y/y. A larger-than-expected reading has potential to pressure the Fed into keeping monetary policy restrictive tilted even more and ruin rate cuts expectations throughout the rest of the year. Conversely, if the reading is subpar then the case for unwinding would be bolstered and potentially create risk-on mood. For the time being, until such reports are out, futures go defensive due to traders not further extending valuations of already nearly record stocks.
Mood has further been moderated in Europe by weak German ZEW Economic Sentiment data, which implied business optimism was fading in the eurozone’s biggest economy. These data are supporting worries about the sustainability of Europe’s recovery, particularly against the backdrop of persistent global trade tensions. European futures are thus shadowing U.S. caution and investors are awaiting any carryover of the U.S. CPI print into ECB policy expectations and eurozone yields.
Although President Donald Trump’s renewal of the 90-day reprieve of the greater tariffs of Chinese imports gave some short-term tranquility to the trade, in large measure markets took little notice in preference to macroeconomic forces. Fears of what occurs at the date of expiration of the reprieve, together with inflation battles by central banks, has maintained a brake on Risk Appetite. For Zaye Capital Markets, we classify U.S. and European markets as set to undergo some volatility, and the course the day’s trade took was contingent on either inflation data confirming dovish expectations or stoking another hawkish revision.
Index Performance up to Tuesday, 12th of Aug., 2025
- S&P 500: 5,832.14, down 0.3%
- Nasdaq Composite: 18,175.62, down 0.5%
- Dow Jones Industrial Average: 41,201.77
- Russell 2000: 2,142.58, off 0.2%
The Magnificent Seven and the S&P 500
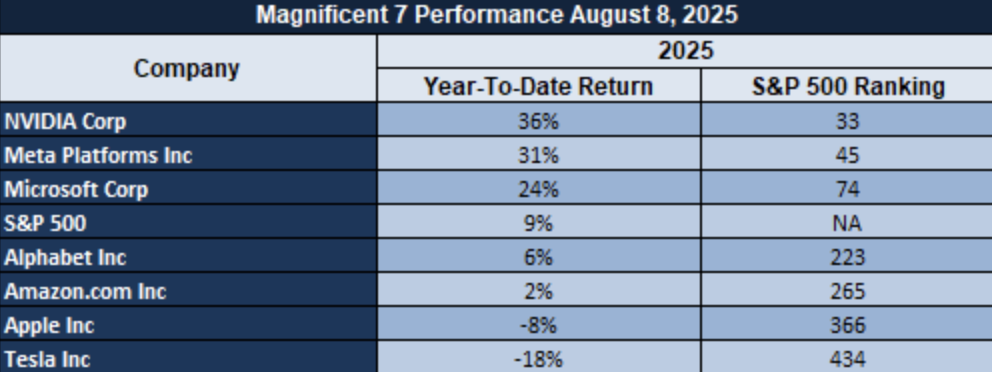
The “Magnificent Seven”–Apple, Microsoft, Nvidia, Amazon, Meta, Alphabet, and Tesla–are still under duress, averaging an 18% pullback from recent peaks.
Tesla and Meta are the top decliners as profit-taking continued to hurt growth and AI stocks.
Lacking fresh mega-cap leadership, the S&P 500’s rally has been contained despite support from energy and industries.
DRIVERS BEHIND THE MARKET MOVE
As markets open, sentiment remains cautious on both sides of the Atlantic, shaped largely by today’s impending U.S. inflation data, ongoing geopolitical developments initiated by President Trump, and recent signals from European economic indicators.
- Inflation Uncertainty:
Markets are looking for today’s US CPI release, with headline CPI forecast to print 0.2% m/m and 2.8% y/y, and core CPI 0.3% m/m and 3.1% y/y. There is a 89% probability of a rate cut by the Fed in September, but surprise will move expectations very quickly indeed. This is inducing risk-off US and European futures positions.
- Trump’s Policy Clues:
President Trump prolonged the 90-day reprieve of the larger Chinese tariffs, soothing short-term trade nerves, but smoke and mirrors are thick on the horizon. President Trump’s law-and-order prescription of Washington, D.C.—with an invocation of the Home Rule Act, invocation of the National Guard, and “Liberation Day” designation—infuses another degree of complexity into the politickerecipe. Investors are plowing through said short-term calm and long-term murkiness.
- European Growth Sentiment:
Below-estimate German ZEW Economic Sentiment releases are indicating falling euro business sentiment, retreating regional market sentiment. Coupled with the persisting global trade tensions, it is affirming risk-off sentiment in European futures as markets anchor further spillovers of the day’s U.S. CPI report.
Markets generally remain steady with hopes of resolution to inflation, policy uncertainty, and bearish growth sentiment—letting a “wait-and-see” environment prevail until information or news brings an end to the stalemate.
Digesting Economic Data
The TRUMP Tweets And Their Implications
President Trump’s series of remarks in recent days constitute one of the strongest displays of federal power in Washington, D.C., in decades. In proclaiming his acts a “Liberation Day,” he promised an end to violence, referred to the border as “fixed” and appeared to put the city under direct federal control. With the invocation of the Home Rule Act, sending in the National Guard, and the issuance of emergency curfews, Trump has actually been successful in recomposing the capital’s security apparatus. As bold acts toward the reassertion of order, these are viewed by his base, but with fears of the political and legal consequences of going around area authorities, his critics caution.
The economic impact of these actions is twofold. On one hand, the extension of the U.S.–China trade truce by 90 days injects short-term stability into trade flows, easing some pressure on global supply chains. This temporary reprieve supports risk assets by maintaining open channels for high-value imports and exports. On the other hand, Trump’s refusal to commit to a longer-term extension of tariff relief introduces uncertainty that could restrain corporate investment decisions and cap market optimism. Businesses reliant on stable trade terms may find themselves in a holding pattern until greater clarity emerges.
Geopolitically, Trump’s attempts to pressure Russian President Vladimir Putin to sign off on ending Ukraine conflict, possibly with Ukrainian President Zelenskyy engagement in dialogue, represent a potential watershed in the politics of Eastern Europe. It is the type of news that can potentially move energy markets, e.g., oil and gas prices, if diplomatic success alters supply risk premiums in either direction. The uncertainty of such talks, however, puts market players on edge with the potential for tensions to spill over when there is no binding commitment on the line.
From an investment point of view, the mix of aggressive home security initiatives, selective trade mutualism, and high-stakes foreign policy strategery is a volatile macro environment. Markets will receive intermittent shocks linked to euphoria surrounding trade and diplomatic initiatives but has underlying uncertainty of such policy action as a driver of defensiveness. Safe-havens like gold are likely to continue to receive a boost, and risk assets will likely stay extremely sensitive to each following administration policy hint.
CPI Trends Suggest Possible Shift in Fed Policy
We see July base Consumer Price Index register slower 0.3% from the previous 0.4%, suggesting potential relief in inflation pressures. It has traditionally preceded Fed rate reductions if we take history back to a string of moderation for a period of seven months of sub-3% CPI, like in 2001. This anticipated slowdown has raised expectations of policymakers unwinding in months ahead, except the trend persists and the bigger picture indicators are in sync.
But CPI small increases and monetary tightening have traveled together in the past, and a 0.1%-plus advance has previously usually been followed by a 25-basis-point hike in rates. But if prevailing rate-hike expectations are realized, the case for another rate hike disintegrates and rate-sensitive groups like technology and consumer discretionary stocks can shine. But we see disputes regarding CPI quality of measurement, and inter-urban and inter-rural set data gaps, and these can overflow into market thinking.
From a macroeconomic fundamentals standpoint, we think PayPal Holdings (PYPL) is cheap with its multiples still trailing wider market multiples even though it has maintained transaction volume and remained cost-sensitive. Expect confirmation of continued inflation moderation in future CPI releases and in Fed speeches to further drive the action in rate-sensitive stocks. #CPI #Markets
Global Food Price Surge Reignites Inflationary Risks
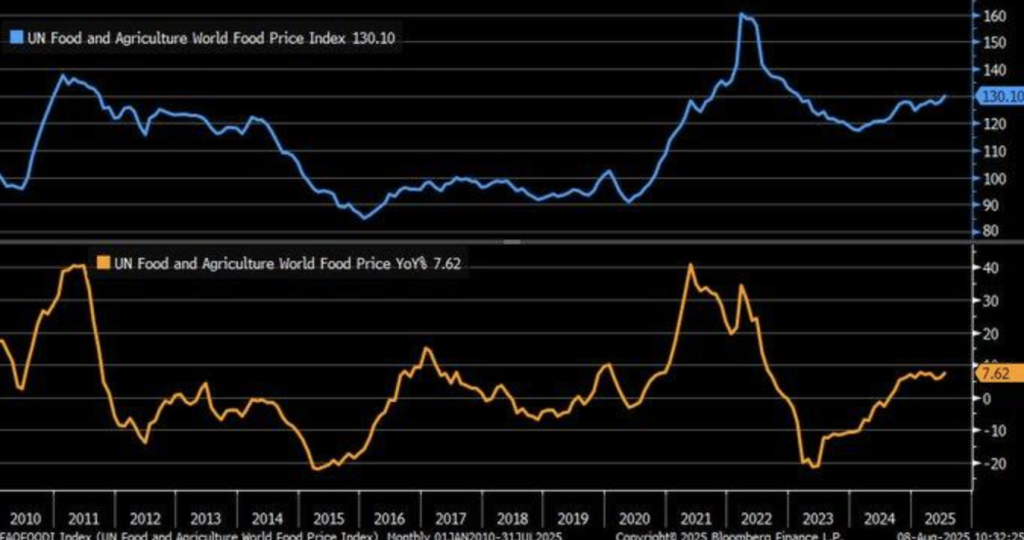
We observe that in July 2025, the World Food Price Index increased 7.6% on-year, the highest rate of increase since the beginning of 2023. The recovery is a result of persistent supply shocks, with the effect of low grain exports still evident in the world market. Underlying climatic conditions have added a further source of stress, destroying farm output and driving staple food prices higher again, suggesting spillovers into broader inflation measures.
Inflationary pressure of food prices deserves extra concern due to spillover effects onto other cost components of consumer baskets. Central banks’ disinflation narrative may get hard if the tendency goes on and further cautious rate cuts are required in such a case. We are aware of methodological disparities of food price statistics reporting worldwide, and they distort headline series, but directional risk is to the up side.
Here, we have Kellogg Company (K) because underpriced and diversified product portfolio offers buffer against volatility of cost of raw materials via cost-plus trend of money. Pressure in sugar and grains segments would need to persist and create another batch of concerns regarding broader inflation and remake rate expectations. #Inflation #Commodities
GLOBAL FOOD PRICE SURGE THREATENS TO STALL DISINFLATION MOMENTUM
At FP Markets, we observe the World Food Price Index increasing 7.6% from year-earlier levels in July 2025, the biggest jump since the early 2023 period. The rally is understandable with persistent supply shortages, and the interplay of muted grain shipments still restraining supplies globally. Disastrous weather patterns have also reduced agricultural production, pushing the price of top staples and suggesting a danger of new inflation pressures trickling into wider consumer cost gauges.
Recent acceleration of food inflation is of special significance due to its high degree of sensitivity to other dimensions of consumer spending. If such is the case, central bank attempts at disinflation would be made more difficult and lead to a less aggressive policy-easing response. Despite recognition that Deviation of reportable method worldwide affects headline measures, directional risk nonetheless also squarely lies to the upside itself.
Here, we reckon Kellogg Company (K) to be underpriced, in line with the latter’s potential to leverage pricing power and product diversification to compensate for volatility in the cost of raw materials. Additional market adjustments in grains and sugar are set to be viewed cautiously by strategists, given that lucrative changes may once again induce more widespread inflation concerns and induce changes in interest rate expectations.
Sectoral Price Pressures Reveal Shifting Inflation Landscape
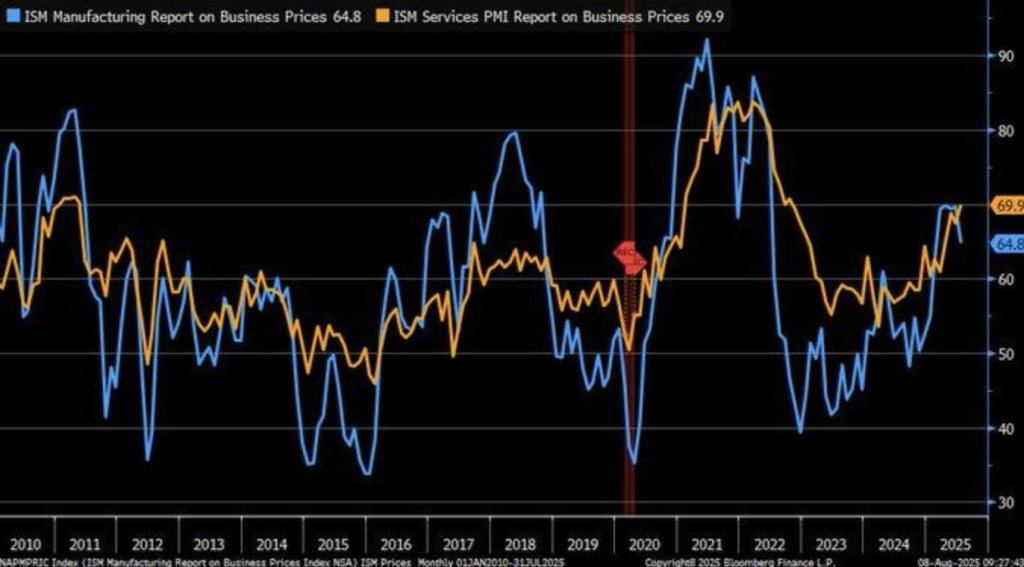
We see generalized divergence between inflation trends in manufacturing and services, with manufacturing prices in a firm downtrend since 2022 while service prices are still gaining traction. This is reflective of inflation’s transition from goods to services due to cost pressures driven by labour and continued supply chain re-pricing. The divergence shows inflationary risk becoming more concentrated, reducing the threat of a generalized overheating theme.
Manufacturing’s eighteen-month-long downturn, eighteen of the past nineteen months to mid-2024, vis-à-vis virtual-stagnation of services activity, to August 2025, indicates rebalancing but not in-built weakness. Asymmetry of this inter-sectoral type mirrors dynamics of past cycles, when services’ strength was masking industry softness, but such day-of-the-decade dynamics are tempered further by expansion in the knowledge and digital service sectors.
We rate Delta Air Lines (DAL) as underpriced at this level, with service demand resilience and manufacturing input costs of a commodity nature underpinning the airline’s strength. Note of interest will be service sector pay rises and industrial slow-down continuing, as either base would recast inflation’s course and monetary policy course. #Inflation #Markets
Credit Card Delinquency Declines Mixed Consumer Sentiment
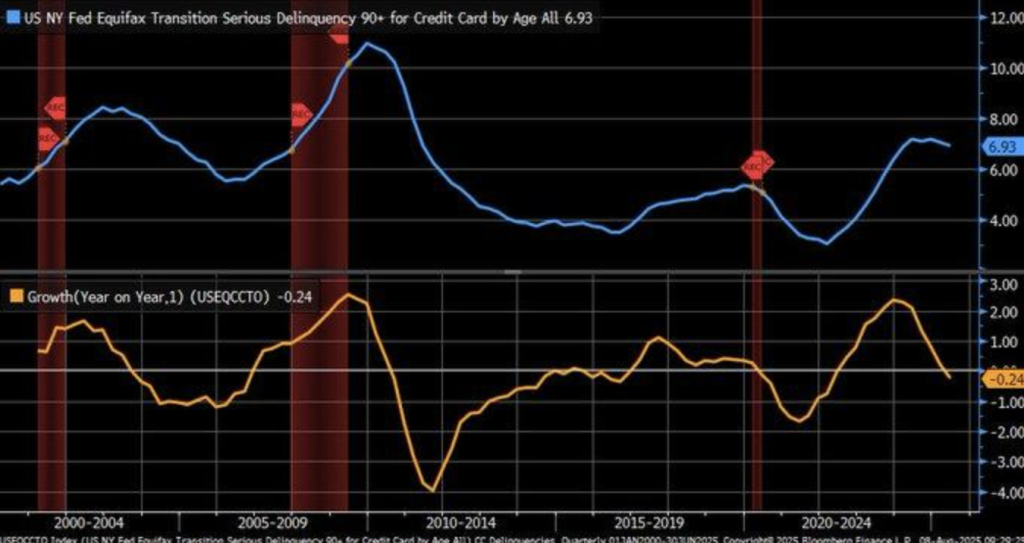
Seriously delinquent credit cards fell from an all-time high of 2.4 in Q2 2023 to around 1.5 during mid-2025, their two-year trough. This delinquency stabilisation is typical of moderation of consumer financial hardship, and further complemented by the Federal Reserve rate plateau at the end of 2024, which seemed to have diminished repayment pressure. Overall, delinquency trends are generally lagging indicators of monetary policy changes and therefore confirm claims of stabilisation being a result of policy action.
But the recovery is not evenly spread. While top-line metrics suggest improved credit behavior, underlying surveys still measure nearly four in ten American adults still facing prolonged financial strain. This disconnect again raises the possibility that the recovery is being fueled by more technical debt management and loan forbearance arrangements than by overall income expansion or economic vigor.
Here, we find Capital One Financial (COF) to be underpriced and with good credit risk management due to capitalize on stabilizing delinquencies without losing profitability. Credit managers must keep a close watch on consumer debt service and acceleration of late payments as talk of rate cuts gathered steam because they are important variables to track in ascertaining consumer strength as real versus policy-driven. #CreditMarkets #Consumers
Increased Hours Reveal An Early Start Of Productivity
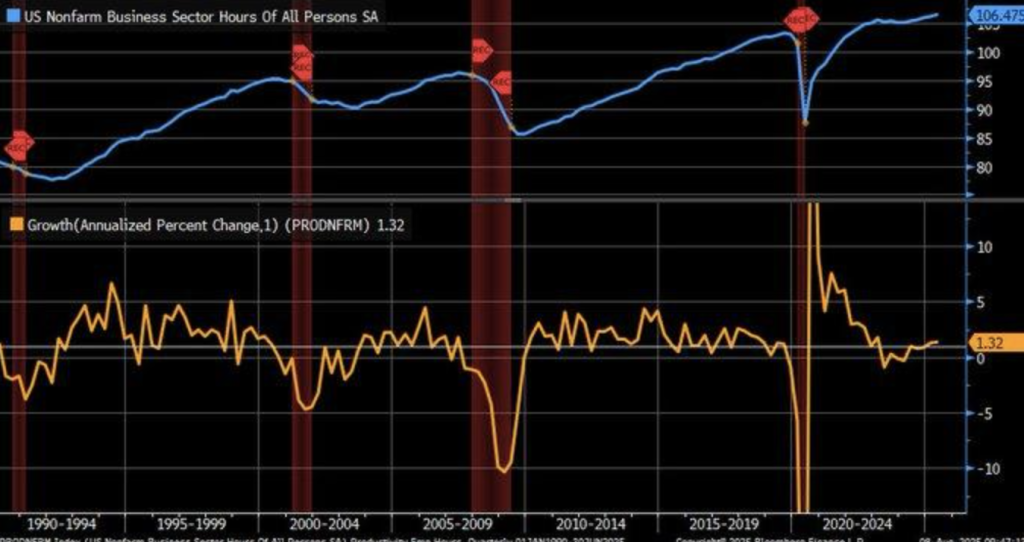
We record 1.32% quarterly annual gain in work hours in the nonfarm business sector in Q2 2025 that reverses trends of stagnation in earlier quarters. This small but significant gain, combined with output in hours, suggests a replenishment of capacity utilisation even in the face of continued supply chain troubles globally. Short even of pre-pandemic wellness, the gain deserves the attention that has been accorded to such capacity to resist the forces of recession.
Prior U.S. productivity growth rates of less than 2% have been followed by recession since 1947 and are thereby of particular significance if deviating from such rate. The current surge may be a flip of conventionally anticipated economic slowdown, either if continued through several quarters.
Labour market resilience persists and has implications regarding wage acceleration, inflation durability, and Fed policy changes.
Our pick here of under-appreciated stocks is Cisco Systems (CSCO) due to its AI and automation offerings standing to benefit from the profit stream of companies seeking productivity gains without corresponding labour expansion. Earnings momentum relies on observing if working hours continue to rise in tandem with capex, as positive signs of either would render the narrative more solid on a medium-term path of improvement. #Productivity #Markets
Rising Jobless Claims Rekindle Recession Concerns
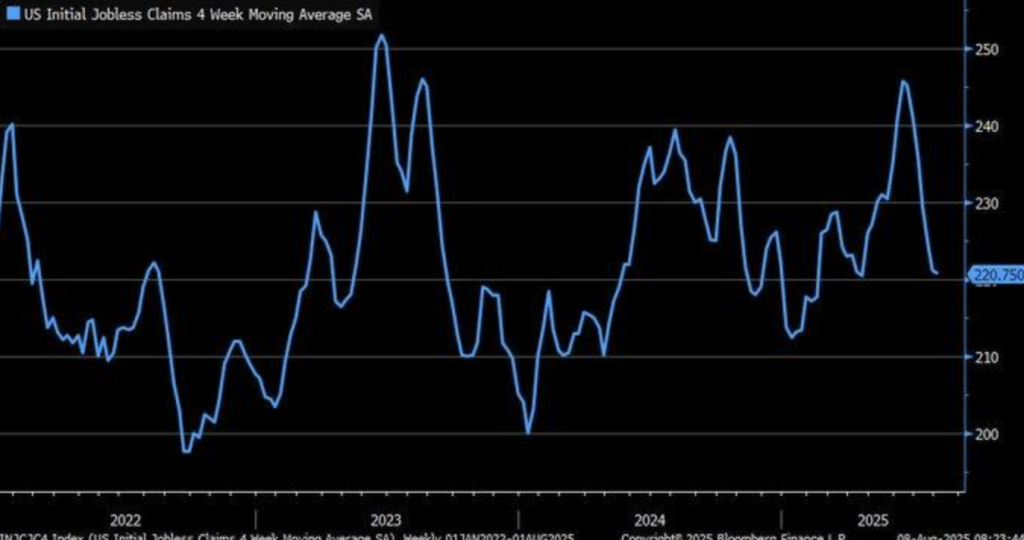
We observe that the 4-week rolling average of first-time U.S. unemployment claims has increased once more in 2025 to a high of close to 250,000 off a similar high in mid-2023. Historically, this “roll over sharply” action—a steep rally followed by tranquility—is a precursor to economic weakening, as in 2008’s financial crisis when claims increased 50% in six months. The trend wipes out labOur market strength ahead of favorable policy indications for rate reductions.
The acceleration could be symptomatic of higher layoffs and sectoral distress than by cyclical structural change. If it persists, rising claims can diminish consumer expenditure and business confidence, offsetting money easing’s stimulus intent. Past experience does establish that persistent acceleration in claims is typically found with more macroeconomic slowdowns.
Here, we find Procter & Gamble (PG) to be undervalued and has a defensively positioned consumer staples portfolio to counteract labour market demand shocks. Forecasters need to closely monitor weekly claims momentum and employment-to-population ratios and weakness would further entrench recession concerns and propel positioning into defensives. #LabourMarkets #RecessionRisks
Revolving Credit Decline Signals Potential Credit Crunch
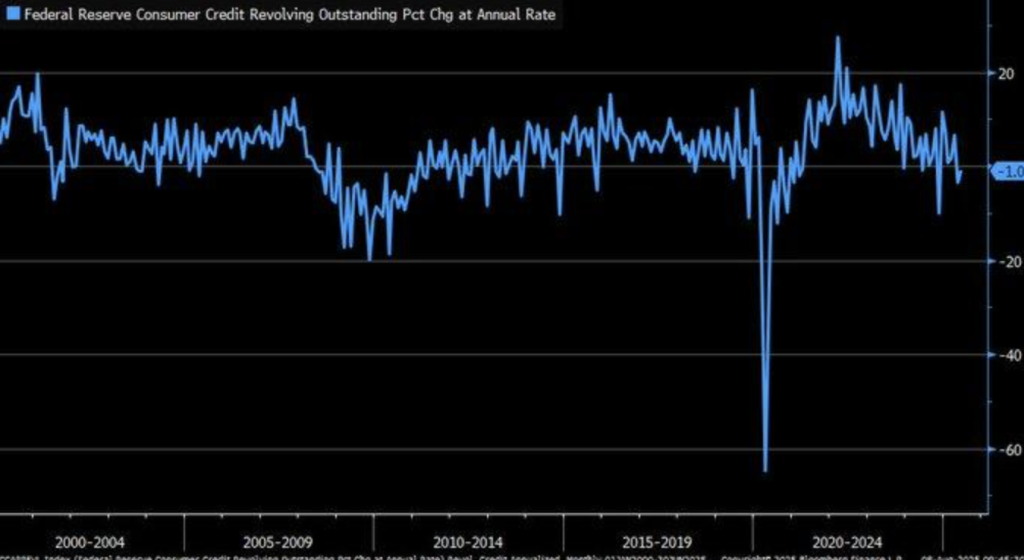
Here we record a -1% annualized June 2025 U.S. revolving consumer credit reversal of previous expansion trends. The reversal of fortunes, which we record evident in the steep decline back to 2020, might be a sign of a mix of tighter lending standards and weaker consumer demand for discretionary spending amid weak economic prospects. Such credit behavior changes have a tendency to produce more general decelerations of household demand.
Federal Reserve G.19 statistics demonstrate even small cuts in lending have enormous macroeconomic impacts. Reducing consumer credit by just 1% imposes the average 0.5%-point drag on GDP, and an additional cut could bleed back into slower expansion momentum. Despite the intimate correlation of access of credit and consumer-driven expansion, the new trend defies expectations of rapid 2025 recovery.
We find American Express (AXP) to be cheap under these circumstances, with its own premium customer base and diversified stream of revenue to buffer against the overall tightening of credit. Bank lending and delinquency trend reports are due attention from analysts to assess if this was a correction brought about once, or the beginning of a more extensive credit crunch. #CreditMarkets #Economy
Negative Bull-Bear Spread Signals Investor Caution
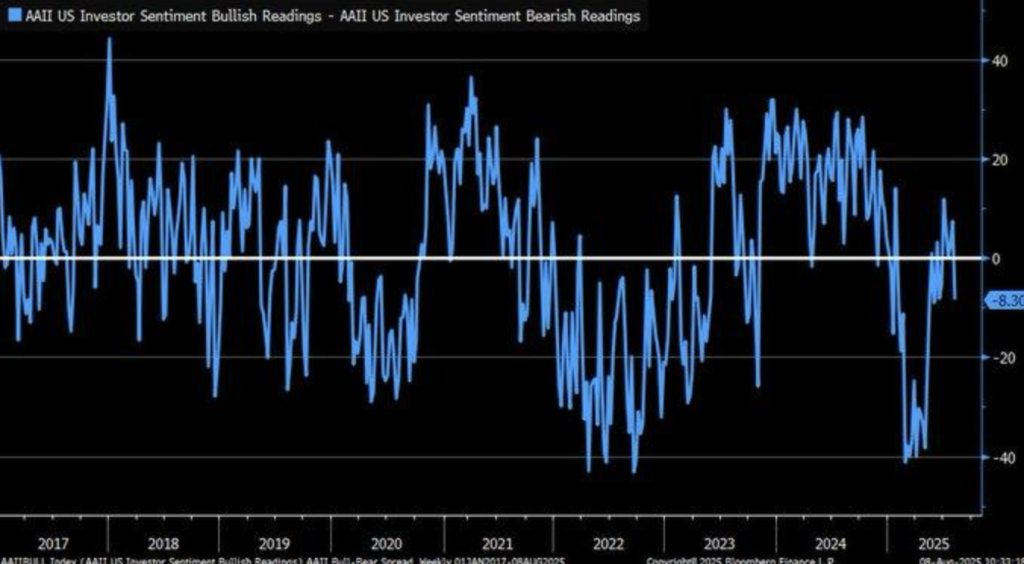
We observe that the AAII bull-bear spread has suddenly turned decidedly negative, with bearishness outpacing bullishness by more than 20 points — the most pronounced move since early 2022. Historically, such sentiment extremes have preceded equity market pullbacks, as research in behavioural finance associates swift reversals in pessimism with 10–15% corrections in the S&P 500 within a six-month time frame. The divergence with the underlying economic data makes this one to take seriously.
While July’s U.S. Services PMI reading, at 55.7, demonstrated continued growth, softness in sentiment indicates investors are looking past headline growth and are increasingly preoccupied with perceived risks. They might include, specifically, jitters over tariff policy, possible volatility in tech, and wariness that recent market advances have far exceeded earnings momentum. This creates a more defensive bias in portfolio positioning.
Such an atmosphere, we feel, makes Johnson & Johnson (JNJ) look cheap, providing stability and dividend certainty in case of possible equity market volatility. Analysts need to monitor the changes in sentiment surveys and volatility indicators as prolonged periods of bearishness in the background of recurring economic data are historically known to predict near-term repricing of risk assets. #InvestorSentiment #Markets
Upcoming Economic Events
Markets are approaching the single most overpowering cluster of data within a quarter, and data schedule has the potential to re-set rate expectations, money flows, and sector leadership way beyond next week. The data — Average Earnings Index (3m/y), Claimant Count Change, German ZEW Economic Sentiment, and the complete bunch of CPI releases — are no data series; they are market movers with the potential of flipping the macro narrative around from cautious optimism to outright replumbing of risk. The inter-connectivity of the indicators such that a jolt in one has the trickle-down across asset classes, pushing currencies, equities, bonds, and commodities around together.
Average Earnings Index (3m/y)
- In case of wage acceleration print above consensus, this directly feeds into inflation expectations, increasing the likelihood of lagged or muted rate cuts. This is to support the currency on account of yield premiums in the currency’s favor but applies pressure on rate-sensitive asset classes like property, utility, and growth technology. For an exporter, a firmer currency has the ability to compress margins, more so in globally-oriented economies.
- A soft print turned the equation around: rate cut hopes sky rocket, currency softens, while consumer discretionary stocks rally on back of hopes of lower lending. Outside equities and FX, wage surprises have the ability to shift the entire yield curve — a big beat flattening the curve on hawkish repricing, a miss steepening on dovish move.
Claimant Count Change
Labour market resilience remains consumer spending’s backstop.
- A softer-than-expected increase in claimants would underpin economic resilience optimism, drawing inflows into the cyclical names of the financials, industrials, and small-cap sectors. But this resilience may be a precursor of sticky wage inflation and so central banks need to be cautious about loosening.
- A bigger-than-expected increase in claimants would provide us with a soft jobs agenda, precipitating risk-off tone in equities and supporting safe-haven demand into bonds and defence currencies. Commodities such as gold may even rally as money takes flight. The dynamic of concern here is an important one —labour weakness and softening inflation may make loose policy loosening an ingredient of its own recipe.
German Economic Sentiment ZEW
This gauge not only captures its impact on European markets; it is one of the leading gauges of world risk appetite.
- A beat is a bullish signal for business and investment opportunities, and it has the potential to drive European stocks, the euro, and draw cross-border flows from U.S. investors seeking to diversify.
- A miss, however, generates fears about Europe’s growth path, biasing toward defensive positioning, euro weakness, and outperformance of U.S. assets. This reading also captures companies’ attitudes toward geopolitical risk — the higher reading foretells resilience, the lower reading foretells caution in committing capital.
Core CPI m/m, CPI m/m, and CPI y/y
Inflation continues to be the fulcrum around which monetary policy revolves.
- Higher-estimate CPI prints can trigger a hawkish money market expectation repricing, pushing bond yields higher, flattening curves, and switching equity flows into defensives and value turns. Growth stocks can underperform heavily as discount rates push higher, and the currency hardens on rate expectations.
- Soft-then-estimate CPI, conversely, would reinstate dovish bets, flatten curves, propel growth and beta equities upwards, and weaken currency. Outside currencies and equities, the CPI surprise has flow consequences all the way through commodities — hot inflation potentially sending petroleum and industrial metals up on demand expectations, soft inflation sending gold on lower-yield expectations. This dataset has the capability to underpin market positioning through the entirety of the next quarter.
Stock Market Performance
Indexes Rebound From Low In April, But Breadth Fades
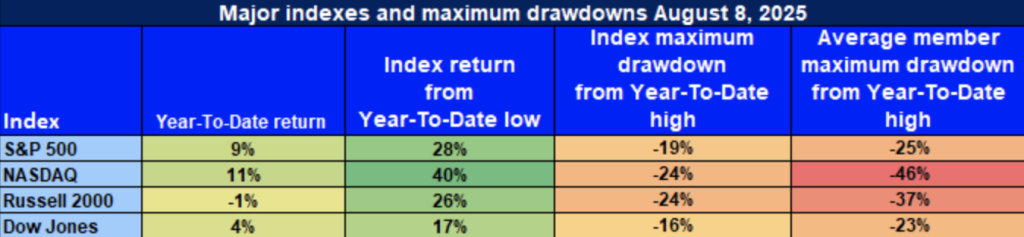
US equity markets have largely recovered from the bottom of the April 8th trough level but year to date data reveals spotty momentum and persisting weakness underneath the on-surface recovery level. Headline rallies are indeed apparent but the magnitude of draw-downs on an index and constituent basis reveals the degree of participation has been and continues to be lean and volatility a prevailing market feature.
S&P 500: Focused Progress in Larger Caps
YTD: +9% | -28% lower than April low | -19% lower than highest YTD level | Avg. member: -25%
S&P 500’s 2025 9%-rally and 28%-recovery off the bottom of the skid of April are signs of strength in headlines. 19%-drops from the top and 25%-average constituent decliners, however, are signs of leadership concentration in a lean handful of the biggest names, and health in the broader tape still needs to be proven.
NASDAQ: Strong Index, Weak Underlying Support
YTD: +11% | -40% beneath April low | -24% below YTD high | Avg. member: -46%
NASDAQ has the highest-index level rally, at 11% year-to-date and 40% off the April low. But this technology-packed composition hides weakness, down 24% from the high and attention-drawing 46% average member drawdown — at the top of the heap of major indices.
Russell 2000: Small-Caps Fumbling Around
YTD: -1% | +26% below April low | -24% below YTD high | Avg. member: -37% Even with a decent 26% advance from the April low, the Russell 2000 is down 1% year to date. Its 24% drop from highs and 37% average member losses are still weighing on small-cap valuations during the squeeze on liquidity and uncertain growth prospects.
Dow Jones Caps Losses with Defensive Bias
YTD: +4% | +17% lower than April low | -16% lower compared to YTD peak | Avg. member: -23% The more cautious composition of the Dow has provided limited protection, with a 4% increase this year and a less severe 16% drop from peaks. In comparison, average 23% losses among members reveal even value-weighted groups are not entirely immune to market forces.
We continue focused at Zaye Capital Markets in high-quality businesses with solid earnings and balance-sheet quality and are keeping a close eye on breadth and volatility metrics for indications of a sustained, broad-based rally.
The Strongest Sector in All These Indices
Information Technology Drives Year-to-Date
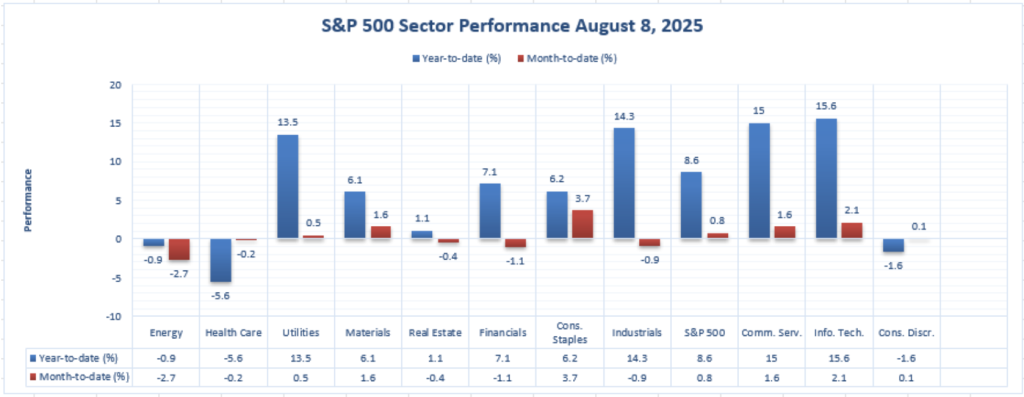
Information Technology has been the top-performing group so far in 2025 with a robust year-to-date return of 15.6% and a 2.1% month-to-date contribution. The performance is driven by continued appetite for growth and technology-driven innovation, with group leadership beating the S&P 500’s 8.6% YTD and 0.8% MTD returns. Tech’s earnings power and capital inflows into high-growth segments of the group have maintained sector leadership.
Consumer Staples Lead Month-to-Date
For the short-term horizon, the previous month top performer has been the Consumer Staples sector, which has gone up by 3.7% month-to-date and 6.2% year-to-date. Its defensiveness and reliable demand across necessities have turned the sector an investment of preference in seeking stability during volatile times. This month’s leadership has been a rotational move into more defensively positioned stocks but never forgetting about the sectors of growth of the long-term horizon.
Other Joint Front-Runners
Communication Services leads the year-to-date rankings with a 15.0% YTD return and 1.6% MTD return, demonstrating very well-balanced strength in both periods. Industrials also have a strong 14.3% YTD result with a 0.9% down month-to-date decline, and Utilities have recorded a strong 13.5% YTD and 0.5% MTD outcome, aided by their defensive nature in still-dubious macro conditions.
Earnings
Yesterday Earnings Recap – 11 August 2025
- Summit Therapeutics Inc.
Summit Therapeutics posted a Q2 adjusted loss of $0.12 a share, wider than the estimated $0.10 loss. The firm also recorded a severe liquidity shortfall, which fueled going-concern concerns. Higher stock-based compensation was a dominant dilution risk driver, which put more pressure on investor sentiment.
- AST SpaceMobile, Inc.
AST SpaceMobile was a letdown, not achieving the approximated level of earnings and revenue. EPS hit the level of –$0.41 from an estimated level of –$0.21, and revenue only hit $1.15 million from an estimated level of $5.56 million. The huge difference in revenue further tells of scaling issues of the satellite network.
- Monday.com Ltd.
Monday.com caught everyone off guard with $1.09 of EPS and $299 million of sales. Even with the beat, however, the stock dropped by nearly 30% as the Q3 guide was below estimates and worries that web traffic trends were decelerating were simmering. Investors were responding to the more conservative model of expansion.
- Oklo Inc.
Oklo fell short of Q2 loss-of-$0.12-per-share estimates by losing $0.18 per share. Operating expenses were elevated and stripped results, and non-cash stock compensation was $11.4 million, and investors are concerned about cost discipline and shareholder dilution.
- United States Cellular Corporation
United States Cellular posted improved-than-expected third-quarter results with net income of $31 million, or $0.36 per share, on revenue of $916 million. Results improved over expectations in top- and bottom-line measures and were the result of steady customer metrics and cost control.
Today’s Earnings Preview– 12 August 2025
- Sea Limited (ADR)
Sea Limited would probably post EPS of $0.99–$1.03 and sales of approximately $5.0–$5.12 billion. Its areas of concern are the strength of margins, logistics cost, and delivery of the e-commerce and digital finance business segments.
- CoreWeave, Inc.
CoreWeave is likely to report a loss EPS of $0.20 on revenue of $1.08 billion. Investor attention will be on AI demand strength and what forward guidance goes out before its IPO lock-up expiration date, which has the potential to lift float on the shares.
- Cardinal Health, Inc.
Cardinal Health will generate revenue expansion of about 1.5% to $60.8 billion in FY Q4. Pharma distribution margins and guidance into next quarter are of interest to watch for hints of acceleration of recovery.
- Circle Internet Group, Inc.
Circle is expected to have about $646 million of revenue, 50% year-over-year revenue growth, and EBITDA of about $119 million but net loss. Investors are probably keen to hear the regulatory milestones and the road to profitability.
- On Holding AG
Holding Corp Should report EPS of $0.19, +90% year-over-year. Growth is good, but valuation multiples are rich, and the market will wait to see if earnings acceleration does prove enough to maintain premium intact.
Stock Market Summary – Tuesday, August 12, 2025
US equities were subdued on Tuesday as markets offset impending releases of CPI against fresh US President Trump threats of trade. The S&P 500 and Nasdaq Composite slid lower, and the Dow Jones Industrial Average remained stagnant. The Russell 2000 lagged as investors unwound rate-sensitive small-cap positions before key economic releases.
Stock Prices
News of Geopolitics and Economic Indicators
Sentiment remains inflation expectations-linked with CPI releases during the week to guide the Fed’s September rate-setting process. President Trump again brought into focus European and Asian import tariffs are “fueling U.S. manufacturing competitiveness” but cautioned escalation in the event of the breakdown in negotiations. Geopolitical risk was also amplified by fresh tensions over the South China Sea, providing a further defence-related skew in market positioning.
Stock News Updates
- $NVDA – The Chinese export agreement only refers to the “dated” H20 chip. President Trump said he won’t approve Blackwell exports unless they have significant downgrades and did confirm Jensen Huang is coming this week to talk about.
- $AMZN — Project Kuiper’s 102 orbiting operational satellites further Amazon’s plans to provide broadband from space.
- $ACHR – Six Midnight jets in production with $1.7B in liquidity; three in final assembly as production ramps up in anticipation of early commercial launches.
- $ASTS – Expecting five or more Q1 2026 orbital launches and 45–60 orbiting satellites at year-end 2026. Guidance remained at $50–$75M for 2H 2025 revenue, fully funded plans behind monthly launches to support global space-based cellular service.
The Magnificent Seven and the S&P 500
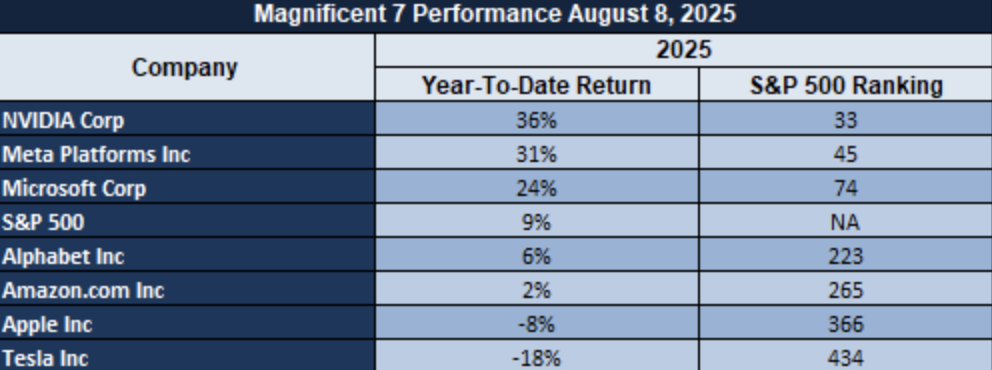
The “Magnificent Seven”–Apple, Microsoft, Nvidia, Amazon, Meta, Alphabet, and Tesla–are still under duress, averaging an 18% pullback from recent peaks.
Tesla and Meta are the top decliners as profit-taking continued to hurt growth and AI stocks.
Lacking fresh mega-cap leadership, the S&P 500’s rally has been contained despite support from energy and industries.
Index Performance up to Tuesday, 12th of Aug., 2025
- S&P 500: 5,832.14, down 0.3%
- Nasdaq Composite: 18,175.62, down 0.5%
- Dow Jones Industrial Average: 41,201.77
- Russell 2000: 2,142.58, off 0.2%
Sector rotation has been meticulously followed at Zaye Capital Markets, and sustainability of earnings and direction of policy are once again determinative of Q3 positioning.
Gold Price – Tuesday, August 12, 2025
Gold is $3,350.03 an ounce, up 0.2% for the day, and markets are factoring in political risk amid anticipation of high-impact economic reports. President Trump’s combative antics in Washington and 90-day extension of the U.S.–China ceasefire are temporarily injecting trade tranquility and geopolitical risk into the market. Although his inability to provide an unequivocal affirmation of longer-term tariff policy retains the air with uncertainty, this tension-balanced caution is supporting safe-haven gold flows.
Today’s data due — comprising the CPI series, Average Earnings Index, and the German ZEW Economic Sentiment — will prove important in deciding gold’s short-term direction. Better-than-anticipated CPI will probably top the list of gains by making the greenback more bullish and delaying rate cuts but lower prints decreasing real yields and propelling gold back into the $3,400 area. Economic data recorded yesterday showed uneven growth and continued weakness on the employment front, further injecting caution into investors. In our opinion at Zaye Capital Markets, the current picture makes bullion’s consolidation more appealing, and political and gradual rate hopes make it more safe-haven appealing in the balance of Q3.
OIL PRICES – Tuesday, August 12, 2025
Brent is at $67 per barrel, WTI at about $64, a bit higher but near multi-month lows. The lean rally was sparked by President Trump’s efforts to extend the U.S.–China tariff truce by 90 days and ease near-term trade tensions and support demand sentiment, especially Chinese import demand. But these are countered by OPEC+’s action to unwind output cuts, again placing supply-demand balance in surplus, and anticipation of future OPEC and IEA reports potentially cementing oversupply worries. Traders are positioning ahead of U.S. inventories and production reports, with the market balancing Trump’s trade optimism against current geopolitical and output headwinds.
Yesterday’s subdued labour market statistics and baffled macro indicators have validated caution, and demand-side ambiguity has warned investors off pushing up prices: Trump’s boasts of US superiority via tariffs has given a short-term jolt, but further upward pulse relies on better indicators of consumption and potential producer supply caution: further upward pulse will rely on better indicators of consumption and potential producer supply caution. Economic indicators due latterly — such as CPI, Average Earnings Index, and ZEW Economic Sentiment in Germany — has the ability to turn sentiment on its heels: inflation turned up would cool demand expectations and hammer down prices, but soft figures would keep alive the threat of policy relaxation and underpin a stronger demand profile. On these conditions, oil’s range-bound, susceptible to political news and macro data propelling the next definitive move.
BITCOIN PRICES – Tuesday, August 12, 2025
Bitcoin fell back to $119,000 after a weekend peak of more than $122,000, as profit-taking and waning liquidity moderated gains. President Trump’s blanket security protocols in Washington, D.C., and a 90-day extension of the U.S–China trade truce have given a Crypto community a mixed verdict. Trump’s law-and-order agenda can create some safe-haven demand in cryptocurrencies, but persistent uncertainty over future tariff policy offsets risk appetite. Institutional demand remains robust, as U.S. spot Bitcoin ETFs reported four straight days of inflows and corporate Treasury demand, including MicroStrategy’s recent acquisition of 155 BTC, supporting sentiment. But traders remain cautious of a potential correction to the ~$117K CME gap and are tracking rising implied volatility as a precursor to two-way risk in the near term.
Monday’s better macro numbers placed risk sentiment in its proper position, leaving Bitcoin listening to today’s economic calendar. Hottier-than-anticipated CPI or PPI prints will tighten the dollar and squeeze BTC, with weaker inflation alleviating real-yield concerns and beckoning a return to the $120K–$123K resistance level. Options markets already expect a “calm-before-the-storm” breakout with flows and benign data the spark needed to clear above current highs. Zaye Capital Markets considers today’s inflation prints the one most important catalyst that will determine if Bitcoin trades in place at current levels or continues running toward all-time highs.
ETH PRICES – Tuesday, August 12, 2025
Ethereum settles at $4,299, flat on a small 24-hour 0.4% pullback. Price action remains positive off a 45% construct last month, and most investors are now in profit. Institutional demand has been behind the move, and we have seen more than $327 million of inflows into early August spot ETH ETFs as a sign of continued demand from larger investors. Corporate treasuries have replenished reserves as well, adding more than 300,000 ETH—valued in excess of $1.3 billion—over the past week, further solidifying the Ethereum case as a base long-term hold like Bitcoin.
Whale behavior also validated the positive configuration. Addresses with more than 10,000 ETH are near an all-time high, an indication of profound belief among whale investors. Though some whales, including the famously discussed “7 Siblings” wallet, have taken profit by selling $17.2 million of ETH, sales have been easily taken up by the market and viewed as constructive rotation and not capitulation. In an environment of fundamentals fortified by institution inflows, accretive whale demand, and continued technical support, ETH has been positioned to challenge the $4,400–$5,000 range if underlying market sentiment remains favorable.
