Where Are Markets Today?
European and U.S. futures are trading a tad lower this morning in a show of prudent investor sentiment even as corporate earnings remain strong. S&P 500 futures are lower by 0.3%, Nasdaq 100 futures are down close to 0.5%, while Dow Jones Industrial Average futures are lower by 12 points, or 0.03%. On the European front, Euro Stoxx 50 futures are lower by 0.2%, while those for Germany’s DAX and France’s CAC 40 are lower by 0.2%–0.3% each. The mixed but otherwise weak show hints at a digestion by markets between high hopes raised by Nvidia’s latest quarter report as well as lingering geopolitical as well as economic doubts.
Primary reason for muted open is Nvidia Q2 report coming in above expectations but not meeting investors’ sky-high expectations. Nvidia stock fell roughly 3% in after-market trading, dragging chip stocks such as AMD, Taiwan Semiconductor, and Broadcom roughly 1% lower each. Despite a blistering 50% growth goal at a $50B quarterly revenue run-rate, an initially pessimistic reaction is a reflection of investors setting an extremely high standard for those technology names tied to AI. European technology-linked futures are no less strained in reaction since global chip supply chain reliance ties investor sentiment between continents. Besides corporate earnings, geopolitical developments and macroeconomic announcements are influencing futures. President Trump’s sacking of Fed Governor Lisa Cook in addition to continued transatlantic tension between Washington and Europe regarding trade and export restrictions on technologies is introducing further prudence in the market. Investors are also looking ahead to today’s U.S. economic announcements consisting of initial GDP, jobless claims, and pending house sales which can change monetary policy expectations. European futures are also trading in line with investors weighing European economic announcements, energy inflation, as well as political developments creating a risk-off sentiment leading up to the open.
Though initially weakening, strategists recommend the response might prove fleeting. Nvidia’s report continues to indicate strong growth and AI sector strength, while Europe’s markets might settle as large-macro indicators give sharper direction. Investors are paying attention for tech-earnings follow-through, sector-rotation signs, and coming economic prints in hopes of determining if futures’ slight losses portend a short-term correction or initiate wider-market reallocations.
Large-Scale Index Performance up to Thursday, 28th August 2025
- S&P 500: Trading at 5,841.52, down 0.4% on the day.
- Nasdaq Composite: 18,220.78 now, -0.6% lower with bear pressure coming mainly from losses.
- Dow Jones Industrial Average: Higher 0.2% at 41,182.34, led by gains for energy and financials.
- Russell 2000: Even at 2,147.63, lagging behind because of rate sensitivity in small-cap issues.
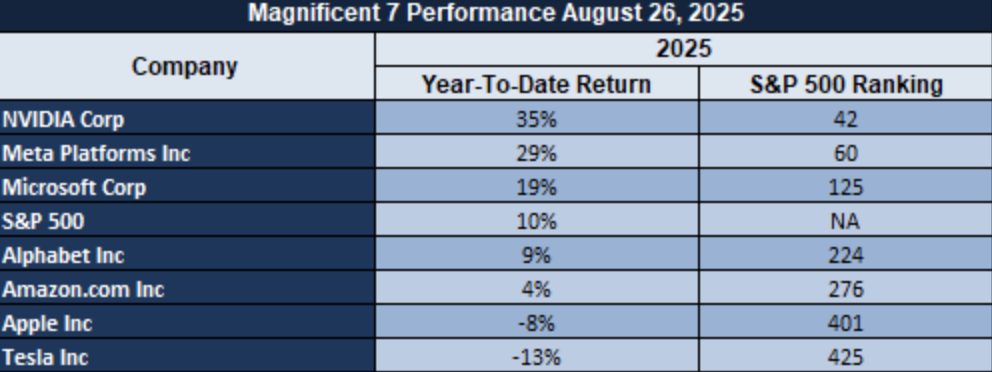
The Magnificent Seven and the S&P 500
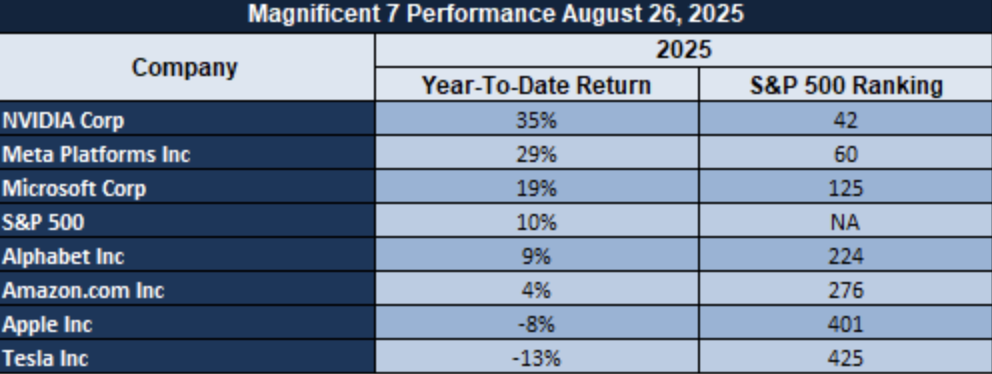
The “Magnificent Seven”—Apple, Microsoft, Nvidia, Amazon, Meta, Alphabet, and Tesla—are showing signs of fatigue, with the group averaging over an 18% drawdown from their recent highs. Tesla and Meta lead the decline, suggesting that valuation recalibration is underway across growth stocks. The S&P 500 continues to rely heavily on the performance of these tech giants, with investor confidence in the broader market increasingly tied to the recovery of these key players. Without a significant rebound from these companies, the index remains vulnerable to further pullbacks.
Drivers Behind the Market Move – Thursday, August 28, 2025
U.S. and European markets are open tentatively today amid investor reticence ahead of corporate results, political updates, and coming economic data. Markets are in a mixed environment where there is strong expectations for tech sector expansion versus political riskiness ahead of key macroeconomic releases, leading to mixed positioning in both regions.
1. Corporate Earnings and Performance of the Tech Sector
Second-quarter results by Nvidia are still impacting sentiment in the market. Despite their beat in estimates, their stock declined about 3% in the aftermath of their result, dragging their semiconductor peers like AMD, Taiwan Semiconductor, and Broadcom lower. U.S. tech-weight indices and European futures involving exposure to technology are reactive in this regard since Nvidia accounts for a large chunk in the S&P 500 and leads worldwide investment sentiment in artificial intelligence.
2. Political and Geopolitical Developments
President Trump’s recent actions—including the firing of Fed Governor Lisa Cook, proposed travel restrictions on EU officials, and calls for charges against George Soros—are heightening market uncertainty. Investors are pricing in potential policy and regulatory disruptions. In Europe, markets are monitoring U.S.-coordinated Russia-Ukraine peace discussions, with expectations of diplomatic developments influencing energy and trade sectors. These geopolitical factors are adding a layer of defensive caution in futures positioning.
3. Upcoming Economic Data
Markets are waiting for major U.S. releases today: preliminary GDP q/q, preliminary GDP price index, unemployment claims, and pending home sales, in addition to FOMC member Waller’s speech. Investors specifically are watching for those releases for signs of growth, inflation, and interest-rate direction. Precursor positioning is one of caution, with both U.S. and European futures accounting for possible volatility ahead of releases as investors consider if such readings support prevailing market direction or initiate risk-off rotations.
Digesting Economic Data:
The Trump Tweets and Its Implications
President Trump’s recent statement and actions are making major waves in both US financial markets as well as worldwide geopolitics. His insistence on George Soros and his son facing charges in the RICO Act as well as contemplating a travel restriction for EU officials concerning censorship laws show his increased attempts at countering international influence as well as national policies he does not find favorable for U.S. interests. These aggressive statements further strained U.S.-European relations, which were already tense with political volatility at a heightened level. Such political rhetoric tends to cause market anxiety since investors are usually hesitant about volatile political environments as well as their likelihood in derailing economic stability. Such remarks might result in risk-off sentiment, which would cause investors to take up haven positions such as in gold or in the U.S. currency unit, while possibly generating turbulence in international markets.
On top of these political moves, Trump’s actions regarding the Federal Reserve continue to stir controversy. His firing of Federal Reserve Governor Lisa Cook, over allegations of mortgage fraud, further exacerbates concerns about the independence of the U.S. central bank. Trump’s increasing interference in the Fed’s operations has the potential to undermine investor confidence, particularly as the Fed’s actions are central to managing inflation and supporting economic growth. If these tensions escalate, the market could see volatility, particularly in bond markets and sectors sensitive to interest rates. The uncertainty surrounding the Fed’s future independence could lead to unpredictability, as financial markets rely on clear and consistent monetary policy to function effectively. From an oil market standpoint, Trump’s praise for oil prices at around $60 per barrel and his repeat emphasis on energy policies may also indicate a shift in American energy policy. Trump’s energy-friendly position might see enhanced oil production domestically, which would apply downward pressure on international oil prices should American production rise dramatically. These remarks, though, in conjunction with recent rancor over tariffs, might also precipitate a pull-in on international oil supply chains, which would cause volatility throughout the energy sector. Investors in oil will be keenly interested in seeing if such political moves equate to further restrictions in foreign imported oils or a further escalation in geopolitical tensions pushing up oil prices.
Overall, President Trump’s continued tweeting and policy developments are a cautionary reminder about how closely politics and markets are intertwined. His pronouncements about international relations, the Federal Reserve, and energy policies are not only changing the trajectory of U.S. domestic politics but are also generating waves worldwide. Investors need to stay vigilant about the possibility for policy surprises as Trump’s comments continue to disrupt conventional Market stability affecting asset allocations as well as the general economic direction.
Inflation Swaps and Bond Market Disconnect
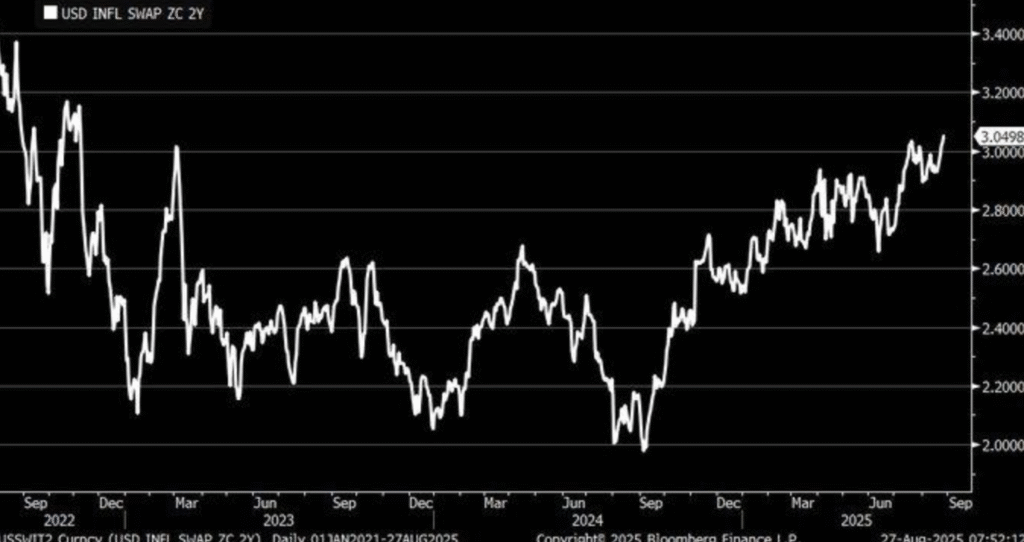
Latest information shows a sudden divergence between advancing 2-year U.S. inflation swap rates and weakening 2-year Treasuries yields which indicate a state of uncertainty in the marketplace. The rise in inflation swaps which are at their highest since November 2022 shows increased bets for continued inflation based on influences such as a 4% rise in airline tickets. What this implies is that there is a belief in the marketplace for continued pressure on prices, even if in general there are signs of economic slowdown.
Conversely, the slide in Treasury yields is an indication of fears of a further economic slowdown. That divergence between swaps (measures of inflation expectations) and performances in the bond market might suggest a latent strain in the market. Bond investors would seem to factor in a slowdown in the economy while nonetheless projecting continuing pressures for inflation as per swaps, which might prove an indication of a policy change having an effect on economic growth expectations for second half 2025.
Analysts should consider how mixed signals may influence future monetary policy choices. The Federal Reserve may experience a dilemma: even though inflation remains above target, economic risk is signaled by Treasury yields. Such tension is bound to affect strategies in bond markets as well as in inflation-sensitive equities like Goldman Sachs (GS) or Johnson & Johnson (JNJ). Investors need to remain vigilant since coming payroll figures and CPI releases are set to shed further light on the state of inflation, impacting both Treasury as well as swap market sentiment.
Cooling Labour Market and Foreign Labour Pressures
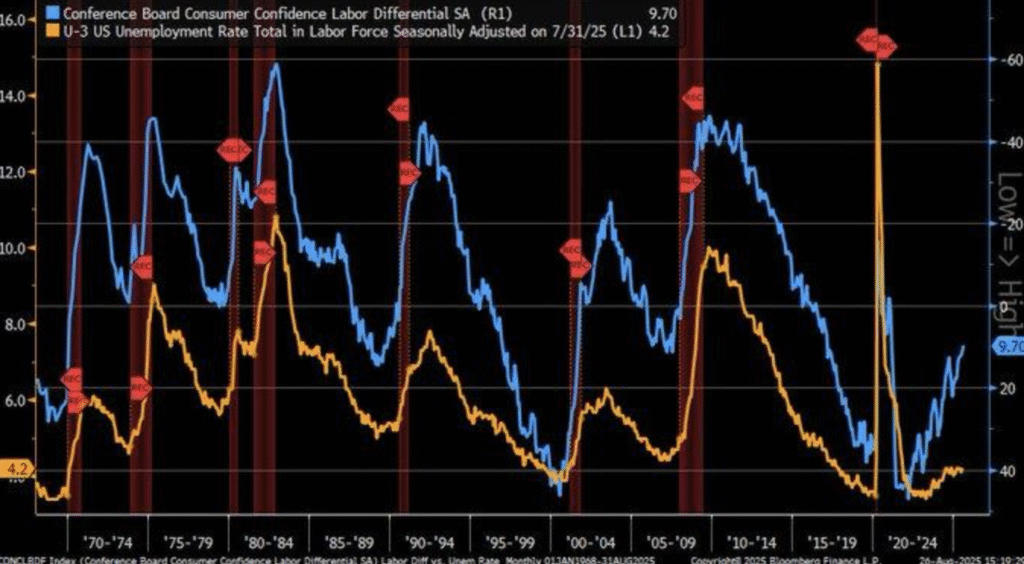
The most recent report using Conference Board information is a concerning one for the US labor marketplace. The Labor Differential between “jobs plentiful” and “jobs hard to find” fell in August 2025 to 9.7%, which is a sign of a slowdown in the job marketplace. That is at the same time as a rise in the US unemployment level at 4.2%, a discordant note for a report about a robust labor marketplace. Despite a fall in the Labor Differential, consumer confidence was at a high 104.7 in December 2024, which is a sign of a conflict between consumer confidence and fundamentals in the labor marketplace.
By comparison, in the past a falling Labor Differential had previously preceded a rise in unemployment by 6-12 months, a 2023 paper by National Bureau of Economic Research stated. That indicator is an early warning sign for a further impending economic slowdown which hasn’t been fully factored in for formal economic expectations yet. Due to such a pattern for analysts, preparations should be made for some weakening in labor markets within the next 12 months in spite of consumer confidence which is quite robust at this date. These issues are exacerbated by the international setting. Post-Brexit labor shortages in the UK and India’s plan for a 50% increase in Russian oil imports tariff (covered by NPR on August 27, 2025) might further tighten global supply chains. These external threats might indirectly influence U.S. employment indicators in sectors most dependent on internationally based trade and supply chains. Market analysts should watch key industries such as logistics, transportation, and manufacturing in which labor market tightness might further increase based on their international supply disruptions. Stocks within industries such as UPS (UPS) and Caterpillar (CAT) might become even more volatile based on further tightened labor market pressures internationally. Moreover, in a potential economic slowdown, defensive stock issues such as Coca-Cola (KO) as well as Procter & Gamble (PG) might be perceived as undervalued alternatives in trying times for stability.
Texas Service Industry Expansion Versus Carefully Spending
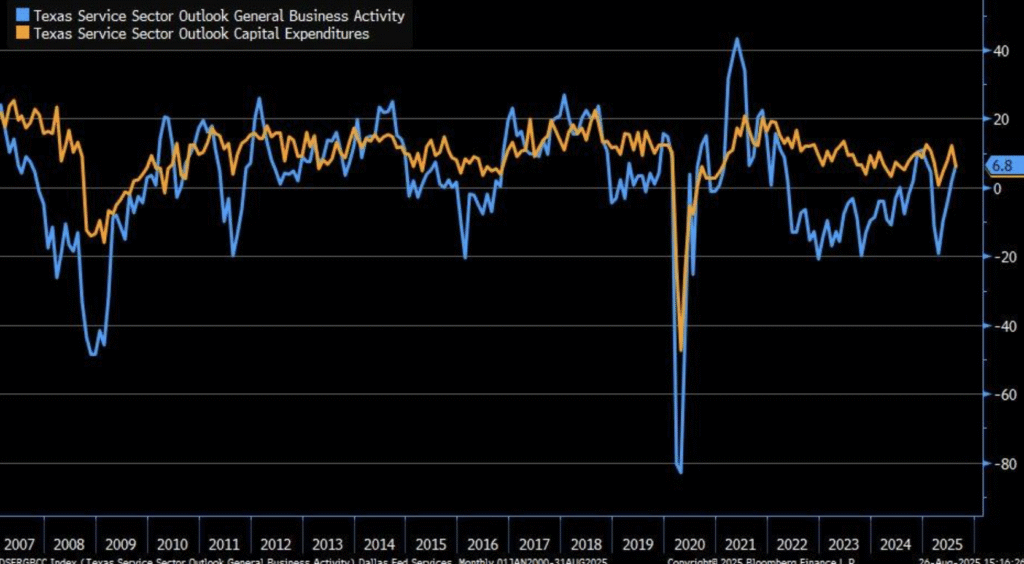
August 2025’s graph for the Texas Service Sector Outlook Survey shows a bullish rise in the Services Index up to +6.8, which is an indication of expansion in the sector. Even with this positive reading, however, a sudden decrease in capital spending (capex) since mid-2024 is a cause for alarm for businesses in Texas becoming more apprehensive about economic conditions. Despite the expansion in services, further contraction in capex is a drag for future economic momentum since companies are preparing for a more challenging environment.
Latest information released by the Dallas Fed also heightens those fears, as in May 2025 the index fell to -10.1, a sign of a general economic slowdown in the state of Texas. Contributing are lower job creation, a less active construction sector, and impacts caused by recent policy shifts, including tightened immigration laws. These factors have probably contributed to companies’ lack of aggressiveness in spending, which is seen in lower capex spending. Overall economic performance in the state is becoming increasingly tenuous as policy shifts along with labor market issues stymie growth potential.
Traditionally, as a National Bureau of Economic Research 2023 report on business cycles points out, reduced spending on capital usually signals larger economic downturns. Consequently, it is possible for today’s Texan trend to indicate a possible slow down within the state economy, making it extremely essential for analysts to track. Stocks related to construction and real estate, for example, like Texas Instruments (TXN) and Fluor Corporation (FLR), might experience greater volatility. Due to economic pressures, defensive sector stock in companies like PepsiCo (PEP) and Walmart (WMT) might provide undervalued possibilities for investors looking for stability in a region characterized by economic uncertainty.
U.S. Manufacturing Sector Faces Critical Skills Gap
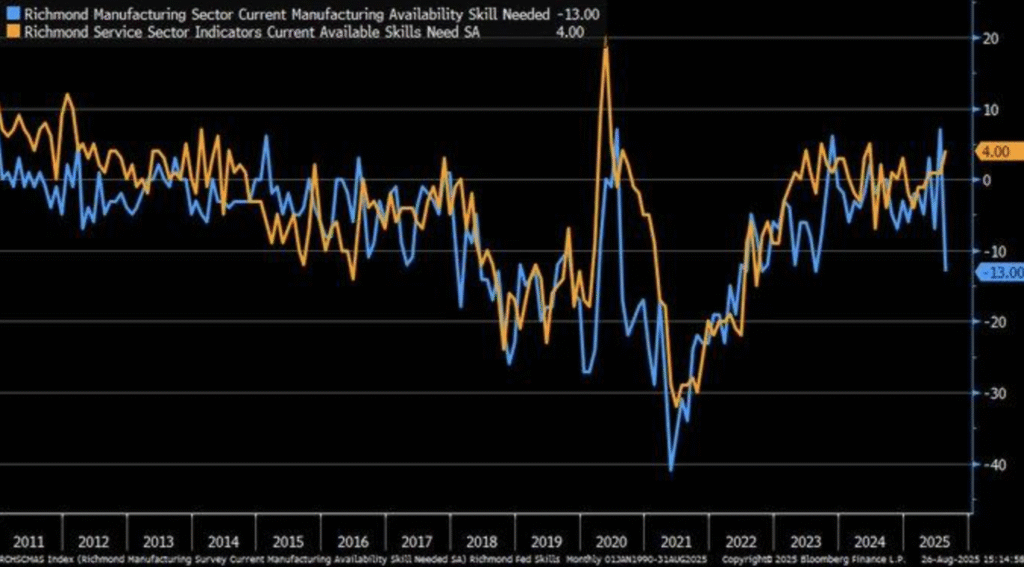
New information reveals a sudden spike in the skills gap in the manufacturing sector as it fell to -4.00 in August 2025. It shows an acute deficiency in qualified workers with a stable outlook for the service sector, reflecting perhaps a sector-specific concentration in labor problems for manufacturing. The rising gap reflects problems in meeting quickly shifting needs in technologies, specifically in fields involving automation as well as robots.
As per a 2023 report, 2.1 million manufacturing jobs remain vacant due to a lack of technical expertise. A lack is exacerbated further by accelerated adoption of Industry 4.0 technologies that require an IT-savvy workforce for dealing with data analysis, robots, and machine programming. Further skills gaps require immediate action in upskilling the workforce for dealing with shifting needs in industry.
Where there is a worldwide rise in manufacturing, though, the sector in the U.S. lags behind those in Europe, notably in nations such as Germany, whose dual education system helped create a better-trained workforce. Amidst such setbacks, investors should watch specific industries such as construction and machinery. Firms in such sectors may experience a rise in demand as the manufacturing industry seeks to catch up on modernization in its workforce based on technical developments. Caterpillar Inc. (CAT), for example, might form an undervalued stock better situated for gains while the industry seeks training for its workforce in order to update it technologically.
U.S. Property Market Feels Cooling Trend As Higher Rates Loom Closer
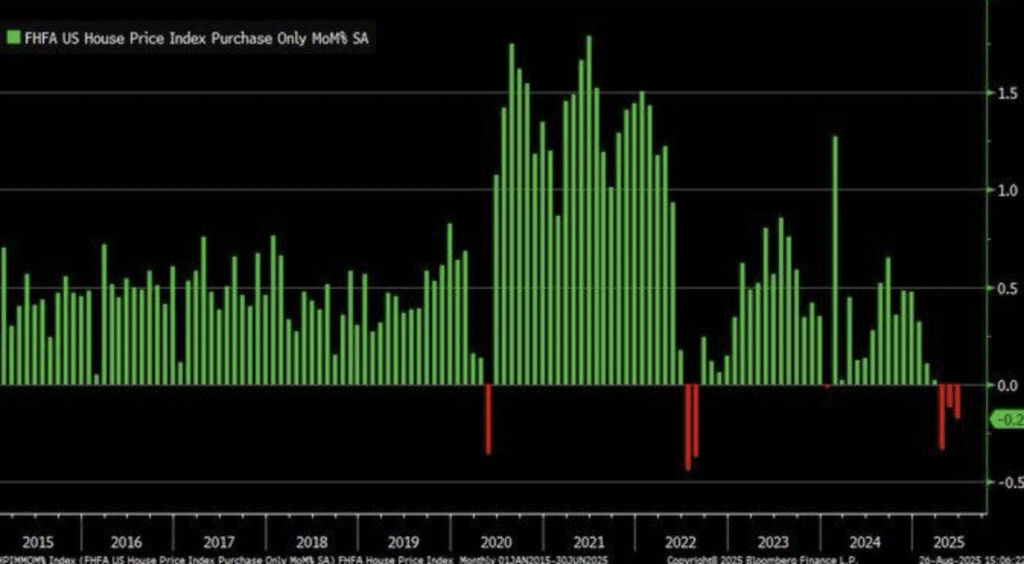
The latest FHFA House Price Index report shows a startling trend: a third consecutive month-over-month fall in June 2025. A blue-moon event last seen in 2011, this is a potential indicator of a slowdown in the U.S. residential real estate market in response to soaring interest rates and growing economic unease. While residential real estate prices over longer horizons always significantly surpass those for inflation, this recent drop may signal a direction shift for the sector. To put it in some context, since 1963, house prices gained 2,350%, while inflation gained 896%, further evidence for real estate’s strong durable record. That all looks set to change now with rising rates damping enthusiasm within real estate circles.
The cooling housing market could be influenced by a combination of factors, including the post-pandemic migration from urban areas to suburban and rural regions, which has altered regional demand patterns. The trend of suburban relocation, sparked by changing preferences for more space and remote work options, may be partially responsible for disrupting the typical upward trajectory of home prices. Coupled with the Federal Reserve’s interest rate hikes, which have led to higher mortgage rates, the market is experiencing a period of price contraction, particularly in previously overheated markets. As borrowing costs rise, fewer buyers can afford to enter the market, slowing demand and thus impacting price growth. National Bureau of Economic Research research (2022) points out that extended drops in house prices are frequently linked with stricter monetary policies. Rate increases by the Fed are probably a prime reason for the chill in the market, which goes contrary to the recent years’ story of unbroken housing inflation. As analysts look ahead for indicators for the U.S. housing market, real estate and construction sector stocks should come in sharp focus. Lennar Corporation (LEN), a leading large-cap in homebuilding, might currently be undervalued in the face of this shift in the market. As the housing segment adjusts its footing in line with prevailing economic conditions, there are even chances for investors when there are potential reversals once conditions in the marketplace level out.
Resilient Business Expenditure in an Uncertain Economy
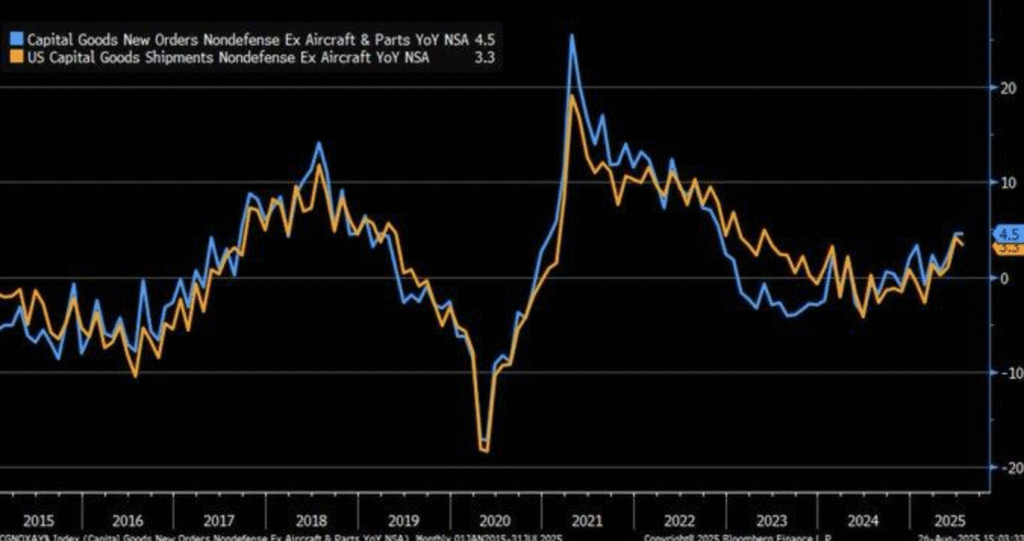
Most recent U.S. core capital goods orders and shipments indicate resilient spending by businesses even in a recent 0.8% decline in June 2025. Core capital goods orders for July rose by 3.82%, while shipments increased by 4.5%, marking continued spending in capital goods amid short-term fluctuations. It shows businesses are retaining an emphasis on keeping an eye on a longer term in a bid to prepare for tougher times ahead in any economic turbulence brought about by such issues as rising input costs or even tariff increases.
Noticeably, U.S. Census Bureau’s M3 survey, which does not include transportation equipment, shows a 0.7% jump in shipments and a robust 0.2% recovery in orders. These indicate intentions for businesses possibly front-loading investments ahead of expected tariff increases in revived policy shifts. Such activity reveals companies are fine-tuning their operations so their buying decisions are in line with wider geopolitical as well as economic developments.
According to a 2023 study by the National Bureau of Economic Research, core capital goods trends frequently mirror equipment spending shifts, specifically on automation. Through the current rise in capital goods, it might manifest greater demand for automated solutions, including warehouse robots, as organizations strive for greater efficiency in operations. Nevertheless, analysts are advised to be careful since increased costs in imports might buoy order values up instead of manifesting sizeable volume gains. As businesses respond to such changing circumstances, automation and technology companies like Honeywell (HON) might gain a glimpse of prospects, though investors should keenly note what tariff policies as well as costs do to demand in totality.
Consumer Sentiment Project Cautious Optimism
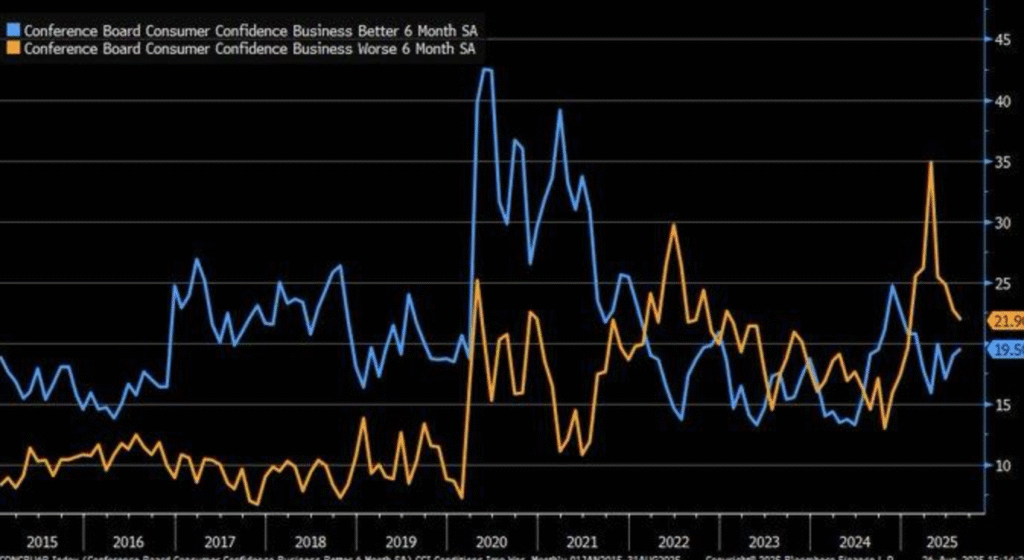
The recent survey by the Conference Board points out a dramatic drop in expectations for worse business conditions by consumers from nearly 45 in mid-2025 to less than 30. Expectations for improved business conditions remain flat, implying a dominant state of cautionary optimism over a strong rebound. Though a fall in pessimism would otherwise appear bullish, an absolute failure for expectations for better business conditions to rise is an indication consumers are not completely sold on an economic recovery at this juncture, sooner or later weakening spending momentum.
That is consistent with a 2024 National Bureau of Economic Research paper which found consumer confidence shifts lag behind actual economic indicators like GDP or job growth. That recent decline in negative sentiment may reflect lagged responses towards stabilizing labor markets instead of a sudden improvement in economic strength. That would show even if appearances are being maintained at the bottom line level, consumer sentiment remains cautious as households digest the broader economic environment. Historically, such divergence between declining pessimism and flat optimism has been a hallmark of fragile economic recoveries, as seen during the 2008-2009 recession. This pattern challenges the narrative of a quick post-2023 economic rebound, indicating that consumer spending may not be as strong as expected. Analysts should keep a close eye on consumer confidence data, as it can often serve as an early warning signal for shifts in spending patterns. The current trend suggests that sectors reliant on consumer spending, such as retail and leisure, might face challenges ahead, and companies in these areas, including Walmart (WMT) and Home Depot (HD), could see fluctuations in performance as consumer confidence remains tepid.
Services Sector Slowdown Indicates Wider Economic Constraints
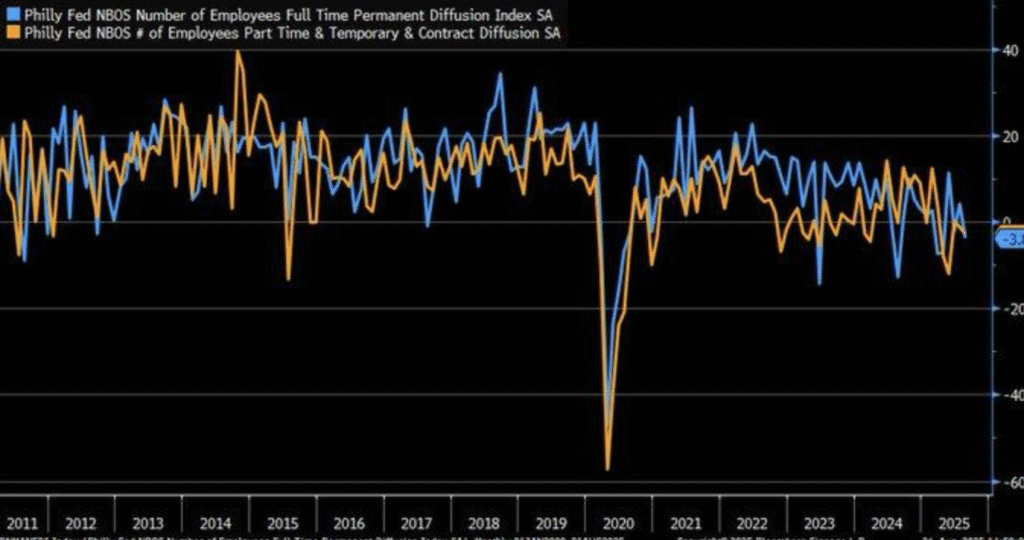
Most recent Philadelphia Fed’s Services Index data shows a troubling shift as employment components fell into contraction in August 2025. That fall is a sign of possible economic slowdown in the area, a sharp contrast to previous 2025 growth patterns. Contraction in the service economy might indicate pressures on a larger economic level, showing a shift in sentiment towards business as well as a shift in hiring behavior, which is possibly a signal for a slowdown not only in the Philadelphia area.
This contraction is in line with Federal Reserve research (2023), which posits that service sector downturns in major regions commonly predate national employment declines. Should this hold, it would indicate an impending national employment slowdown with a ripple effect outside Pennsylvania, New Jersey, and Delaware. As national employment in this service sector sags in response in the region, observers should take close note as a leading sign for a wider U.S. economic slowdown.
Global economic uncertainty, such as surprise tariff regimes during the Trump administration’s “Liberation Day” tariffs in 2025, might explain this shift within the service sector. These are perhaps putting a squeeze on businesses in the U.S., as they are upsetting supply chains and pushing up costs, which might temper hiring and spending. That undermines a story of stable pandemic recovery and implies there is still economic fragility about. Investors should monitor sectors with high dependency on international trade because those are perhaps most at risk of disruption. Consumer discretionary sectors such as Home Depot (HD) might also experience problems when consumer confidence and spending begin to slow as a result of rising economic uncertainty.
Increases in Input Cost and Sticky Inflationary Pressures
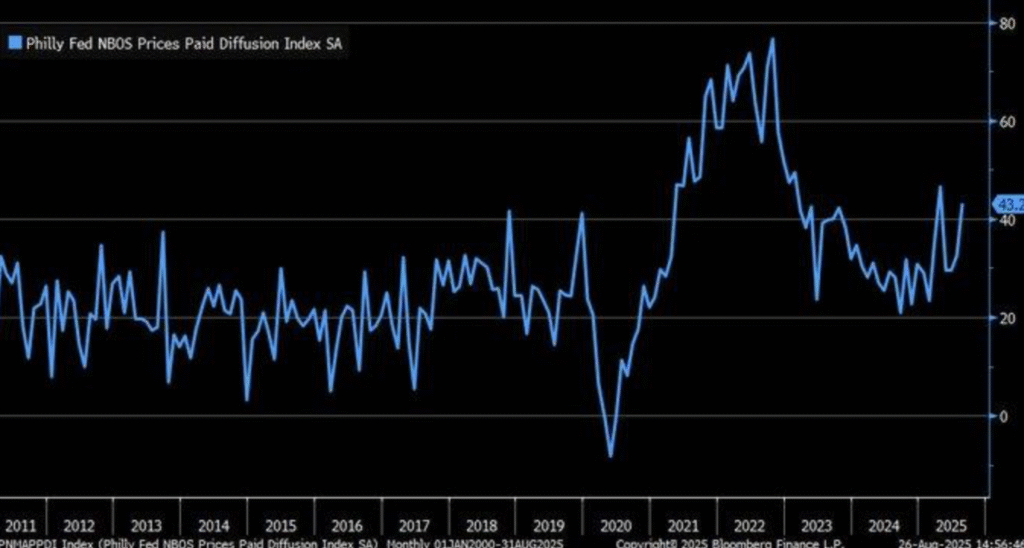
The last Philly Fed Non-Manufacturing Business Prices Paid Diffusion Index reveals a sharp jump in August 2025, close to a cycle peak. That means service companies are facing increased input costs, a sign of possible inflationary pressure which may again test the larger economy. The pattern is in line with diffusion index data for the Federal Reserve Bank of Philadelphia which revealed similar trends since May 1968, which highlights how resilient the service sector’s inflationary pressures are.
Such a diffusion index spike is consistent with the notion of “sticky inflation,” whereby downward price adjustment is resisted in response to supply-demand mismatches. As a 2023 Mourant report noted, sticky inflation is indicative of the wider issues faced by central banks in containing increased costs in a particular period marked by the worst cost-of-living crisis in decades. Crisis is particularly rife in service sectors facing such pressures, which are becoming increasingly hard to reverse amid an even more complicated economic stability as well as growth environment.
Based on past economic cycle information from Investopedia, accelerated growth periods are commonly followed by corrections, so the recent peak in Prices Paid Index might portend a coming contraction. U.S. economic cycles since 1950, which averaged five and a half years in duration, might signal a tipping point where inflation pressures might dampen economic activity, which would warrant closer consideration for what might come next from the Federal Reserve. As the central bank continues in this complicated landscape, analysts should stay vigilant, at least in those sectors exposed to inflation such as utilities and consumer staples, which might become volatile as the cycle continues.
Upcoming Economic Events
As we enter the upcoming week, the market is poised for a series of pivotal economic releases that could significantly influence both market sentiment and the Federal Reserve’s approach to monetary policy. With key indicators on GDP growth, employment, inflation, and housing slated for release, how the actual numbers align with forecasts will play a crucial role in shaping investor expectations. Here’s a more in-depth breakdown of each event and what could happen based on whether the actual data exceeds or falls short of expectations:
Advance GDP q/q
The Preliminary GDP for Q2 2025 is set to be one of the most closely watched reports in the next few days.
- A better-than-expected GDP number would indicate that the economy is picking up pace more robustly than predicted, generating investor cheer. Such a reading would probably evoke a bullish market response, with equities possibly gaining traction as investors reassess their expectations about economic expansion. Further still, hopes for additional rate hikes by the Federal Reserve might result in increased bond yields, since inflationary pressures would probably come to be viewed as rising. A GDP number might also indicate that the US economy is overcoming headwinds such as increased input costs and geopolitical risks.
- On the contrary, a weak GDP print less than expectations might indicate a slowing economy, whose risk-off sentiment might come at a fall in equity prices, while those in bonds might gain traction as investors switch into safe-haven corners. A GDP miss would probably stoke fears about Federal Reserve capability in raising rates without strangling expansion, coming at enhanced volatility in financial markets as well as possibly compelling a dovish shift in Fed policy.
Unemployment Claims
Weekly unemployment claims provide one of the most real-time insights into the health of the labor market. If claims come in lower than forecasted, this would point to a strong job market, reinforcing confidence in the economic recovery.
- A strong labor market could drive optimism in cyclical stocks, particularly those in consumer discretionary and retail sectors, as robust employment translates to higher consumer spending. However, a lower unemployment claims number could also raise concerns about wage inflation—if employers are forced to compete for workers, wages may rise, which could drive inflation higher. As a result, the Federal Reserve might feel pressure to adopt a more hawkish stance on monetary policy, leading to higher interest rates and possibly lower stock prices as the cost of borrowing increases.
- On the other hand, if unemployment claims come in higher than expected, this would signal potential weakness in the labor market, likely dampening consumer confidence. Such a scenario could prompt a flight to safety, with investors rotating into defensive equity sectors like healthcare, utilities, and consumer staples. Bond prices may rise as demand for government debt increases, especially if the job market appears to be cooling, suggesting the economy might be entering a contraction phase.
Advance GDP Price Index q/q
The GDP Price Index is a major measure of inflation tracking price developments in the economy.
- A higher-than-expected GDP Price Index would indicate that inflation remains an issue despite economic slowdown. Such a development would result in a hawkish market movement since upward pressure on monetary policy could prompt the Fed to maintain its tightening cycle. Here, we might witness an increase in bond yields as the market price-in additional rate increases, as well as a strong U.S. dollar based on rising expectations for a more aggressive Fed policy.
- On the contrary, a lower-than-anticipated GDP Price Index would indicate that inflation is gaining control, which would come as a relief for investors. Such a likelihood would result in lower bond yields accompanied by a risk asset rally such as equities since expectations for future monetary policy normalization would dwindle. The lower reading in inflation would act as a signal for a Fed shift towards a more accommodative policy stance, which would stimulate risk-taking in all sectors, especially in growth stocks.
Pending Homes Sales m/m
Data on pending home sales offers key information about how the housing sector is faring, a major support for the US economy.
- A better-than-expected pending home sales report would indicate continued robustness in the housing sector even as interest rates rise. Investors might interpret this in a positive light as consumer confidence, which would spill over into confidence in a broader economic upswing. Stocks in homebuilders such as Lennar (LEN) and D.R. Horton (DHI) might rise while investor sentiment in general might shift towards a more bullish stance.
- However, a weaker-than-expected report would signal that increased mortgage interest rates are taking a heavy toll on the housing sector. There are implications for a more general concern about consumer spending as well as a sicker economy ahead. A softness in pending home sales might trigger a selloff in housing sector issues and a shift towards less cyclical sectors. A soft housing sector might even send a broader risk-off signal with investors shunning equities in favor of safe-haven issues such as longer-duration government debt.
FOMC Member Waller Speaks
Speeches by officials at the Federal Reserve, especially prominent officials such as Waller, are monitored carefully by financial markets for information about the Fed’s thoughts regarding inflation as well as its intentions for interest rate direction in the coming months.
- A hawkish comment by Waller signaling further rate increases in an effort to control rising inflation would tend to have a negative response in financial markets. Higher rates would tend to slow economic growth, specifically for those interest-sensitive industries such as housing and consumer durables, which would result in falls in equity values as well as possibly steeper yields for bonds.
- Conversely, in a dovish statement by Waller which would signal a more gradual tightening bias or even a slowdown in future rate increases, this should allow for a relief rebound in equities with particular beneficiaries those sectors such as technology and consumer discretionary. A dovish statement would result in lower yields for bonds as well as possibly a weaker U.S. currency sparked by reduced expectations in financial markets for increased rates in the future.
Overall, such economic events in the near term are essential in determining short-term sentiment in the market. Based on either a deviation in actual or forecast data, either a negative or positive reaction in the market is possible with spill-over effects on asset classes in general. Investors should remain vigilant about such data points since they can renew market forces as well as create fresh investment possibilities as much as risk.
Stock Market Performance
Indexes Recover From April Lows, But Member-Level Stress Persists
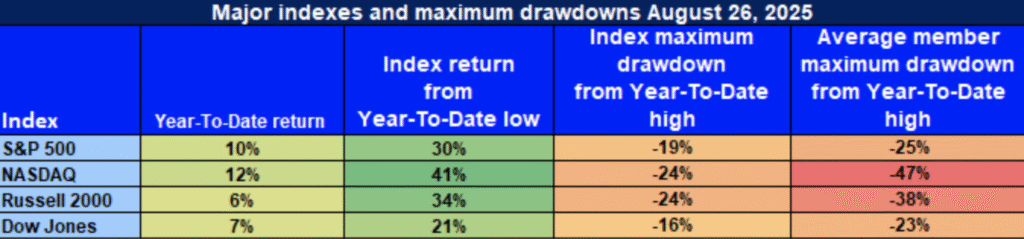
At Zaye Capital Markets, we remain vigilant in tracking market conditions. Even though U.S. equities recovered noticeably from their lows on April 8th, taking a closer look at stock-by-stock action shows the rebound is mixed, with lingering frailty behind the scenes. Even though there is positive movement in broader indexes, there are still a lot of struggling stocks out there, and generalbreadth in the market is still a worry. That’s our detailed overview based on newest index-level information as well as performance by members:
📈 S&P 500: Solid Rebound, But Member Strain Lingers
YTD: 10% | 30% discount April low | -19% of YTD high | Member avg.: -25%
The S&P 500 has shown a decent recovery, rising 10% year-to-date and 30% since its April bottom, which is a sign of general market resilience. Nevertheless, a 19% correction from its year-to-date highs and typical member declines of 25% create a more mixed story. Index gains are extremely concentrated in a handful of large-cap issues, while numerous members within the index continue to struggle mightily. That dichotomy underscores a truth that even if the index is strong, a lot of its constituent issues are still in trouble.
🚀 NASDAQ: Strong Recovery Masks Underlying Weakness
YTD: 12% | -41% less than April bottom | -24% less compared to YTD high | Ave. mem: -47%
The NASDAQ has made spectacular gains, rising 12% so far in the year and 41% since its low in April. Nonetheless, the heavily weighted index still continues to grapple with significant structural weaknesses. The index is down 24% from its year-to-date high, while the average constituent is lower by a whopping 47%. That implies there is no broad-based strength in the NASDAQ’s rise so far, with numerous technology issues lagging behind. Such differential performance in no way enhances confidence in the sustainability of the rebound in technologies.
Russell 2000: Potential Turn Backward, But Small Caps
YTD: +6% | +34% off April low | -24% from YTD high | Avg. member: -38%
The small-cap stock sector showed life in rebounding 34% from the April lows, but still only has a year-to-date gain for its segment in the Russell 2000 index at 6%. Down 24% from recent highs combined with 38% average-member losses shows that in today’s environment, small-cap stock performance is still mediocre at best. It is their slow performance in this risk-sensitive area of the marketplace which shows investors are still skeptical about economic conditions ahead, and thus putting further pressure on their stock segment with volatility still in play.
Dow Jones: Volatility Buffered with Defensive Stocks
YTD: +7% | -21% below April low | -16% lower compared to YTD high | Avg. member: -23% The Dow Jones has shown a fairly consistent performance so far in the year, up 7% year-to-date and a less spectacular 16% decline since its highs. That stability is virtually entirely an effect of its representation in defensive industries like consumer staples and health care, which perform better in volatile marketplace conditions. Even in such stalwart industries, though, in our experience the typical constituent is down 23%. That implies even defensive industries are not completely immune from broader marketplace currents, so investors would do well to stay attentive.
Zaye Capital Markets’ View:
Whilst the index level remains strong, recovery is differentiated at the member level, which is a cause for concern around the health of the market. Divergence in sector performance as well as individual stock performance is indicative of a recovery that might not prove so sustainable or wide based as it seems. We favor high quality fundamentally strong assets capable of enduring volatilities in the marketplace. We watch closely for signs of breadth improvement, earnings expansion as well as volatility in looking for potential buying opportunities while keeping a watchful eye ready over risks in more speculative or underperforming parts of the marketplace. Investors should remain prepared for additional volatility as they adopt a selective stance in their allocation in a marketplace where recovery remains a frail and differential concept.
Best-Performing Sector Among All These Indices
Communication Services and Industrials Take the Lead
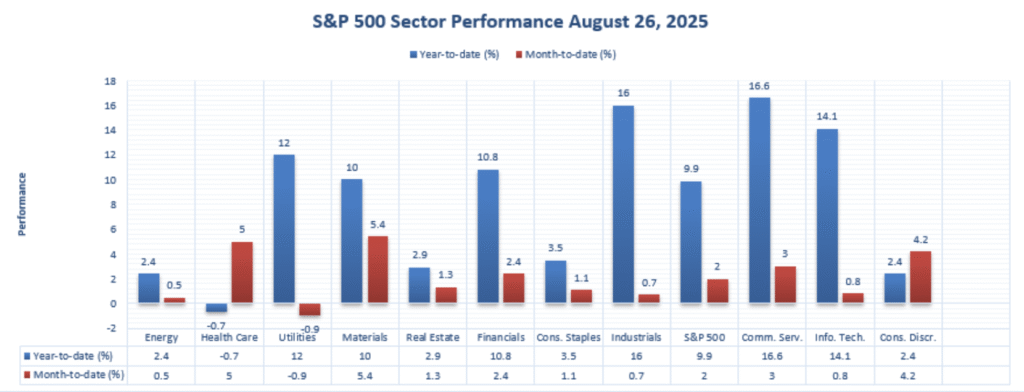
Within Zaye Capital Markets, sector-level action frequently reveals greater conviction in the marketplace rather than large-scale index movement. Whereas large-scale gains throughout leading indices are no doubt significant, a look at a sector level within the S&P 500 shows where leadership is occurring on a meaningful level. Through August 26, 2025, leading sectors include Communication Services, Industrials, and Information Technology, each having unique economic forces behind it as well as investor sentiment.
Telecommunication Services: YTD: 16.6% | Month-to-Date: 3.0%
Communication Services emerged as the undisputed leader, posting an exceptional 16.6% year-to-date gain and a sturdy 3.0% August increase. Such a strong sector performance is primarily fueled by strong earnings in key digital platforms and media groups, which remain beneficiaries of a greater migration towards digital consumption. Such sector expansion is further aided by increased investor demand for those platforms allowing social connectivity, entertainment, and internet services. As expansion in the digital economy continues, a prime gainer remains Communication Services, which is expected to sustain strong momentum if consumer expenditure on digital solutions increases.
🏗 Industrials: YTD: 16.0% | Month-to-Date: 0.7%
Industrials have closely followed Communication Services with a strong 16.0% advance year-to-date. Such a performance reflects continued infrastructure, logistics, and manufacturing strength, which are at the heart of worldwide economic rebound. August returns were less robust, yet Industrials have consistently exhibited strong demand for economically exposed businesses, specifically those tied in with spending on infrastructure, chain logistics, and manufacturing, which should remain robust. Further industrial activity rebounding based on support from both US as well as overseas expansion should remain positive for sector direction for the balance 2025.
Information Technology: YTD: 14.1% | Month-to-Date: 0.8%
Information Technology continues to attract significant capital, posting a 14.1% increase year-to-date. Despite only a modest 0.8% gain this month, the sector’s resilience amidst broader volatility highlights its central role in the ongoing market rally. The tech sector is heavily driven by demand for cloud computing, semiconductors, cybersecurity, and AI solutions, all of which remain key drivers of global economic transformation. While short-term volatility may affect performance, long-term trends suggest that technology will continue to be a crucial engine for market growth, further justifying continued investor interest in this space.
As we take a continued look at sector performance, it’s evident Communications Services, Industrials, and Information Technology are not only displaying strong top-line growth but also steady month-over-month performance trends. These are the sectors which display the type of resilience and leadership which are set to propel market expansion in 2025. At Zaye Capital Markets, we are still overweight in these sectors as we look for companies not only which display robust year-to-date performance but also are capable of withstanding broader market headwinds.
Earnings
Earnings Recap: August 27, 2025
- NVIDIA Corporation (NVDA)
NVIDIA posted strong second-quarter earnings, with a notable $60 billion stock buyback announcement, which signaled confidence in its future growth. The company surpassed expectations, but shares declined in after-hours trading, possibly due to concerns over weaker-than-expected data center revenue and ongoing uncertainties in the Chinese market. Despite strong earnings, analysts are cautious about future growth in the data center business, and NVIDIA’s reliance on this segment has left some investors concerned. This caution was reflected in the market’s reaction, highlighting potential risks in their global exposure and operational challenges ahead.
- CrowdStrike Holdings, Inc. (CRWD)
CrowdStrike reported a 21% year-over-year revenue increase, amounting to $1.17 billion, with adjusted earnings per share of $0.93, exceeding analyst expectations. However, the company’s third-quarter revenue forecast fell short of market expectations, which caused a drop in stock price post-earnings. Despite the robust earnings, concerns over the weaker revenue guidance for the upcoming quarter suggest a potential slowdown in demand for cybersecurity services, challenging its growth trajectory. The forecast miss has raised some questions about CrowdStrike’s ability to sustain its recent pace of expansion.
- Snowflake Inc. (SNOW)
Snowflake delivered an impressive 32% revenue growth, totaling $1.144 billion, and raised its full-year product revenue forecast to $4.4 billion. The strong performance was driven by the increasing demand for its AI-driven data cloud services. This upbeat outlook indicates that Snowflake remains a key player in the data cloud market, particularly as companies look to capitalize on artificial intelligence. The strong forecast and consistent growth show that Snowflake’s leadership in the data cloud sector remains unchallenged, positioning the company for continued success as data-driven solutions expand across industries.
- Veeva Systems Inc. (VEEV)
Veeva posted solid results with a 16.7% revenue increase, bringing in $789.08 million. Adjusted earnings per share were $1.99, exceeding estimates. The company provided an optimistic outlook for the upcoming quarter, projecting revenue between $790 million and $793 million. Veeva’s performance remains strong, driven by continued demand for its cloud-based solutions for the life sciences industry. With its leading position in this niche, Veeva’s forecast signals sustained growth and confidence in the industry’s continued digitization, keeping the company well-positioned for the future.
Earnings Preview: August 28, 2025
- Dell Technologies Inc. (DELL)
Dell Technologies is expected to report second-quarter fiscal 2026 earnings, with projected revenues of $29.2 billion and earnings per share of $2.28. Investors should focus on Dell’s performance within its Infrastructure Solutions Group, particularly how its AI server sales are faring. Any update on Dell’s investments in AI infrastructure and its ability to capture a larger share of the growing AI market will be pivotal in determining its future trajectory. Additionally, updates on its broader enterprise strategy and demand for PCs will provide further insights into the health of the tech sector.
- Marvell Technology Inc. (MRVL)
Marvell is anticipated to report impressive year-over-year growth in its second-quarter fiscal 2026 earnings, with revenues around $2.01 billion, up 58% from the previous year, and earnings per share estimated to be $0.67. The key focus will be on Marvell’s data center segment and its position in the burgeoning AI semiconductor market. As AI-driven technologies gain momentum, how well Marvell has capitalized on this growth will be crucial for its future outlook. Investors should look for updates on its customer base in AI applications, which could significantly impact the stock’s future performance.
- Autodesk Inc. (ADSK)
Autodesk is expected to report second-quarter earnings of $2.45 per share, with revenues of $1.72 billion. Investors should keep a close eye on how Autodesk’s design software, particularly in AI and cloud-based applications, is being adopted by industries such as architecture, engineering, and construction. The company’s ability to maintain high growth rates in the face of competition will be key to assessing the sustainability of its business model. Any updates on Autodesk’s cloud transition and the growing demand for digital design tools will also provide valuable insight into its future performance.
- DiDi Global Inc. (DIDIY)
DiDi is set to release its earnings today, with an estimated earnings per share of $0.436 and projected revenues of $55 billion. Key metrics to monitor include user growth, profitability trends, and regulatory developments, especially regarding China’s stance on ride-sharing and technology companies. DiDi’s ability to navigate the competitive landscape in China and its ability to improve profitability despite regulatory pressure will be key factors influencing investor sentiment. The company’s earnings report will offer insights into whether DiDi can maintain growth and sustain its market position amidst ongoing challenges in the Chinese market.
Stock Market Report – Thursday, August 28, 2025
U.S. equities began trading today in a subdued mood as investors remain torn between economic data worries versus general market volatility. The S&P 500 and Nasdaq Composite fell marginally, weighed down by tech sector weaknesses, whereas the Dow Jones Industrial Average remained robust based on defensive issues. The Russell 2000 for small-caps remains weak as it mirrors precarious breadth in the marketplace. Market sentiment remains vigilant based on continued macroeconomic headwinds such as weaknesses in the labor market and inflationary pressures combined with geopolitical risks.
Stock Prices
Geopolitical Directions and Economic Measures
Market’s muted mood today is a result of a combination of domestic economic developments as well as international uncertainty. There are signs that the U.S. economy is weakening, with recent employment data much lower than expectations, which is a cause for concern over a robust recovery. Moreover, President Trump’s persistent intervention in trade policy, such as recent tariff implementations, is troubling the market further, adding to already increased geopolitical risks. Investors are keeping a keen eye on forthcoming economic reports in a bid to gain a clearer outlook on the economy’s future direction and are set to respond sharply if there are any hints at further slowdowns in a specific sector or sectors such as growth or even in some cases tech-oriented businesses.
Stock Markets Update
- $NVDA: NVIDIA remains ahead in the data centre segment with revenue expansion roughly 10 times in the last couple of years. Most of its company’s data centre revenue, nearly 50%, is contributed by only two large customers probably $AMZN and $MSFT. That concentration in its customer base is indicative of its prime position in the cloud and artificial intelligence segment but is vulnerable if those customers experience any issues.
- $UNH: UnitedHealth Group maintains its leading position in the global healthcare industry, taking a commanding 25% share of global healthcare revenue. Its leading position is an indication of its strategic significance in shaping where healthcare is headed in a stable period when the broader marketplace is uncertain.
The Magnificent Seven and the S&P 500
The “Magnificent Seven”—Apple, Microsoft, Nvidia, Amazon, Meta, Alphabet, and Tesla—are showing signs of fatigue, with the group averaging over an 18% drawdown from their recent highs. Tesla and Meta lead the decline, suggesting that valuation recalibration is underway across growth stocks. The S&P 500 continues to rely heavily on the performance of these tech giants, with investor confidence in the broader market increasingly tied to the recovery of these key players. Without a significant rebound from these companies, the index remains vulnerable to further pullbacks.
Large-Scale Index Performance up to Thursday, 28th August 2025
- S&P 500: Trading at 5,841.52, down 0.4% on the day.
- Nasdaq Composite: 18,220.78 now, -0.6% lower with bear pressure coming mainly from losses.
- Dow Jones Industrial Average: Higher 0.2% at 41,182.34, led by gains for energy and financials.
- Russell 2000: Even at 2,147.63, lagging behind because of rate sensitivity in small-cap issues.
For Zaye Capital Markets, sector rotation is still a focus with specific emphasis on momentum driven by AI as well as geopolitical issues. Due to frailty in leadership in the tech sector as well as continued economic issues, we are still stressing quality stock fundamentals and are carefully watching developing trends for risk as well as opportunity.
Gold Price – Thursday, 28 August 2025
The value of gold increased today to $3,396.28 per ounce versus a close of $3,377.11 per ounce in the previous day. That is a very modest 0.57% gain. That rise comes just one day after a volatile slide in which gold briefly fell to $3,366.00 on August 25 before a quick recovery. Tensions over geopolitical issues such as President Trump’s request for George Soros to be charged, threatened travel bans for EU officials over a censorship issue, and a declaration by President Putin announcing peace talks in Budapest with President Zelenskyy have injected a great deal of uncertainty into the marketplace. Such a circumstance would typically cause investors to seek safe-haven investments such as gold in an attempt to hedge geopolitical risks on their rise. Such instability continued in combination with a possibility for further diplomatic negotiating ahead in keeping a bullish price direction in gold.
The price direction for gold is further influenced by today’s economic data releases, including Preliminary GDP and the Unemployment Claims, which will provide fresh information on the health of the U.S. economy. Should the Preliminary GDP indicate a softer-than-expected GDP expansion or increased-than-predicted unemployment claims result in a shift in the Federal Reserve’s stance towards dovishness and weakening in the U.S. dollar, a softer greenback would generally strengthen gold prices as investors find it more appealing. These dual influences—geopolitical risk and meaningful economic indicators—are generating a backdrop where safe-haven buying is beneficial for gold, and further weak economic information might generate still more upward momentum for its price in the near term.
Oil Prices – Thursday, August 28 2025
As of today, Brent crude costs $67.69 per barrel, a slight drop amid a set of factors. Ending the U.S. driving season for summer has caused softer demand for fuel, while lingering geopolitical risks, including President Trump declaring a 50% duty on Indian imports of oil, are causing volatility. The duty is an attempt to force India to end its low-cost imports of Russian oil, but continued Russian purchases by India sparked fears for tit-for-tat action that is hindering the worldwide oil market. As an additional factor, the International Energy Agency (IEA) predicted a record rise in worldwide oil supply for 2025 based on production cuts unwinding by OPEC+ nations. However, expectations for demand growth were reduced amid softer consumption in major economies such as Europe, the U.S., and China.
Ahead, today’s economic releases, such as Preliminary GDP and Unemployment Claims, are set to significantly influence oil market sentiment. Should such releases indicate a softer U.S. economy, it may give rise to expectations of a dovish Federal Reserve stance, thus weakening the U.S. currency and buttressing oil values. However, better-than-anticipated releases may strengthen the buck, putting downward pressure on oil values. Already struggling in the international oil marketplace with supply disruptions as well as geopolitical risks, economic releases for this week are set to significantly determine the direction in which oil values take in weeks ahead.
Bitcoin Prices – Thursday, August 28, 2025
As of today, Bitcoin (BTC) is at $111,603.99, a subdued 0.43% rise over yesterday’s close. Bitcoin has been volatile in recent weeks, trading between $110,000 and $113,000 in the past week or so, with price action fueled by economic data, institutional action, and global events. Bitcoin’s ascent is supported by recent events like the establishment of a US Strategic Bitcoin Reserve in 2025 by an executive order which infused institutional credibility and solidified Bitcoin’s increasingly integral role within the financial system. Moreover, institutional flows into Bitcoin remain a mainstay driver to its intermediate- and long-term bullishness based on over $35 billion in institutional investment so far this year.
The ongoing geopolitical tensions, such as President Trump’s comments on Soros and potential travel bans for EU officials, have created uncertainties in traditional markets, which can spill over into Bitcoin’s price action. While these developments may introduce short-term volatility, Bitcoin’s decentralized nature and increasing recognition as a store of value position it as a potential hedge against traditional financial market instability. Additionally, the U.S. government’s pro-crypto policies, alongside institutional adoption driven by entities like family offices and government strategies, are providing a solid foundation for Bitcoin’s long-term growth. These factors are likely to keep Bitcoin in a favorable position as a hedge against global uncertainties, despite the short-term fluctuations driven by economic data and geopolitical events.
Ethereum (ETH) Prices – Thursday, 28 August 2025
Ethereum (ETH) is now at $4,533.84, a 0.7% drop since its last close. This comes in the aftermath of an early bull run in August when ETH had gone past $4,800 on institutional buy interest alongside whale buying sentiment. Despite this recent correction in the market, however, ETH slipped once again to major support at around $4,500. Despite this very short-term volatility though, its long-term direction is still bullish based on strong on-chain signals alongside continued institutional adoption gains. Its price action is now monitored carefully since it is holding a consolidation above those levels with a breakout in the near term a possibility should support stay strong.
Ethereum ETFs witnessed strong inflows with $455 million in a single day last week in a display of institutional interest even larger than Bitcoin ETFs. It is an indication of increased belief in Ethereum’s future based on recent whale behavior—one large whale closed out a $450 million long position prior to buying up $108 million in ETH spot. That implies large investors are positioning for still further appreciation, which would further increase Ethereum’s upside potential. As Ethereum’s ecosystem gets support in such institutional buying and whale behavior, even a price correction would be a buy signal for those in hopes of playing longer-term appreciation.
