Where Are Markets Today?
As of Thursday, August 21, 2025, U.S. and European stock futures are sending mixed messages as markets still respond to persistent volatility. U.S. stock futures were mostly flat in overnight trading, echoing the cautious mood after a four-day losing streak for the S&P 500. Tech stocks, led by Amazon, Apple, and Alphabet, continued to pull the wider market down, with the S&P 500 futures, Nasdaq 100 futures, and Dow Jones futures all trading close to the flatline. European futures, however, are mildly higher, with indices like the DAX and Euro STOXX 50 recording modest increases. This points to a more upbeat mood among European investors, but overall, the world is holding its breath in anticipation of the Federal Reserve’s annual Jackson Hole symposium.
The main cause of the mixed futures action is the continued rotation in market leadership, most notably in the technology space. The big tech names, including Amazon, Apple, and Alphabet, have all incurred heavy losses, each falling by more than 1%. Chipmakers have also been weak, with Broadcom falling 1.3% and Intel losing a substantial 7%. In spite of year-to-date growth, which has been strong, the market is now adjusting its expectations for the tech sector, amid concerns about overvaluation and further underperformance. This persistent weakness in the tech arena is capping overall market sentiment, not allowing futures to gather strength. A second major factor driving futures markets is the expectation ahead of the Federal Reserve speech at the Jackson Hole symposium. Investors are searching for hints about the direction of U.S. monetary policy going forward, and specifically interest rates. With the Fed’s recent moves under the microscope, the market is extremely sensitive to any indication of future rate reductions. Fed funds futures now price in an over 80% probability of a rate cut in September, which might bring some respite to markets. But this uncertainty about what the Fed does next is adding to the conflicting market signals, as investors recalibrate their expectations in light of Powell’s statements.
Looking at European markets, the slight upward movement in futures could be attributed to a more optimistic outlook on the continent, despite the global volatility. European investors appear to be more confident about regional economic resilience, though they too are awaiting the insights from the Fed’s Jackson Hole meeting. Additionally, concerns over global growth, inflationary pressures, and tightening monetary policies are on investors’ minds, as the ECB continues to monitor developments in both the U.S. and the broader international market. As a result, European markets are seeing modest gains, but caution remains as the global economic landscape continues to evolve.
Key Index Performance through Thursday, August 21, 2025
- S&P 500: At 6,300.00, down 0.2% for the day.
- Nasdaq Composite: Down 0.6% at 21,500.00 as technology sector weakened.
- Dow Jones Industrial Average: Up 0.1% to 44,950.00, driven by financials and industrials sector gains
- Russell 2000: At 2,100.00, down because of rate sensitivity in the small-cap space.
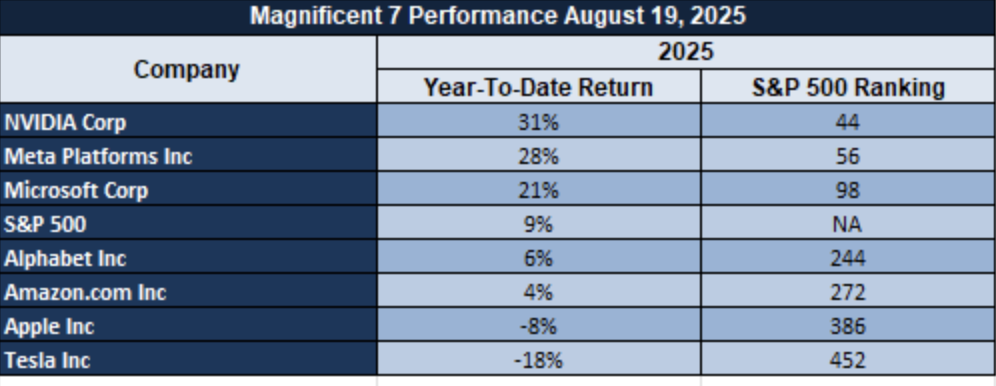
The Magnificent Seven and the S&P 500 Index
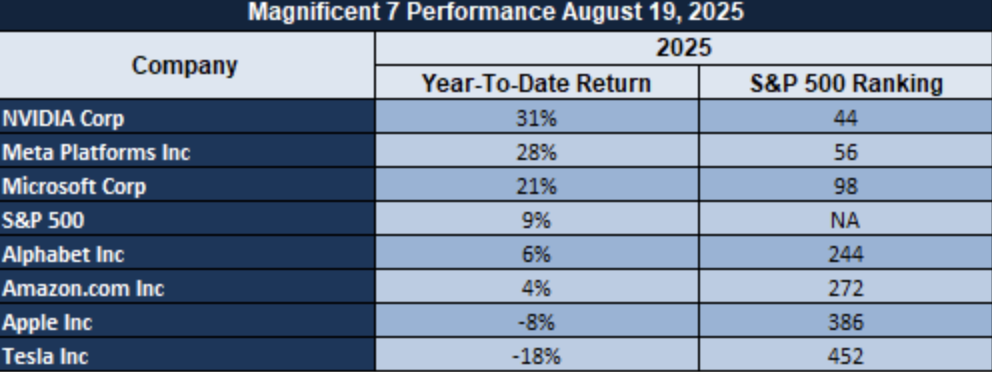
The “Magnificent Seven” Apple, Microsoft, Nvidia, Amazon, Meta, Alphabet, and Tesla are weakening. In a recent sector break, the whole group has averaged above a drawdown of over 18% from recent highs, with Meta and Tesla at the lead. It is a signal of valuation rebalancing, especially in AI-growth names that have gotten a bit ahead of themselves. Pressure continues to be on the S&P 500 as leadership within the technology sector is dwindling. While energy and industrials are offering some support, the index is not going to be able to rally from a sustainable perspective until it sees more participation from its mega-cap engines.
Drivers Behind the Market Move – Thursday, August 21, 2025
As of Thursday, August 21, 2025, U.S. and European markets are charting a complicated course amid political events, economic numbers, and central bank expectations. U.S. futures are flat after a four-session losing run for the S&P 500, with technology stocks still pulling the wider market down. European futures are modestly higher, echoing guarded optimism before important economic data reports. Investors are keeping a keen eye on these events to determine the short-term direction of the markets.
1. Political Pressure on the Federal Reserve
Recent demands by President Donald Trump for the resignation of Federal Reserve Governor Lisa Cook due to purported mortgage fraud have deepened political pressure on the central bank. The accusations, which were leveled by Trump supporter Bill Pulte, indicate that Cook falsely represented her primary residence in order to secure favorable loan conditions. Cook denied the claims and said she would not step down. The issue adds to the strains between the Trump administration and the Federal Reserve, which may impact investor attitudes and market stability.
2. Economic Data Releases
Economic data on the docket for today that are likely to be key drivers of market action include Flash Manufacturing and Services PMIs for the U.S., Germany, France, and the Eurozone, along with U.S. Unemployment Claims, the Philly Fed Manufacturing Index, and Existing Home Sales. These reports will give a sense of the health of the global economy and could shape expectations for future monetary policy action. Investors will be parsing these reports closely to gauge economic momentum and any inflation pressures.
3. Jackson Hole Symposium Anticipation
The Jackson Hole Economic Symposium is scheduled to start today, and Federal Reserve Chair Jerome Powell is due to speak on Friday. Investors are looking forward to hearing Powell’s thoughts on the economic outlook and the Fed’s interest-rate strategy. The symposium is an important venue for central bankers to convey policy intention, and Powell’s comments have the potential to strongly influence market expectations and investor attitudes.
In short, the market moves today are being determined by a mix of political news, economic data releases, and anticipation of the Jackson Hole Symposium. Investors are trying to balance these to determine the possible effects on market stability and economic growth.
Digesting Economic Data
The Trump Tweets and Their Implications
President Donald Trump’s recent statements have triggered a spate of interest in the sectors, and his tweets and statements continue to set market sentiment and the overall economic climate. One of the more sensational of the events has been Trump’s demand that Federal Reserve Governor Lisa Cook resign, and calls for action to be taken urgently in reaction to what he portrays as fiscal mismanagement. Such a statement is bound to have profound effects on financial markets, particularly in the banking and the regulatory arena. The uncertainty over Federal Reserve leadership is likely to trigger more volatility, particularly in the most exposed sectors to monetary policy, i.e., banking and investment.
In addition, Trump’s condemnation of green energy projects such as solar and wind as “the scam of the century” illustrates his continued resistance to green energy. The remarks may discourage investor demand for clean energy stocks and projects, which have emerged as leading concerns for long-term growth and green technology innovation for the global economy. His determination to shut down such projects illustrates possible policy changes that can affect the investment in green technology, generating a sense of uncertainty in the renewable energy industry. Investors in energy stocks need to remain constantly on the lookout for legislative alerts or policy changes emerging out of Washington in the months ahead. Further, Trump’s direct investments in shares of firms such as UnitedHealth Group ($UNH) and Meta Platforms ($META) are undeniable evidence of Trump’s continuing intent to influence markets, particularly in crucial sectors such as healthcare and information technology. Not only do such investments indicate Trump’s faith in such businesses, but they might also signal about policy measures that could have significant implications for the future trajectory of both industries. By his direct investment in financial markets, Trump’s political and personal moves have the potential to provide investors with important cues towards the future direction of such stocks.
Lastly, Trump’s general political activity, like his ongoing participation in Russia-Ukraine peace negotiations and his ongoing criticism through media in the public arena, are all reasons for scepticism in world markets. These geopolitical news developments can also create discomfort for investors, especially in sensitive industries like defense, energy, and tech, all highly sensitive to world news. When geopolitical tensions are heightened and his foreign and domestic policymaking intervention is continued, financial players are going to have to keep keen attention on his tweets and his commentary in the public arena for any policy changes that have the capacity to impact performance in markets. Trump’s tweets are still the best volatility indicator, particularly in sensitive sectors, so his comments are still a leading indicator in making financial choices.
Analyzing U.S. Building Permits and Housing Starts: A Potential Economic Slowdown Signal
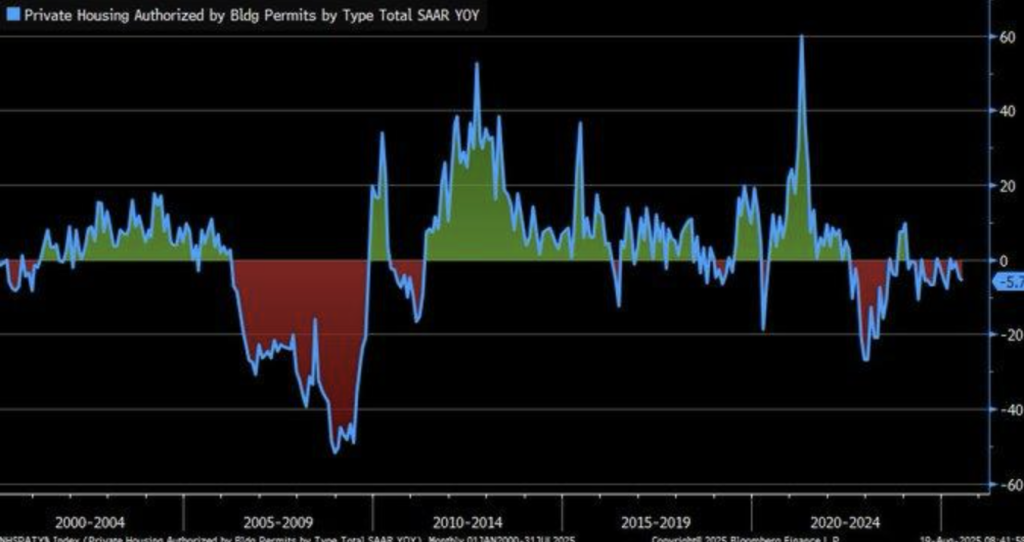
Latest figures regarding U.S. building permits report a dismal year-on-year fall as permits decreased by 5.7% in July 2025 compared to July 2024, according to the U.S. Census Bureau. As this seasonally adjusted annual rate of permits decreases to 1,354,000 in this trend, bad signs are signaled regarding slowing in the housing market. Building permits are one of the best indicators of future housing action with a fall potentially indicating tighter supply in housing with a resultant impact in economic trends.
Meanwhile, housing start data records a 12.9% increase to 1,428,000 units in July 2025. This seeming disconnection with permit data records a scenario where building accelerates despite fewer new permits added. The disconnection may be caused by builders pushing projects under previous approvals forward or faith in market fundamentals despite fewer new permits. These trends must be tracked closely by analysts particularly under a situation of higher material and labor costs that may still keep building moving forward despite possible regulatory restrictions.
History provides a bit of background context on this divergent path. Parallel trends in management of the 2008 financial crisis, with a divergent path of building permits versus starts, followed an enormous bust of the housing market. Current conditions, with persistent supply of affordable housing shortages highlighted in recent reports, indicate supply-demand mismatches may be at fault for pressure on housing prices. As analysts, we need to keep those indicators in particular very close watch, particularly in the context of housing market fundamentals as well as longer economic implications.
Slowing Construction Productivity: A Key Indicator of Housing Market Constraints
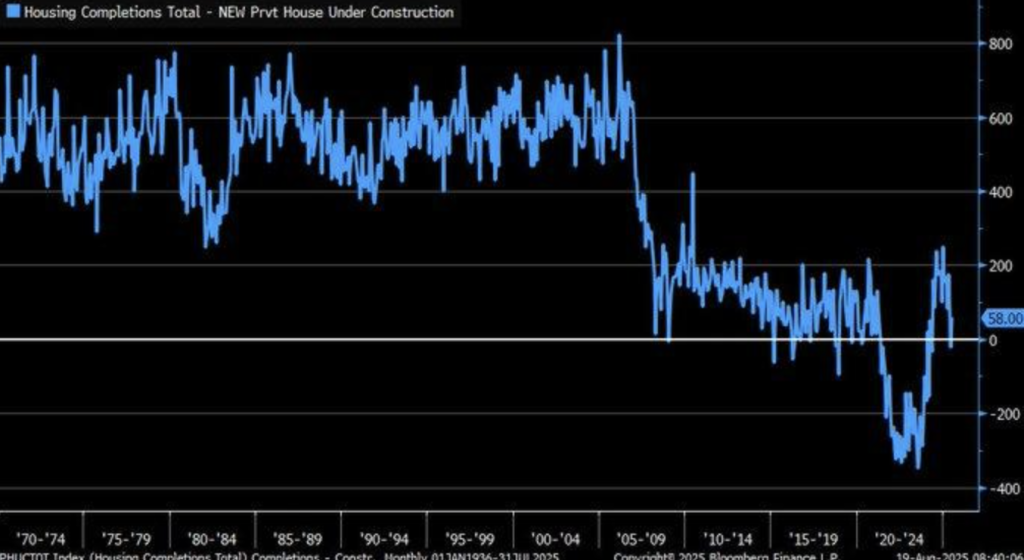
Current data reflect a significant fall in spread between completions and homes under construction. The pre-pandemic level decline is a signal of slowing productivity in construction. Until July 2025, as the gap shrinks, this is a signal of future construction slowdowns or inefficiencies. The trend is even reaffirmed by the U.S. Census Bureau’s New Residential Construction report which registers a slowing pace of construction though demand for housing gathers pace.
Homes under construction minus homes finished display deceleration of construction pace and not just output. The disparity shows deceleration of construction pace and accordingly shows delay which may be caused by issue in scheduling of the manpower or supply chain or material non-availability which impacts pace efficiency of construction. The delay may influence timely production of homes which otherwise might show supply side constraints to homes market.
This trend aligns with flat 2025 housing market predictions, even as foreclosures are on the rise. These supply-side trends indicate that while demand for housing remains high, the market’s capacity to fulfill this demand is still limited, keeping housing costs high and any future market rebound in check. These trends in construction productivity are leading indicators that market-based forecasting analysts need to track carefully in order to forecast future housing market conditions.
World Oil Supply Projections: Growth Despite Prospective Price Declines
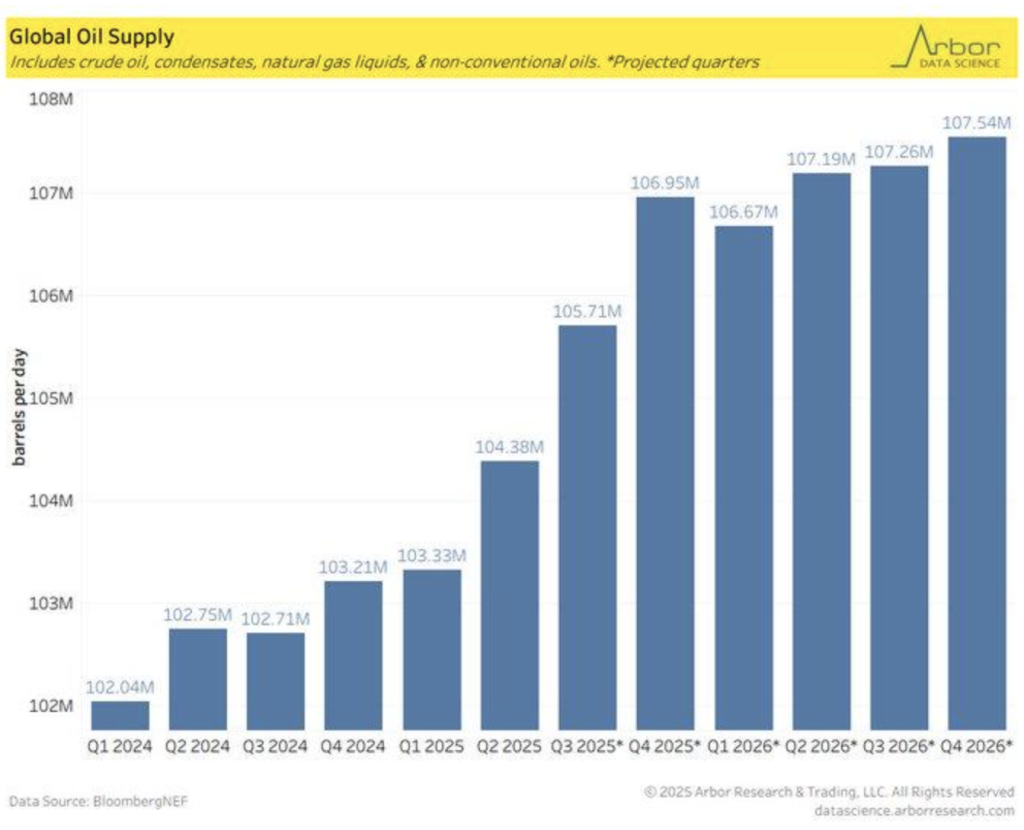
World oil supply will rise by 4.3 million barrels daily, from 103.2 million in Q4 2024 to 107.5 million in Q4 2026. It is mainly because of technological progress in non-conventional oil production like shale, which leads to a steep increase in production. Growth in supply defies market views that Brent crude will drop to $49 per barrel by mid-2026 as the world worries about oversupply. Projections go against prevailing peak oil shortage paradigm and oil supply history of consistently exceeding depletion projections since the 1980s.
This projected increased world oil supply sheds light on sustained enhanced production methods that are non-traditional. The increased production sheds light on prospective future oil breakthrough recovery prospects set to hold the market irrespective of supply constraints. The experts need to keenly monitor advances with special emphasis on increased uses of non-traditional production since they shape tomorrow’s oil market.
This increase in supplies also reflects the location of logistics terminals to facilitate more trade, with key hubs such as Dubai’s Jebel Ali serving as central meeting points. New facilities for producing goods in the area, to fulfill commitments to construct middle east oil infrastructure, will benefit from increasing units of oil trade expected to expand. This extra supply of oil could be highly significant to energy markets globally as increasing developing nations increase the demand. Supply and infrastructure and price trends must be followed intently by analysts as this occurs.
Recession Risk Update: Treasury Yield Curve Implies Stabilization of the Economy
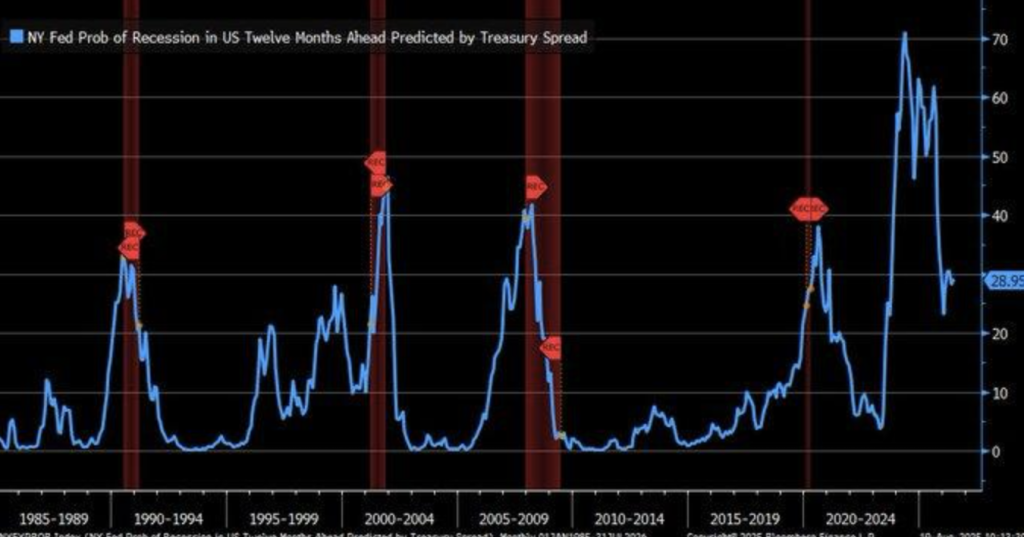
The recent reading on this gauge through the Treasury yield curve spread, which captures the spread between the 10-year and 3-month Treasury rates, shows a declined 29%-probability recession within the next 12 months from its last reading at 70% during previous 2025 periods. The decline may be signaling stabilization of the economy which may be causally related to a recent détente on U.S.-China tariffs. While histories on this gauge going back as far as to periods from around the 1960s to the 2020s show high correlation between inversions of previous yield curves and recessions with 70-80% accuracy rates, today’s recession decline may be signaling an effect on this indicator’s forecasting accuracy due to increasing fiscal intervention during this period.
Despite earlier model strength, its recent high-probability miss is a testament to its frailty as a predictor of recession on its own using yield curves only. The model became suspect among critics especially considering its earlier over-prediction of economic recession. This alludes to a possible fault in its use of spread on the yield curve only as a predictor as it might fail to capture other necessary indicators in real-time such as consumption by consumers or investment patterns by firms which are at the very basis of understanding current economic conditions.
The shift to recession risk necessitates that analysts examine other economic indicators more broadly to give a greater sense of future market direction. Although the yield curve is itself a valuable indicator, the current limitations of the yield curve mean that a more holistic strategy is needed, with a diverse range of real-time data to give a greater sense of economic outcomes to come. Monitoring those wider factors, as well as spread in the yield curve, will be central to seeing the way forward for the economy.
Easing Supply Chain Pressures: A Sign of Recovery
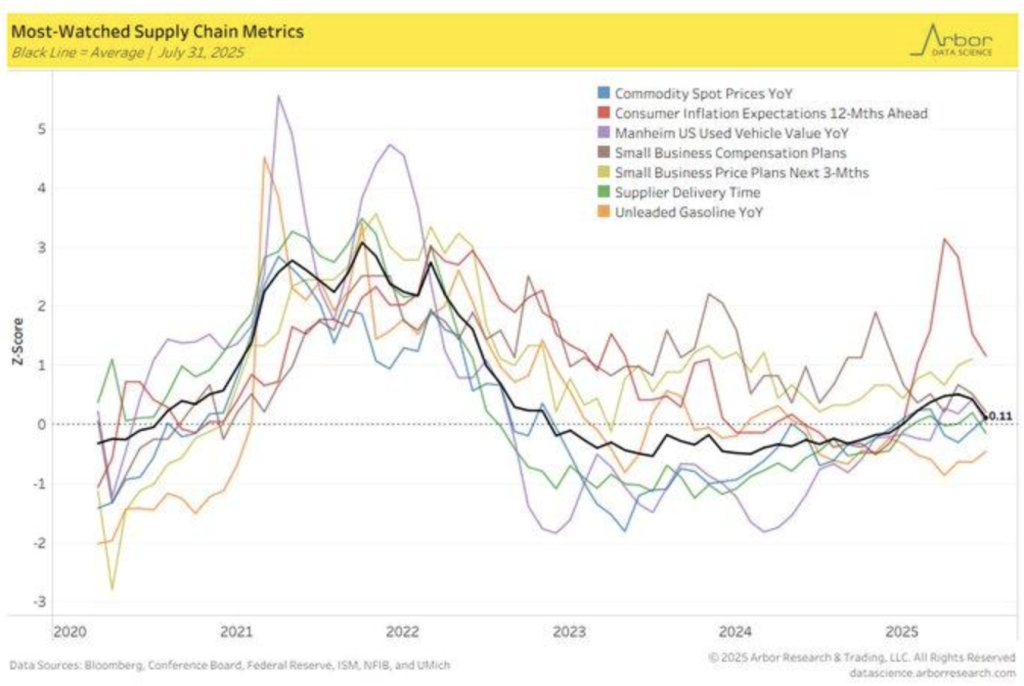
Current statistics tracking supply chain metrics such as commodity prices and ship arrival times between 2021 and 2023 indicate a sharp decline in stress as measured by the black line towards zero. Movement supports recent stabilization of so-called Global Supply Chain Pressure Index and potentially indicates logistics disruptions observed during the pandemic are self-healing post-health crisis. Those findings debunk the supply chain collapse narrative as short-term causes such as port congestion in 2021-2022 were invoked as the main source of stress in a 2023 National Bureau of Economic Research report. The report states 70% of supply chain trouble began with short-term disruptions and not structural causes to support its evidence of recovery.
The charts show supply chain recovery is taking place and has potential as being positive for companies and marketplaces that have faced logistical stress over recent years. Relieving that pressure could offer smoother global trade flows as well as lower costs to companies that have global supply chains. The recovery must be monitored closely by analysts because that could be positive reading for inflation and production costs in the future.
Although data is encouraging on a trend basis, caution needs to be exercised around biases of measures since they are data-based self-report data. Optimism on the industry side could be swaying reported recovery as well, and therefore ongoing observation of supply chain indicators on a real-time basis will be necessary to ascertain whether those trends are sustained going forward. Tracking key sectors which are subject to supply chain disruptions will enable analysis to ascertain whether recovery is sustained on a longer basis.
Upcoming Economic Events
Ahead of a week of key economic data releases, market focus is on a string of high-level reports to influence market mood and prospective central bank policy. Manufacturing data, services data, labour market indicators, as well as residential market performance are among those set to release and possibly influence investor sentiment, currency shifts, and overall economic outlooks. The following is what to expect over the next few days and what each could do to market conditions:
German Flash Manufacturing PMI & Flash Services PMI
Germany’s flash services and manufacturing PMIs are the Eurozone economy’s leading indicators of health.
- A reading above expectations will be interpreted as an indication that the region’s largest economy is expanding quicker than predicted, and that can support the Euro and assist in improving sentiment for European shares. That could lead to an improvement in investor sentiment in the region, especially in those parts which are influenced by industrial production and services.
- If the data, however, are disappointing and poorer than predicted, they would primarily re-stoke worry about endemic slumber in Germany’s recovery, and soften the Euro and could push European stocks down. We could also witness a stampede towards haven assets such as U.S. Treasuries.
French Flash Manufacturing PMI & Flash Services PMI
Similar to Germany, France’s flash PMI data will offer a critical assessment of the Eurozone’s second-largest economy.
- A stronger-than-expected report would support the narrative of a robust economic recovery in the region, benefiting the Euro and boosting risk sentiment across European assets.
- Conversely, if the figures fall short of expectations, concerns over sluggish economic activity in France could emerge, leading to a pullback in French equities and a strengthening of safe-haven currencies like the U.S. dollar. Analysts will be looking closely at the balance between services and manufacturing data to get a clearer picture of overall economic resilience.
GBP Flash Manufacturing PMI & Flash Services PMI
The U.K.’s flash PMIs will give a snapshot of British economic pace and come at a timely moment as Britain is going through its Brexit fallout.
- A bigger-than-forecast figure for PMI will show that Britain is recovering at a brisk rate and will be positive to British pound appreciation and a boon to British equities.
- Weaknesses that are weaker-than-forecast could risk stoking slowdown fears for the U.K. and leave the pound weaker and British financial market sentiment souring. A large miss will increase the chances of yet another wave of economic stimulus by the Bank of England with a negative hit to the pound as well.
EUR Flash Manufacturing PMI & Flash Services PMI
Eurozone Flash PMIs will give a larger picture of this region’s economic engine.
- If data beats forecasts, this will more than likely push the Euro upwards and keep risk appetite similar among European equities. The beat may indicate that this region’s recovery is taking pace regardless of region-wide slipping at the global level.
- But a beat versus expectations will solidify worries regarding Eurozone growth prospects and kick the Euro on its heels, encouraging investors to flee to safe havens like the U.S. Dollar. European equities might correct too as investors reassess risk appetite.
USA Flash Manufacturing PMI & Flash Services PMI
The US flash PMI data are one release that is followed religiously since this gives a recent reading on economic activity within manufacturing as well as services sectors.
- If data comes out higher than what was anticipated, this should give a positive fillip to investors’ sentiment and lead to a rally on U.S. equities, especially those within the cyclical space. Strong PMI data may indicate that the United States economy is going on all cylinders and may lead to a move into risk assets.
- But a weaker-than-anticipated report might give a sense that there might be a slowdown both on manufacturing as well as on services fronts and might lead to buying on safe-haven assets like U.S. Treasuries as well as gold and lead to a correction on equities fronts.
Unemployment Cases
Weekly jobless claims remain a key indicator of labor market health.
- Softer-than-forecast print will cement confidence in the US economy as this will indicate that the labour market remains healthy with consumption remaining strong as well. This will be positive for risk appetite and could drive equities up, especially those that are consumer-sensitive.
- However, a worse-than-expected claims release and a surprise rise in unemployment can revive fear of slowdown in economy. This will trigger flight to safety with the greenback appreciating and bond buying gaining momentum as investors seek to park their money safely.
Philly Fed Manufacturing Index
The Philly Fed Manufacturing Index is one of the important regional measures of overall health of the United States manufacturing sector.
- The better-than-expected reading will put a positive picture where the sector is in favor against global headwinds, and this will enable further risk-taking in the wider market. The upside in U.S. equities, especially industrials, and the greenback will be driven on hopes of economic vigour.
- On data printing lower than expected, this could rekindle worries over the vulnerabilities of the U.S. economy, and this will drive investors to safer investments, including bonds and utility stocks.
Existing Home Sales
The housing property market remains at the heart of America’s economy, and this week’s home sales report will deliver useful commentary on consumer spending and residential buying appetite.
- The higher-than-forecast reading will reflect consumers’ confidence about their economic stand and are set to spend huge money and make a positive addition to the overall economic story. It would also assist to drive confidence among investors by and large in residential and building stocks.
- On the other hand, weaker-than-forecast sales will reflect cooling of residential market appetite and might turn out to be a signal of underlying weakness within the overall economy. It would assist to drive risk-off mood with a move away from equities and safe-haven assets like bonds.
Since the market is already forecasting those future data points, investors and analysts will be especially attentive to surprises that might shift the economic story line. If they are larger or smaller than anticipated, market reactions will be a function of whether or not the numbers are compatible with prevailing economic facts and expectations. Do pay special attention to those reports as they can exert a longer-term impact on currency values, stock market action, and general economic expectations.
Stock Market Performance
Rebound with Weak Breadth
From our seat at Zaye Capital Markets, we’ve seen a good bounce in the U.S. equity indexes off the lows of April 8th, but the action at the ground level is less robust. Although leading indexes have seen good turns, the across-the-board declines and tepid average constituent performance suggest the bounce continues to be concentrated in a more limited group of big-cap issues, and the positives are not being broadened across the board. Our current analysis is as follows:
S&P 500: Positive Momentum but Still Thin Breadth
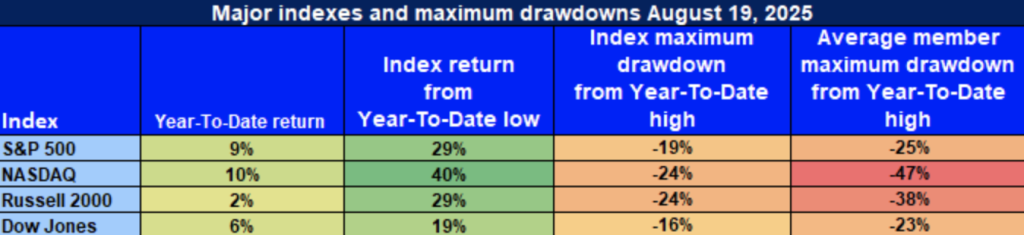
YTD: +9% | -29% from April low | -19% from YTD all-time high | Avg. member: -25%
S&P 500 enters with strong momentum after showing a 9% gain so far in the year and almost a 30% comeback from lows in April. The 19% drop from highs and 25% average loss by its membership, however, indicate the whole rally is still broad-based and volatile in nature. Index gains are still extraordinarily concentrated in a handful of select large-cap names, disguising more basic market weakness on a broad-based level.
NASDAQ: Tech-Led Recovery Brings a Shadow Over
YTD: +10% | +40% below April low | -24% below YTD high | Avg. member: -47%
Top performing leader for January-May 2025 has been the NASDAQ, up 10% YTD and jumped 40% from the lows in April. Even with that blistering performance, though, the 24% top correction as well as the scandalous 47% avg loss for the membership speaks of some serious weakness in the tech universe, particularly among loss-making small tech stocks. Even though the index is keeping up all right on balance, across-the-board weakness is still something to be worried about.
Russell 2000: Small Caps Have Failed to Recover
YTD: +2% | -29% below Apr’s low | -24% below YTD’s high | Avg. member: -38% Russell 2000 has mounted a good rally of some 29% from the April lows, but the insignificant 2% YTD increase is a reflection of investors exercising caution towards economically sensitive small caps. The 24% drop from the high as well as average decline of 38% are indicators of increased risk aversion for the small-cap world, and broad-based engagement in the market still is lacking.
Dow Jones: A Defensive Stabiliser in a Basket
YTD: +6% | -19% below April’s low | -16% below YTD’s high | Avg. member: -23 Dow Jones held steady with 6% YTD performance and smallest key indexes’ drawdown, characteristic of defensive nature. Even in more conventional value segments themselves, however, average decline of 23% indicates stress in these defensive segments, despite relative strength.
Zaye Capital Markets continues to prefer selective, quality strategy with fundamentals-driven business but is concerned with breadth in the market and is holding out for further participation before making a definitive call for a sustained bull trend.
The Strongest Sector in All These Indices
Communication Services Leads in 2025 with Dominant Year-to-Date Gains
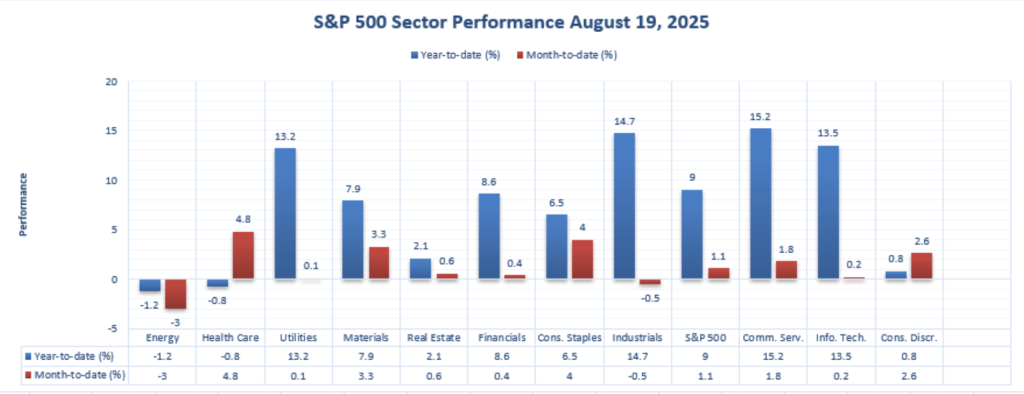
Though overall markets are robust in 2025, sector-specific performance shows where the leadership resides. Closer examination of the sector breakdown here shows that one group outperforms on all measures—Communication Services.
At Zaye Capital Markets, what we are witnessing is that Communication Services has emerged as the year-to-date sector leader so far in 2025, delivering a remarkable +15.2% year-to-date performance. Though its month-to-date performance of +1.8% is less robust, still, it is the best of the 11 S&P 500 sectors, surpassing other hot growth groups like Information Technology (+13.5% YTD) and Industrials (+14.7% YTD). The consistent leadership in Communication Services is a testament to the strong investor appetite for digital ads, media, and platform names that are set up for earnings and revenue surprises in 2025.
This is how the leading sectors fare in year-to-date:
- Communication Services: +15.2% YTD | +1.8% MTD
- ⚙️ Industrials: +14.7% YTD | -0.5% MTD
- Information Technology: +13.5% YTD | +0.2% MTD
- Utilities: +13.2% YTD | +0.1% MTD
Whereas Industrials have had a strong year-to-date performance, this -0.5% MTD change indicates short-term weakness. Likewise, whereas Information Technology has had a strong performance, it has had much cooler +0.2% MTD, indicating some short-term weakness. Communication Services is rare in showing both month-to-date and year-to-date positive direction and strength.
We believe that this is a sign of rising investor demand for the leading digital ad, media, and platform businesses. These industries will continue to benefit from shifting consumer patterns and technological improvements, and they have enormous opportunity ahead for those that think about future revenues and top-line expansion.
Earnings
Earnings Report: August 20, 2025
- TJX Companies, Inc. (TJX)
TJX reported a 4% increase in comparable sales, surpassing expectations. The company achieved a pretax profit margin of 11.4% and earnings per share (EPS) of $1.10, exceeding analyst forecasts. In response to strong demand for off-price goods, TJX raised its fiscal 2026 EPS guidance to a range of $4.52 to $4.57, up from the previous estimate of $4.34 to $4.43. This result was a positive signal that consumer spending remains resilient in off-price retail, helping to boost investor sentiment towards the stock.
- Lowe’s Companies, Inc. (LOW)
Lowe’s reported Q2 2025 earnings of $4.33 per share, beating the consensus estimate of $4.10. The company’s revenue and same-store sales also exceeded expectations, driven by strength in both the professional and do-it-yourself (DIY) segments. Investors were encouraged by the strong sales performance, reflecting the ongoing demand in home improvement despite broader economic pressures. The robust figures underscore Lowe’s solid positioning in the home improvement space, despite market volatility.
- Analog Devices, Inc. (ADI)
Analog Devices posted fiscal Q3 2025 revenue of $2.88 billion, reflecting a 25% year-over-year growth. Non-GAAP EPS was $2.05, surpassing the consensus estimate of $1.93. The company also reported strong cash flow metrics, with operating cash flow of $4.2 billion and free cash flow of $3.7 billion. This positive performance highlighted Analog Devices’ strength in the semiconductor sector, driven by continued demand across industrial, automotive, and communications markets, contributing to investor optimism for the company’s outlook.
- Target Corporation (TGT)
Target’s Q2 2025 net sales were $25.2 billion, a 0.9% decline from the previous year. Despite this, the company beat low earnings expectations, reporting EPS of $1.10. However, shares declined following the announcement, reflecting investor concerns over the sales decline and leadership changes. Although the earnings beat was a positive, the sales performance indicated underlying challenges in consumer spending, particularly in discretionary categories, adding pressure to Target’s stock price despite a strong operational performance.
Earnings Preview: August 21, 2025
- Walmart Inc. (WMT)
Walmart is expected to report robust Q2 earnings, driven by strong U.S. sales as consumers seek value amid economic pressures. Investors will be closely watching for insights into same-store sales growth, e-commerce performance, and the impact of inflation on consumer behavior. Walmart’s ability to maintain sales growth while managing inflationary pressures will be key in determining its future prospects, making this a highly anticipated report. Any positive surprises in these areas could further cement Walmart’s position as a leading player in the retail sector.
- Intuit Inc. (INTU)
Intuit is set to announce its Q4 2025 earnings. Analysts anticipate EPS of $2.12 and revenue of $3.75 billion. Investors will be focusing on growth in TurboTax and QuickBooks segments, as well as updates on the company’s strategic initiatives. The performance of these flagship products, along with any commentary on the upcoming fiscal year, will provide investors with crucial insights into Intuit’s future direction. Strong growth in its core segments could help reassure investors of the company’s ability to continue its market leadership.
- Workday Inc. (WDAY)
Workday is expected to report Q2 FY26 earnings with EPS of $2.11 and revenue of $2.34 billion, marking a 12.3% year-over-year increase. Investors will be focused on the company’s cloud-based software adoption trends, customer retention rates, and any updates on AI-driven product developments. Workday’s ability to scale its offerings and deliver consistent results in the cloud enterprise software space will be key in determining its growth trajectory. A positive performance could further solidify its leadership in the HR and financial management software market.
- Ross Stores, Inc. (ROST)
Ross Stores is projected to report Q2 2025 earnings of $1.53 per share on revenue of approximately $5.54 billion. Key factors to watch include same-store sales performance, inventory management, and the impact of macroeconomic conditions on consumer spending. Investors will be looking for any signs of strength in Ross’s off-price retail strategy, particularly as consumer behavior continues to evolve amid rising inflation and changing spending patterns. Any surprises in these areas could drive the stock’s short-term momentum.
- Zoom Communications, Inc. (ZM)
Zoom is anticipated to report Q2 2026 earnings with EPS of $1.38 and revenue of $1.20 billion, roughly flat year-over-year. Investors will focus on the company’s growth in enterprise customers, expansion into new markets, and any developments in AI-driven communication solutions. Given Zoom’s role in the work-from-home trend, its ability to adapt to changing market conditions and drive enterprise sales will be critical to sustaining its growth in the highly competitive video communications space. A strong report could help reinforce investor confidence in Zoom’s long-term prospects.
Stock Market Recap – Thursday, August 21, 2025
US equity markets saw a spotty day with major indexes seeing selling interest as renewed concerns for valuations within the technology sector and upcoming economic events. The S&P 500 and Nasdaq Composite fell, while the Dow Jones Industrial Average remained unchanged. Traders are watching closely with the Federal Reserve convening in Jackson Hole and wait for the pivotal retail earnings reports.
Stock Prices
Economic Indicators and Geopolitical Developments
Caution in the market is owed to various reasons. Recent selling in tech stocks, especially in the “Magnificent Seven” stocks, i.e., Apple, Microsoft, Nvidia, Amazon, Meta, Alphabet, and Tesla, has sparked overvaluation fears. These have been driving recent years’ upswings in the market, and recent selling in them has contributed to general weakness in the market. Reports have also sparked the possibility that Trump’s government plans to ask for equity stakes in chip companies set to receive CHIPS Act grants, and this has contributed nervousness among investors. Investors are also awaiting the upcoming Federal Reserve symposium at Jackson Hole, as comments by Chairman Jerome Powell can provide indications towards future monetary policy.
Latest Stock Data
President Trump had a personal interest in Corporate Bonds of $UNH & $META
In eyebrow-raising breaking news, Trump himself invested in both Meta Platforms ($META) and UnitedHealth Group ($UNH) corporate bonds. It’s raised concerns about conflicts of interest given the political and business ties involved. The $META investment comes at a critical time as the company continues to position itself for the future with its initiatives making it possible for the development of Artificial General Intelligence (AGI) and its integration into daily life. Profiteering off other than over ads is dubious, however, Meta’s ad monopoly is already powering the training engines that could become the underpinnings of the superintelligence of AI in the future. Stockholders can’t wait to see what happens as Meta’s price range of $650–$675 is navigated by the stock during these formative years.
Jane Street Buys 5% Stake in $CRWV
Jane Street, which is a trading firm, has bought 5% of cybersecurity behemoth CrowdStrike ($CRWV). It is a strategic buy that is a sign of growing interest in cybersecurity stocks as cyber attacks throughout the world are surging and there is growing demand for solid security. With better market positioning and growth prospects, institutional investors like CrowdStrike so much that it is now making quite a splash in the tech world with this buy as well.
The Magnificent Seven and the S&P 500 Index
The “Magnificent Seven” Apple, Microsoft, Nvidia, Amazon, Meta, Alphabet, and Tesla are weakening. In a recent sector break, the whole group has averaged above a drawdown of over 18% from recent highs, with Meta and Tesla at the lead. It is a signal of valuation rebalancing, especially in AI-growth names that have gotten a bit ahead of themselves. Pressure continues to be on the S&P 500 as leadership within the technology sector is dwindling. While energy and industrials are offering some support, the index is not going to be able to rally from a sustainable perspective until it sees more participation from its mega-cap engines.
Key Index Performance through Thursday, August 21, 2025
- S&P 500: At 6,300.00, down 0.2% for the day.
- Nasdaq Composite: Down 0.6% at 21,500.00 as technology sector weakened.
- Dow Jones Industrial Average: Up 0.1% to 44,950.00, driven by financials and industrials sector gains
- Russell 2000: At 2,100.00, down because of rate sensitivity in the small-cap space.
Zaye Capital Markets remains tracking sector rotations and value patterns surfacing for investors during the prevailing market setting. The ability of top stocks to hold onto earnings power as policy tightens will set the tone for overall equity markets for the remainder of the year.
Gold Price – Thursday, August 21, 2025
As of the latest available data, spot gold is around $3,342.03 per ounce, decreasing by a mere 0.09% from yesterday’s price. December-delivered gold futures are at $3,340.00, decreasing by a mere 0.16% from the previous session. These readings indicate that the gold price is in consolidation mode, with investors waiting for clearer cues from near-term economic events. Geopolitical tensions, especially over the Russia-Ukraine conflict, are the main reason for the markets’ volatility, apart from expectations of releases from the Federal Reserve’s Jackson Hole symposium meeting. The results of those deliberations on U.S. monetary policy would do much to define the safe-haven status of gold.
The economic data presented yesterday, including the German Flash Manufacturing PMI and U.S. Flash Manufacturing PMI, have relayed mixed messages regarding the state of the world economy. Some areas have signaled strength whereas others have signaled areas of possible slowdown, causing uncertainty in the market. The uncertainty is causing price volatility of gold as business analysts try to understand the message of the economic data for the future central bank action and world stability. Now, in turn, the gold price is fluctuating with geopolitical uncertainties and changing fortunes for the economy. The market players are analyzing other economic releases in an attempt to get better signals in the direction of gold price in the future.
Oil Prices – Thursday, August 21, 2025
Until today, Brent crude has around $67.10 a barrel, whereas WTI has $63.21 a barrel, both higher slightly. The climb is occurring despite a massive draw in US crude inventories, decreasing 6 million barrels in the period until August 15. Additionally, geopolitical news, including resumed flows of oil along the Druzhba pipeline as well as increased exports by Russia to China, have provided bullish momentum to the price. However, the price is restrained because of supply and demand concerns in the world as a whole. The International Energy Agency (IEA) raised world oil supply growth in 2025 to 2.5 million barrels per day, led by producers in the OPEC+ group as well as other producers outside OPEC. On the other hand, the IEA reduced demand growth for the rest of the year, something that would produce a supply overhang in the event that the production exceeds demand.
Looking ahead, economic data releases today, including the Flash Manufacturing PMI from Germany, Flash Services PMI from France, and US Flash Manufacturing PMI, are key in terms of guiding the direction of oil prices. Worse-than-expected results would be fueled by demand fears, leading oil prices lower. Stronger data, by contrast, would allay some of those fears, boosting the price of oil. Geopolitic considerations, such as ongoing Russian oil exports and OPEC+ policy, are still prominent. Generally speaking, oil prices are extremely sensitive to economic as well as geopolitical considerations, and today’s data are set to make a difference in near-term sentiment in the markets.
Bitcoin Prices – Thursday, August 21, 2025
To date, Bitcoin (BTC) is trading at about $113,980, a modest 0.58% gain from the previous closing price. The digital currency is higher by a little after some consolidation, with the intraday peak being $114,726 and the intraday low being $112,482. The price action is mirroring cautious optimism in the market, driven by long-term positive factors, such as comments from Coinbase CEO Brian Armstrong that Bitcoin can hit $1 million in the year 2030. Institutional demand is also evident, with inflows into Bitcoin ETFs continuing while companies have issued massive purchases, such as MicroStrategy. Market sentiment remains murky, however, as there are some indications of waning interest from the retail sector as well as waning demand for levered long Bitcoin exposure, as evidenced by a precipitous decline in MicroStrategy’s premium to the market.
Bitcoin’s future is also determined by the general indicators of the economy. The upcoming Jackson Hole symposium, whose guest speaker is Jerome Powell, the head of the Federal Reserve, has sparked the panic in the market. The investors are concerned that any change in the monetary policy or any hawkish sentiments from the Federal Reserve will affect the price of Bitcoin, causing the recent fall below $113,000. Nervousness is also rife in the market with the regulators monitoring the volatility in Bitcoin keenly, with institutions like the European Central Bank and the U.S. Treasury raising alarms about the possible dangers. Though the long-term prospects of Bitcoin are promising, the short-term is determined by economic data, news around the regulations, as well as investor sentiments.
ETH Prices – Thursday, August 21, 2025
Ethereum (ETH) is now at around $4,284, up by a 0.36% from the prior close, while intraday traded between $4,114 to $4,370. Thus, so far, Ethereum’s price has done strong in 2025, surging by over 62% in the year-to-date, demonstrating ongoing institutional demand and a swing in investor interest in favor of Ethereum, as there is evidence of an increasing ratio of ETH/BTC. Big deals have also favored Ethereum, as a big whale traded $137 million in ETH on August 18, demonstrating volatility in the markets as well as shifting liquidity. Ethereum’s dominance in the marketplace is still present and expanding in long-term potential. With continued strong showing in Ethereum, institutional investors are quite liking it now.
Whale activities have been extremely prominent in the last days, with lots of massive trades, including a whale exchanging 10,819 ETH to Kraken in exchange for staking and accumulating more than $20 million in profit. Even though there have been closures by the whales, with a $93.5 million long position being closed at a loss by some, sentiment is still bullish but cautious, as the majority of investors still have faith in the long-term future of Ethereum. These activities by the whales and the increasing market share of Ethereum affirm that Ethereum is bound to remain healthy in the world of crypto, with volatility in the near term providing buying opportunities for long-term investors.
