Where Are Markets Today?
European and American futures are opening today mixed but mildly positive. S&P 500 futures have risen 0.05% following the major index establishing its third consecutive all-time closing high, but Dow and Nasdaq futures are stronger at +0.4% and -0.1%, respectively. In Europe, Euro Stoxx 50 futures are up approximately 0.4%, German DAX futures are up approximately 0.3%, and British FTSE futures are up approximately 0.5%. This muted positivity is proof the market is absorbing record U.S. equity levels despite ongoing macroeconomic concerns.
A large sentiment boost resulted from UnitedHealth’s after-hours jump of over 10%, on word Berkshire Hathaway’s Warren Buffett and hedge funder Michael Burry of Scion Asset Management became owners of the insurance company. Intel jumped in excess of 4%, on word the Trump administration would contemplate a United States government investment in the semiconductor maker. The high-profile transactions have acted as confidence boosters, particularly in defensive tech and strategic healthcare, and have bolstered Dow futures, spilling into European markets.
But July’s hotter-than-anticipated Producer Price Index (PPI) reading has cooled euphoria generated in first half of week by tepid CPI prints. The robust PPI reading proves that inflationary forces are still at work and dampens probability of sharp reductions in Federal Reserve rates in the near term. Rate-sensitive technology stocks, in specific, have placed Nasdaq futures on the back foot. The same has been reflected in European traders, playing out the same, balancing American corporate euphoria against inflation and policy tightening fears.
Zaye Capital Markets status quo constitutes a tenuous mix of bullish sentiment supported by strategic investor wagers and macro tailwinds of persistent inflation. Institutional positioning offers a near-term floor to sentiment currently, but forthcoming U.S. consumer sentiment and retail sales prints get to play a decisive role in determining market fate. A bounce can send futures across the Atlantic higher, but a disappointment can flip momentum on its head back into risk-off positioning.
Key Index Performance Up to Friday, August 15, 2025
- S&P 500 (through SPY ETF): 644.95, small one-day gain
- Nasdaq (through QQQ ETF): $579.89, unchanged, dragged down by tech
- Russell 2000 (via IWM ETF): 228.24, off 1.3%, which shows
- Dow Jones (through DIA ETF): 449.16, off slightly as defense strength trumped cyclical losses.
The Magnificent Seven and the S&P 500 Index
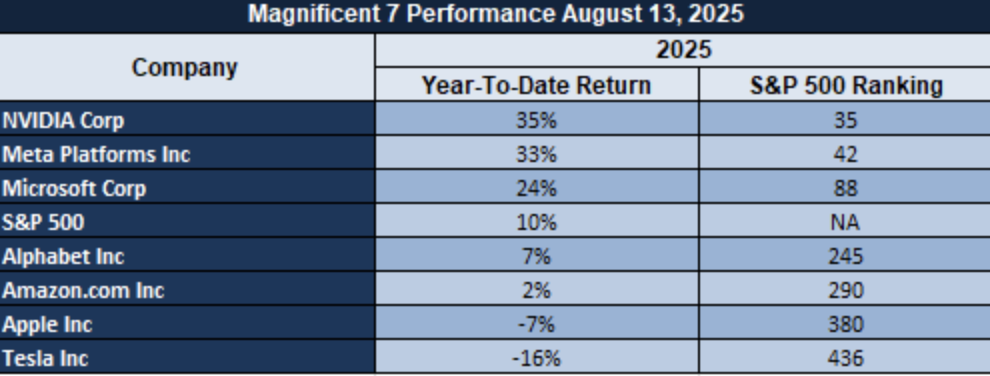
The “Magnificent Seven” of Apple, Microsoft, Nvidia, Amazon, Meta, Alphabet, and Tesla are under pressure, averaging deep drawdowns from recent highs, led by Tesla and Meta. This loss of technology leadership is damping the S&P 500’s momentum, as mega-cap growth has been the driver of recent rallies. Without new support from these names, enduring index gains will prove harder to come by, even as cyclicals and defensives give some support.
Drivers Behind Today’s Market Moves
Here are the three core factors shaping U.S. and European markets today, based on the latest developments:
1. Inflation Shock from July Producer Prices
The U.S. Producer Price Index surged 0.9% month-on-month—well above the 0.2% forecast—pushing annual PPI to 3.3% and core PPI to 3.7%. This inflation spike shattered expectations of a steep 50 bps Federal Reserve cut, dialing confidence down to just 90%, and effectively pushing back hopes for aggressive monetary easing. Markets are recalibrating to a scenario of more persistent inflation and delayed rate relief. This dynamic is placing downward pressure on rate-sensitive sectors like tech and growth, tempering futures gains for indices such as Nasdaq and S&P 500.
2. Trump’s Optimism Tempered by Reality
President Trump’s recent declarations—that inflation is “down to a perfect number” and that 401(k)s and the stock market are “soaring”—have injected a dose of confidence. However, these assertions are increasingly offset by the harsh reality of inflation data and the political dismissal of the BLS chief, raising questions about economic narratives and data reliability. Meanwhile, geopolitical hopes surrounding a Trump–Putin meeting in Alaska are cautiously supporting energy and commodity sentiment, though markets remain wary of false dawns.
3. Geopolitical and Macro Data in Focus
Investors are watching the forthcoming U.S. economic indicators—core and headline retail sales, Empire State manufacturing, and University of Michigan sentiment and inflation expectations—as potential market-moving catalysts. Positive surprises may reignite easing hopes and buoy risk assets, while soft readings could reinforce caution. Concurrently, anticipation of the Trump–Putin summit, potentially affecting energy flows and global stability, adds another strategic consideration across equity, commodity, and currency markets.
Digesting Economic Data
The TRUMP Tweets and Their Implications
President Trump’s latest comments provided markets with a multi-faceted bundle of upbeat sentiment, policy clarity, and geopolitics of mixed signs for asset classes. His commitment to cut a deal with President Putin—”I think he’s going to make a deal” and “Putin is convinced he’s going to make a deal”—can ease near-term geopolitics risk premia and energy and commodity markets. Yet he concurrently delivered an open-ended communiqué, threatening withdrawal in the face of a “bad meeting” and emphasizing economic incentives at the possible expense of sanctions. This double-channel message has markets on high alert for clues from subsequent diplomatic exchanges, and specifically oil and gold markets for signals of supply and safe-haven demand.
With regard to economic policy at home, Trump’s message that there’s “hardly any inflation at all” and inflation is “down to a perfect number” tried to frame the current macro environment in stable and business-friendly terms. With his message that “401(k)s and the stock market are soaring,” there is such a message to encourage positivity among equity investors, particularly in consumer and cyclical stocks. Narrowing inflation risks, however, could constrain market preparation to policy response as inflation pressures re-emerge, making interest rate expectations vulnerable to rapid data-driven corrections. Protectionist trade policy endures. President Trump’s serial veto of Chinese imports of Electric Vehicles—“I don’t like losing business to China” and “Chinese EVs aren’t coming into the United States because of tariffs”— portends continued protection of foreign motor manufacturers, to the advantage of supply chains and domestic ones but at risk of counterproductive trade retaliation. His green light on Nvidia’s Blackwell chip portends continued political favoritism of domestic dominance in tech, consistent in industrial policy themes which would increase semiconductor holdings and semiconductor infrastructure plays.
At the world level, Trump’s blunt message to EU leaders and President Zelensky of “giving up territory will be on the table” indicates a pragmatist, negotiating approach to conflict management, which can alter risk perceptions on defence and energy markets. His mention of a crime bill and Washington, DC, 30-day police takeover extension indicates a law-and-order agenda, which can drive urban bonds, infra spending, and urban investment sentiment. Together, they place markets in the position where they have to balance the tailwinds of business-friendly rhetoric and geopolitcal optimism with the risk of conditional diplomacy, hardline protectionism, and fluid domestic policy agendas.
Wholesale Price Increases Place Additional Pressure on Prices
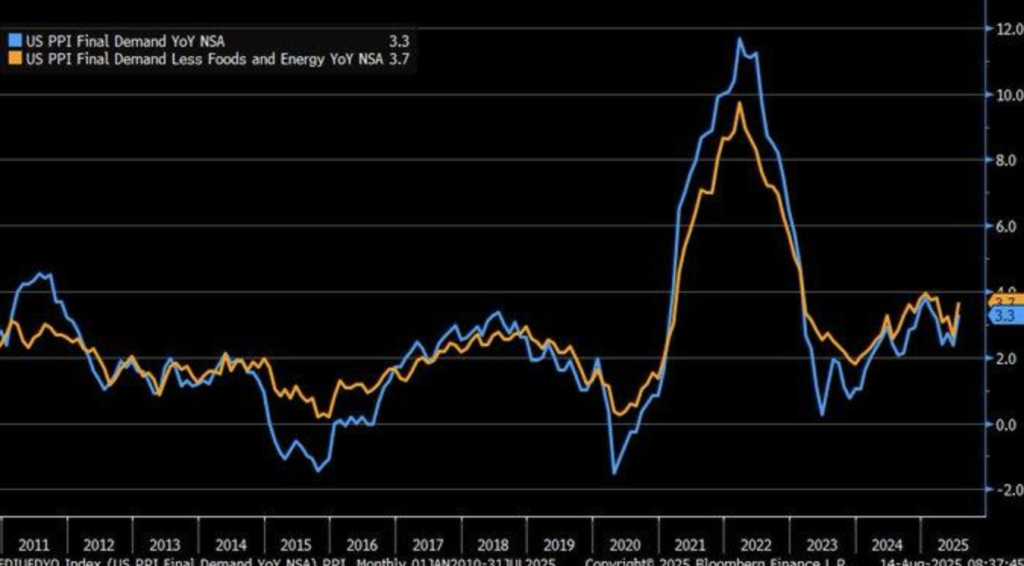
July 2025 data show the Producer Price Index (PPI) increased 3.3% year-on-year, much higher than the 2.5% estimate. The core PPI, ex-food and energy, increased 3.7%, and implies overall wholesale price inflation. It’s the highest increase since mid-2022, and import cost pressures have been supplemented in recent months by protectionist tariff policies. Previous such PPI increases have fed through to consumer prices in the longer term, and such near-term CPI recovery is possible.
This interaction of increased input costs and less desirable supply situation would cause companies to increase costs to consumers, which would reverse previous absorption initiatives. This would strain household purchasing power and delay market views of monetary easing. These import-using sectors are in highest margin strains, and they would dampen near-term equity returns and consolidate inflationary risks.
Relative valuation places General Mills (GIS) in the undervalued list, we believe, using defense sector pricing power and cost pass-through management in the context of high-PPI. The analysts would look for CPI reports to receive confirmation of the pass-through effects, would look at company guidance on earnings for signals on margin compression, and would pay attention to policy of tariffs for softening or tightening that would change the inflation trajectory.
Steady Jobless Claims Mask Regional Labour Shifts
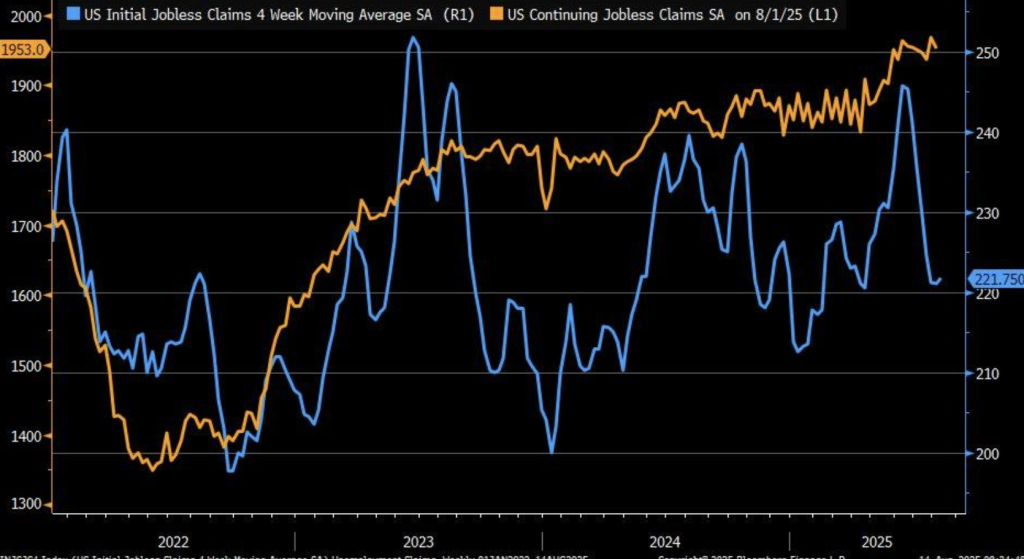
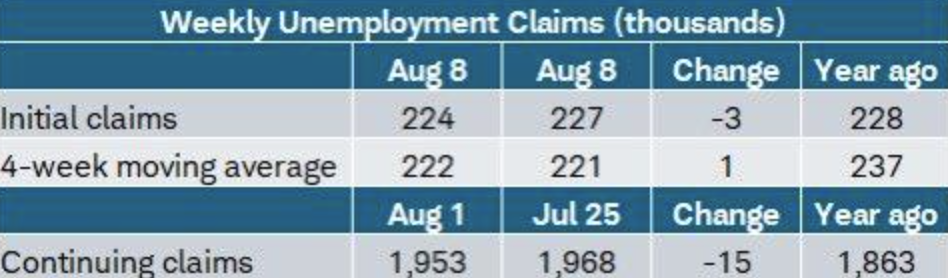
First-time claims for unemployment during the week of August 8, 2025, declined to 224k from 227k, and continuing claims declined to 1.953 million, as well. Four-week moving average, at 222k, confirms a state of steady performance despite historical patterns of variability. Such steadiness signals underlying strength within labor markets, though the non-uniform spread of gain and loss across the states persists.
Interstate variation is large. Massachusetts and California experienced the sharpest increase in claims, which may be a reflection of local softness possibly largely brought about by sectoral slowdown. Conversely, falls in Iowa and Illinois suggest that the thrust of the recovery is not shared evenly around the country. The variations suggest the need to watch both state-level and national numbers.
We consider ManpowerGroup (MAN) to be inexpensive currently, supported by its cycle weakness and geographical vulnerability to markets where labor demand remains robust. It would be interesting to monitor ongoing trends within the four-week moving average, regional labor market condition changes, and possible policy movements that can affect hiring patterns or trend unemployment in the upcoming several months.
Midwestern Shelter Expenses Top the List
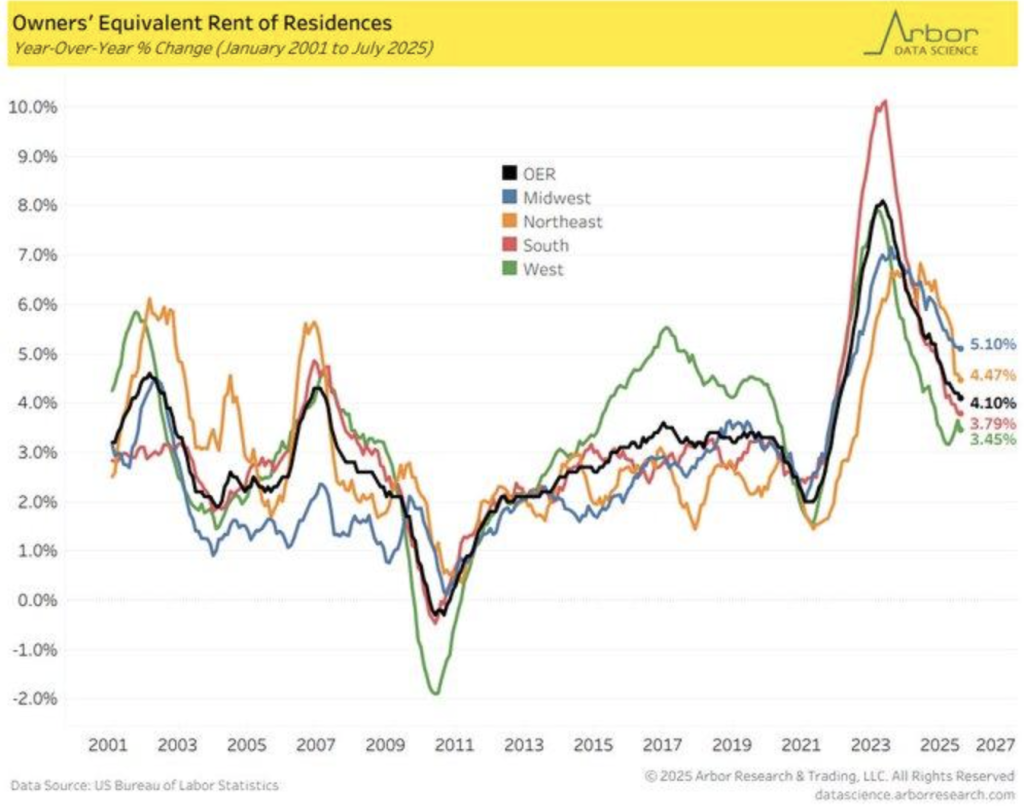
We observe a big turnabout in shelter inflation: owners’ equivalent rent is hotter in the Midwest (5.1% y/y in July 2025) than the West (3.7%). That is the opposite of the typical coastal‑lead narrative and practically certainly implies post‑2023 industrial upkeep, locally limited housing supply and renewed employment in the manufacturing belts. Shelter’s contribution to CPI renders regional bias in the component large enough for persistence of headline inflation.
Wider price mix supports the risk. June CPI increased 0.7% m/m, as energy prices rise 3.2%, spreading pass-through to transport and goods. If Midwest OER continues to be high and energy is strong, national shelter disinflation could be stalled, which would be the damper on easing expectations. The markets would be paying close attention to any hint that rural and industry counties are the marginal contributor of CPI shelter.
We view Caterpillar (CAT) as inexpensive in the meaning of: cyclical Midwest industrial capex and construction sensitivity combined with pricing discipline creates durable cash flows should regional acceleration persist. We would be monitoring: (1) OER spreads within census regions, (2) apartment lease-renewal and vacancy rates within Midwest metros, (3) manufacturing center wage increases, and (4) gasoline and utility prices which can prolong the inflation push.
Mortgage Requests Up As Rates Remain Low
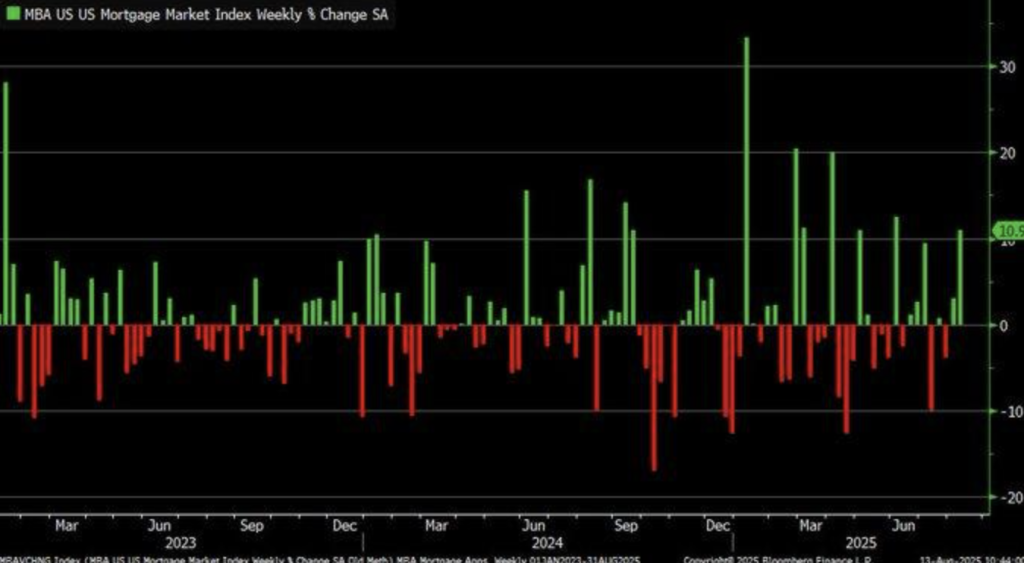
U.S. mortgage applications jumped 10.9% during the first week of August 2025, the largest increase since the first week in June. The jump occurred as an abrupt fall in borrowing rates to 7% levels once in a while dispersed purchasing activity dampened during the previous period due to concerns over affordability. Earlier patterns, as well as research conducted at the Federal Reserve, indicate that such large cuts in rates can have the power to cause double-digit percentage spikes in applications within two weeks, evidencing sensitivity of demand to credit environment.
Strength in that bulge even as the housing market falls indicates buyers are buying ahead of the curve. That is a defensive play in anticipation of a future supply bulge as sellers that are worried about falling valuations take listings off the board. Such suppositions in the past have proved true during corrections in markets, in which spot inventory draws equate to near-term competition but often dissipate in weeks. According to MBA historical data, 70% of such bulges dissipated within 30 days due to over-optimism running into slower pipelines.
We would look to Lennar Corporation (LEN) to having become inexpensive in such a scenario as they enjoy the benefit of scale, geographical spread, and latitude on prices to join short-term upswings without over-extending into cycle sensitivity. We would keep a close eye on weekly MBA index movements, movement around and within the 6% boundary of affordability, and metro inventory movements. Durable strength in demand would need to be validated through closed sales data and, as such, look upon such growth to be over a transient sentiment upsurge.
Fx Volatility Sinks To One-Year Low, Calm Before The Storm?
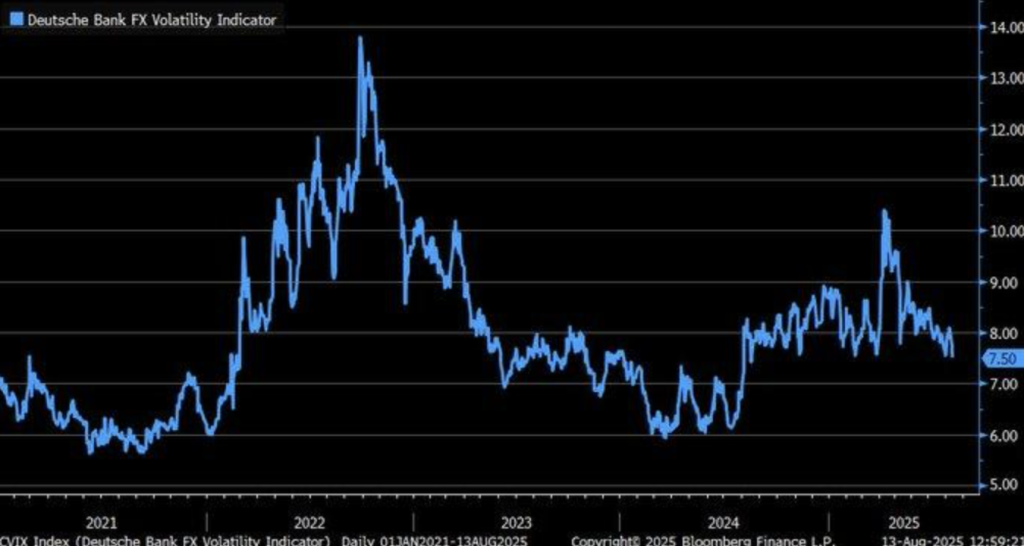
Deutsche FX Volatility Indicator hit a one-year low on Aug 13, 2025, in a record period of tranquility in global currency markets. It’s due to a rare convergence of macro tranquility laid by 2024 geopolitics tensions unwinding, including stabilisation in US-China trade relationships and increased confidence in cross-border capital flows. Such long periods of tranquility can assist in lowering hedging premia and enable carry trades, yet previously they fail to last for much of time without interruption.
Historic V-Lab’s AGARCH measure of volatility and Journal of International Money and Finance (2018) studies reference 68% probabilities of big moves within currencies 30 days after similar volatility low points. These cyclical turning points would be preceded by a return of macro risks—like surprise monetary policy shocks, fiscal surprises, or geopolitics—that need to be repriced quickly by foreign exchange markets. Algorithmic trading fueled by AI can take advantage of such movement even more, since periods of stability of low volatility breed complacency and high directional positions that can be unwound preemptively to the upside if a shock happens.
Zaye Capital Markets considers CME Group (CME) to be inexpensive at this point, as its FX derivatives volumes tend to skyrocket when volatility comes back. The analysts would be wise to be in watch for triggers like surprise central bank rate moves, inflation trend divergences among the major economies, or renewed political hostilities that will break such tranquility. Tracking speculative positioning in the G10 and emerging markets currency futures would be critical in determining the inflection point at which latent volatility transmutes into a full-blown market repricing.
U.S. Soybean exports to China reduced by half as Brazil captured share.
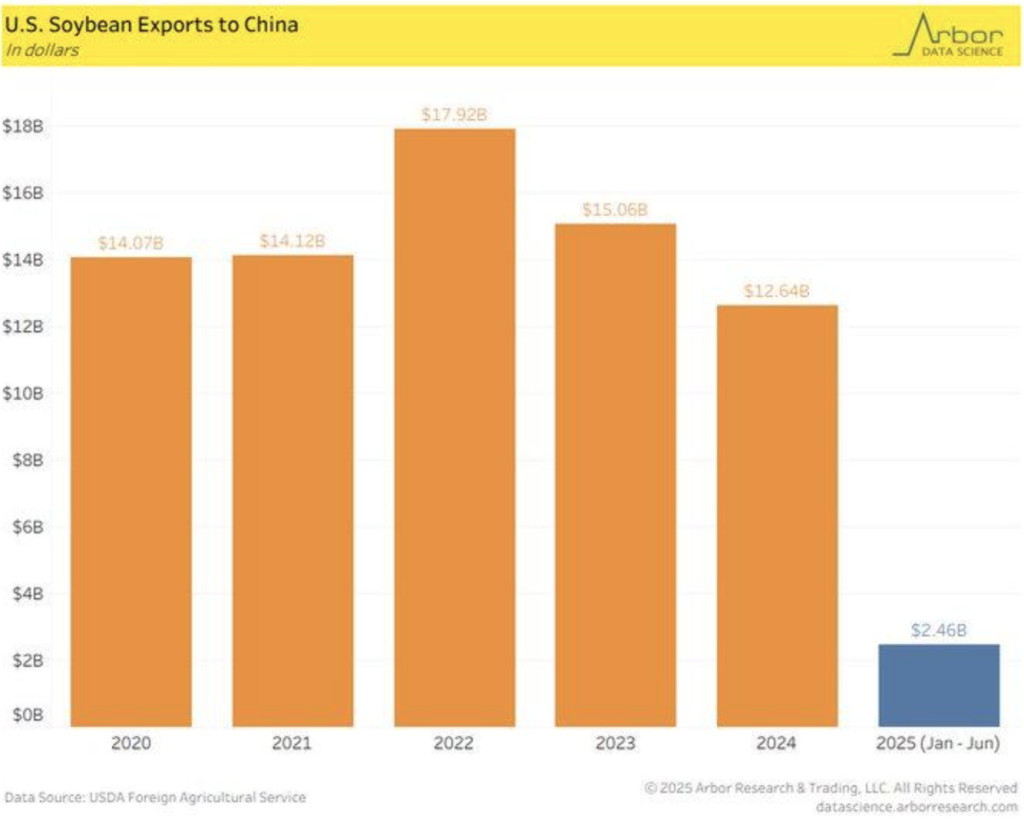
U.S. soy shipments to China declined 50% in the period to June 2025, and Chinese import shipments increased 33%, fueling speculation of seasonal shipment backlogs or reporting errors in customs ledgers. The drop corresponds to the period of sustained trade tensions and changing procurement flows as China aggressively encourages purchases on the world market. Such trends delink the typical U.S.-China farm commerce avenue, a feature of U.S. farm incomes.
Brazilian first half of 2025 exports of soybeans were 31.88 million, much ahead of the United States. A favorable exchange, increased acreage, and favorable autumn weather during the harvesting season have supported Brazil’s competitive edge in exports. To China, supply diversification lowers dependency on the United States, presenting bargaining power to trade negotiations. To the United States, the trend casts into doubt farm exports’ sustainability in the face of strategic buyer shuffling.
Zaye Capital Markets considers Archer-Daniels-Midland (ADM) to be currently undervalued based on its own global sourcing platforms and flexible processing versatility to compensate for fluctuating commerce flows. Investors should wait for new USDA export forecasts, trend Brazil planting forecasts through 2026, and traction on policy shifts within U.S.-China trade policy that would hold or steadily whittle away U.S. market share. The trend right now would be that without sacrificing competitive prices or logistics edge, the United States would gradually cede long-term ground in one of its highest-valued markets.
Earnings Revisions Index Hits Highest Since 2021
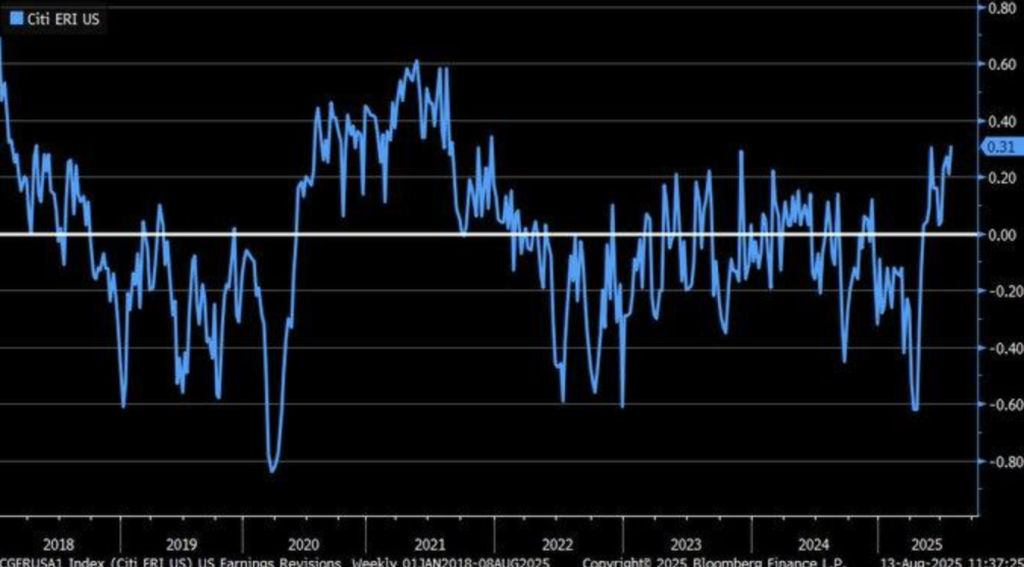
As of early August 2025, the Citi U.S. Earnings Revisions Index stood at its highest level since December 2021, which would be a sharp spike in analysts’ upgrades of companies’ EPS forecast. The index, measuring net offset of EPS revisions on up and down sides, reflects broad based sector wide optimism. Past such spikes have marched in lock step with glittering performance in the S&P 500 as positive earnings views have propelled equity valuations and risk appetite.
But research cautions that excessive revisions lead to overheating if they are sentiment-based, not fundamentals. Recent euphoria precedes key U.S. economic releases and in the midst of record-breaking political uncertainties, which may amplify market responses. Peak revisions at macro or policy turning points in earlier cycles has entrenched sustainable rallies or deep corrections followed since euphoria had become stretched.
We find Microsoft (MSFT) cheap on that basis, based on diversified revenue stream and broad and enduring traction in profits tied to revision trend but boosted by healthy fundamentals. Macro surprise data, revision breadth at the sector level, and management forward guidance during the call on the earnings, which can be an affirmation or validation of the last round of upgrades, needs to be tracked by the Street. A trend break of this index would be an early indicator of the sustainability of the current rally in the market.
Upcoming Economic Events
Core Retail Sales m/m, Retail Sales m/m, Empire State Manufacturing Index, Prelim UoM Consumer Sentiment, Prelim UoM Inflation Expectations
As a critical trading day approaches, the market’s attention turns to a group of U.S. economic reports collectively that will dictate the near-term policy narrative and risk tone. Reports on the agenda will provide a balanced picture of consumer-buying power, manufacturing health, and inflation sentiment—three factors with the most direct impact on the policy direction of the Federal Reserve and the broad market direction in general. The reaction will be a function of whether data tops or falls short of expectations, and can change tone in equities, bonds, and the dollar.
Core Retail Sales M/M & Retail Sales M/M
Retail sales, and core read off autos specifically, are still a key gauge of consumer demand.
- A higher-than-expected print would confirm consumers still want to spend, boosting consumer discretionary, retail, and payment stocks. The strength would be inflationary driven, however, lifting Treasury yields and countering interest-rate-sensitive names like real estate.
- A lower-than-expected read would signal weakening consumption strength, which would put pressure on growth-sensitive equities and drive bonds higher in expectation of a dovish Fed tilt.
Empire State Manufacturing Index
This regional gauge provides one of the earliest snapshots of factory activity on a monthly basis.
- A higher reading would indicate industrial production keeping pace, a benefit to such cycle plays as transportation, machinery, and materials, and could also boost the U.S. dollar on growth sentiment.
- A lower-than-anticipated print would revive fears of decelerating production, potentially triggering risk-off flows into safe haven stocks and Treasuries following weak retail sales.
Prelim. UoM Consumer Sentiment & Inflation Expect
Consumer spending willingness and optimism level are indicated by the sentiment index, and the inflation expectations component will likely influence the policy preference of the Fed.
- A sentiment beat with solid inflation expectations would primarily benefit equities without surprising bond markets. Stronger sentiment with rising inflation expectations, however, would pressure yields since markets point towards further tightening risk.
- Weak sentiment with low inflation expectations, however, could trigger safe-haven bond buying, and defensive sectors are firm on the equity markets.
We at Zaye Capital Markets will be closely looking at convergence—or divergence—of said points. Good, inflation-compatible numbers can extend cyclical momentum, but weak or mixed numbers may direct flows to defensive positioning, which would be challenged to sustain the current advance in equities.
Stock Market Performance
Indexes Recover from Lows in April, but Drawdowns Reflect Narrow Leadership
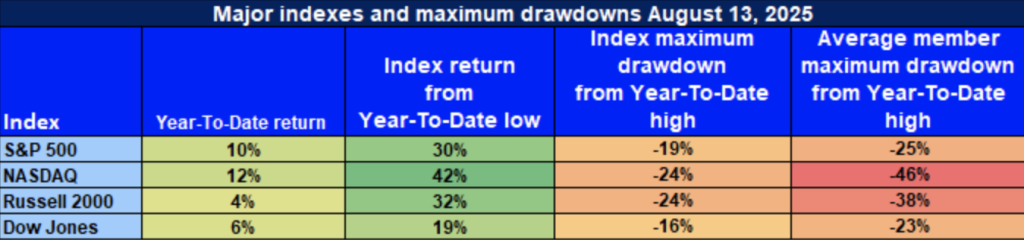
US equities have rebounded steadily since the trough on April 8, but the rally has not been as uniformly steady. Year-to-date action of leading indexes has remained in the plus column, but significant declines from year highs reflect underlying weakness. The trend of strong index-level performance and poor average component performance conceals a leader-led rally, and breadth signals remain worrisome.
S&P 500: Resilient Gains, Narrow Breadth
YTD: +10% | -30% from April low | -19% from YTD high | Avg. member: -25%
S&P 500’s 10% YTD and 30% recovery from Apr lows show headline strength, but its 19% peak-trough and 25% avg. decline of constituents show the strength in the market to be largely in its big-cap leaders, making the index vulnerable to breakdown if the leaders pull back, as its mid and small-cap exposure is currently weak.
NASDAQ: Technology Leads, but Shallow Depth
YTD: +12% | -42% below April low | -24% below YTD high | Avg. member: -46%
NASDAQ is leading the charge and boasts a 12% YTD performance and stunning 42% increase since April. A 24% decline from highs and stunning 46% average member decline, however, indicate the weakness of the rally. Most of the strength is coming from mega-cap tech names, and the rest of the growth sector has been on the defensive, indicating a lopsided recovery in the sector.
Russell 2000: Small Caps Lack Conviction
YTD: +4% | +32% lower than April low | 24% down from YTD high | Avg. member: -38%
In spite of a 32% rebound in April, the modest 4% year-to-date advance of the Russell 2000 reflects muted enthusiasm for small-capitalization stocks. Continuing setbacks reflect investors’ caution regarding less liquid, economically cyclical companies, which are still vulnerable to credit markets and cycle volatility.
Dow Jones: Defensive Edge, Modest Returns
YTD: +6% | -19% below April low | -16% below YTD high | Avg. member: -23% Dow’s defensive tilt has performed well to create a 6% per year return from a relatively modest 16% decline, but a mean 23% loss among its constituents hides trouble simmering beneath. While safer constituencies have been a refuge, they have not been entirely insulated from general market tension.
We at Zaye Capital Markets continue to believe in a quality-driven approach, preferring companies with defensive income streams, healthy balance sheets, and pricing power. We are wary of the current rally until market breadth materially returns, as we view such a recovery as susceptible to definitive turnarounds if macro or policy conditions suddenly shift.
Strongest Sector In All These Indices
Information Technology and Communication Services Take the Lead
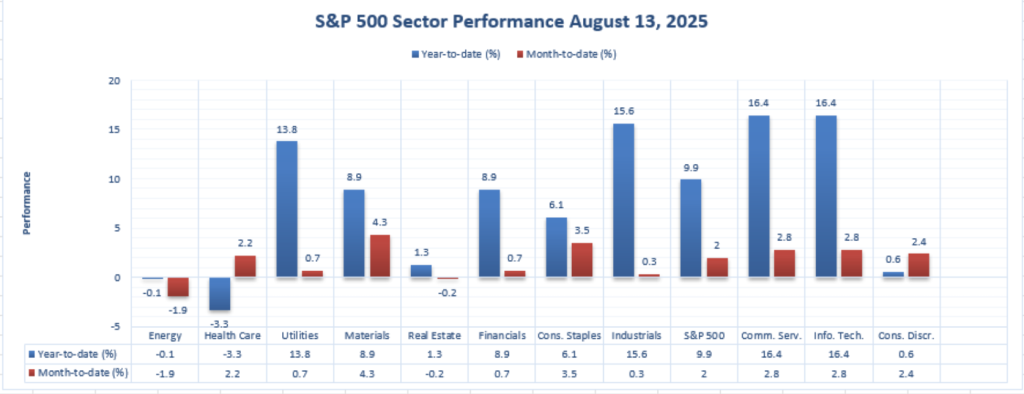
YTD leader to date has been Information Technology and Communication Services tied as a healthy +16.4%. We then have Industrials at +15.6%, and Utilities at +13.8%. S&P 500 remaining on +9.9%, and middle-of-the-pack performance appears in Materials and Financials (both at +8.9%), and in Consumer Staples at +6.1%. Pack laggards include Consumer Discretionary at +0.6%, Real Estate at +1.3%, Energy at -0.1%, and Health Care at -3.3%.
Lead Month-to-Date Performance Materials
Leading the list for the past month is Materials at +4.3%, trailed close behind by Consumer Staples at +3.5%. Communication Services and Information Technology post at +2.8%, then Consumer Discretionary at +2.4%, Health Care at +2.2%, and the S&P 500 at +2.0%. Financials and Utilities trail at the back at +0.7%, Industrials at a moderate +0.3%, Real Estate at -0.2%, and Energy trailing off steeply at -1.9 We expect sustained leadership in growth sectors throughout the year and cyclical and defensive stocks to fuel near-term momentum. Positioning entails a blend of long-term leadership in tech and telecom and tactical exposure to Materials and Consumer Staples.
EARNINGS REPORTS
Yesterday’s Earnings — August 14, 2025
- Applied Materials, Inc. (AMAT)
Applied Materials posted Q3 FY2025 revenue of $7.30 billion, up 8% year-on-year, with GAAP EPS at $2.22 and non-GAAP EPS at $2.48, surpassing consensus by $0.14. Margins improved significantly, with gross margin at 48.8% and operating margin at 30.6%, reflecting strong semiconductor demand and AI-driven investment. Analysts should watch forward guidance and potential litigation developments impacting global operations.
- Deere & Company (DE)
Deere reported Q3 net income of $1.29 billion ($4.75 per share), down from the prior year, with revenue slipping 9% to $12 billion. Management lowered full-year guidance, citing tariffs, weaker crop prices, and cautious demand. The results point to softer agricultural activity, with inventory management and policy risks being critical for future performance.
- Dillard’s, Inc. (DDS)
Dillard’s delivered Q2 EPS of $4.66, beating expectations of around $3.75, on revenue of $1.51 billion. Comparable sales grew 1%, although retail gross margin narrowed to 38.1% from 39.1% last year. While sales momentum remains intact, analysts should monitor cost pressures and margin trends in a competitive retail landscape.
- NetEase, Inc. (NTES)
NetEase reported Q2 revenue of approximately $3.89 billion and EPS of $2.07, both missing estimates. Shares declined sharply as the results signalled weaker monetisation and potential slowdown in user engagement. Product pipeline execution and guidance will be key watchpoints for sustaining investor confidence.
- Nu Holdings Ltd. (NU)
Nu Holdings’ Q2 net profit surged 42% year-on-year on an FX-neutral basis, with revenue reaching $3.7 billion. The strong growth reflects expanding digital banking adoption and efficient cost management. Analysts should focus on credit quality metrics and expansion into new markets as drivers of sustained performance.
- Quantum Computing Inc. (QUBT)
Quantum Computing missed both earnings and revenue expectations in Q2, with revenue falling to $61,000 from $183,000 last year. The steep decline underscores early-stage execution risks, making cash runway and project delivery timelines crucial indicators going forward.
Today’s Expected Earnings — August 15, 2025
- Flowers Foods, Inc. (FLO)
Flowers Foods is set to release Q2 results before market open, with EPS expected at $0.29 and revenue at $1.27 billion. A beat could signal resilient demand despite consumer headwinds, while margin performance, inventory trends, and expense management will be pivotal in assessing operational health.
- Foot Locker, Inc. (FL)
Foot Locker is anticipated to report earnings today amid ongoing operational challenges. Investors will focus on whether a turnaround is emerging, with same-store sales, inventory management, and cost control serving as key indicators after a period of steep losses.
- Alibaba Group Holdings Ltd. DR (BABA), VEON Ltd. DR, Corporacion America Airports SA
These companies are listed for potential earnings today, but no confirmed release times are available. For Alibaba, the next earnings report is expected on August 21, making today’s market impact negligible unless surprise disclosures occur.
Stock Market Recap – Friday, August 15, 2025
U.S. markets ended the week cautiously, as investor mood remains split between favorable headline indexes and weakening undertows of market softness. While the S&P 500 stands at record heights, breadth is faltering and leadership is weakening. Inflation persistence, sector rotation, and changing geopolitical themes are at the forefront of market minds.
Economic Trends and Geopolitical Shifts
Current market caution is based on macro and policy fundamentals. Ongoing inflation above 3% has moderated futures of near-term easing from the Fed, and business cycle indicators show softening expansion and slowing labour markets. Global trade stability has enhanced, but risks remain, particularly in and around tariff-sensitive sectors. Such scenarios have prompted defensive positioning and selective buying in advance of widespread risk appetite.
Latest Stock Updates
Goldman Sachs has highlighted a sharp increase in the likelihood of an S&P 500 correction—more than 10% in the near quarter and more than 20% in a year—on the back of slowing economic momentum and sticky inflation. Warren Buffett’s Berkshire Hathaway has rebalanced, buying stakes in Nucor and UnitedHealth and selling Apple shares, which were deemed defensive rebalancings. Amazon shares increased close to 3% after Amazon said that it would expand same-day grocery delivery, which sounds good in consumer spending. In the meantime, market flows are a one-way flight out of Big Tech into other areas such as financials, energy, utilities, healthcare, and consumer goods, which may be indicative of a broadening of leadership within the market.
The Magnificent Seven and the S&P 500 Index
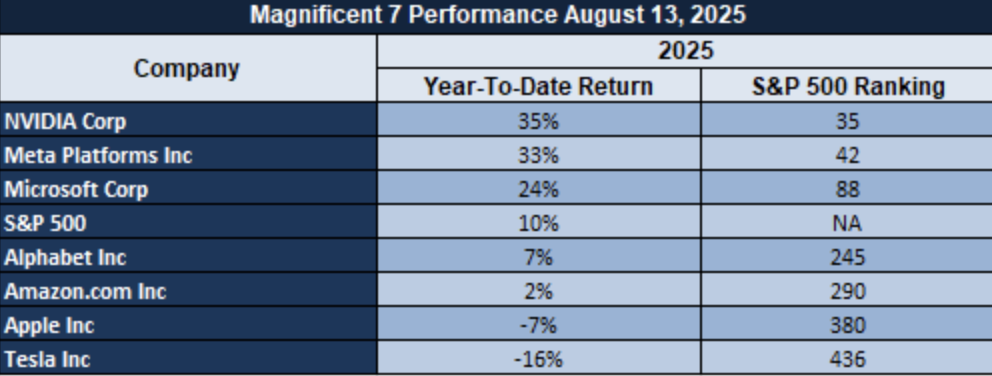
The “Magnificent Seven” of Apple, Microsoft, Nvidia, Amazon, Meta, Alphabet, and Tesla are under pressure, averaging deep drawdowns from recent highs, led by Tesla and Meta. This loss of technology leadership is damping the S&P 500’s momentum, as mega-cap growth has been the driver of recent rallies. Without new support from these names, enduring index gains will prove harder to come by, even as cyclicals and defensives give some support.
Key Index Performance Up to Friday, August 15, 2025
- S&P 500 (through SPY ETF): 644.95, small one-day gain
- Nasdaq (through QQQ ETF): $579.89, unchanged, dragged down by tech
- Russell 2000 (via IWM ETF): 228.24, off 1.3%, which shows
- Dow Jones (through DIA ETF): 449.16, off slightly as defense strength trumped cyclical losses.
Zaye Capital Markets continues to be committed to diversified positioning, identifying areas that are demonstrating strength on an earnings basis, and looking for a catalyst to induce broad-based market participation.
Gold Price
As of Friday, August 15, 2025, spot gold is fluctuating between $3,350–$3,360 per ounce, just under Thursday’s peak of $3,367.53, and the SPDR Gold Shares ETF (GLD) is trading close to $307.25. The modest retreat is a function of a change in market tone as stronger-than-anticipated U.S. macro data has reaffirmed expectations that the Federal Reserve will uphold a “higher-for-longer” policy posture. This has firmed the U.S. dollar and boosted Treasury yields, posing a headwind to non-yielding assets such as gold. President Trump’s recent commentary has introduced a layer of complexity to the outlook—his assertion that inflation is “down to a perfect number” and confidence in reaching a deal with Putin diminish the need for safe-haven demand, but his tough line on sanctions, tariffs on Chinese EVs, and mercurial geopolitical negotiations keep gold in play as a hedge against sudden policy or diplomatic shocks.
Yesterday’s robust data—spanning core and headline retail sales, a stronger Empire State Manufacturing Index, and firm University of Michigan consumer sentiment and inflation expectations—has contributed to confidence in U.S. growth resilience, reducing market demand for aggressive monetary easing. This has capped bullion’s near-term upside potential, with investors pricing in tighter financial conditions. Nevertheless, gold is well-supported in a global backdrop of political uncertainty, patchy economic recovery across regions, and heightened central bank buying from emerging markets. Today’s releases, and particularly consumer sentiment and inflation expectations, will play a key role in determining the next directional move. Softer numbers may revive expectations of policy easing, weakening the dollar and sending gold back toward recent highs, while stronger prints could see bullion consolidate within its current $3,340–$3,370 range.
Oil Prices
Through Friday, August 15, 2025, WTI at $63.57 and Brent at $66.48 after modest intraday bumps in spite of mixed market tensions. On the one hand, euphoria of positive Trump–Putin summit is soothing near-term geopolitics risk, but, on the other, the IEA sees a “bloated” market in the aftermath of OPEC+ production hikes, foreseeing 2.5 million barrels per day of supply growth in the year in spite of lower demand growth of just 680,000 bpd. That disconnect, and historical inventory build projections forward into late 2025, continues to hold back rallies. US shale producers already are cutting back production as current prices remain well below their breakeven points, highlighting the fragile nature of supply restraint in the face of increased OPEC+ supply.
President Trump’s statement that there can be a deal with Putin, and strategic uses of sanctions power, has focused intensified market attention on whether or not the summit will ease or spark supply tensions. A favorable agreement can return Russian barrels into the market, creating oversupply and lowering prices, and a clash can induce risk premiums. Yesterday’s robust American economic performance across retail sales, factory production, and sentiment reinforced domestic robustness in demand but may struggle to counterbalance oversupply threats offshore. In the short term, today’s economic statistics, especially consumer sentiment and inflation expectations, will be critical in deciding whether demand-side sentiment gets brighter or weaker, whether crude prices stay range-bound or break lower to the extent of the prevailing supply narrative.
Bitcoin Prices
As of Friday, August 15, 2025, Bitcoin trades at around $118,981, down roughly 4% intraday off of latest highs after hotter-than-forecast U.S. Producer Price Index readings which fanned dollar bulls, lifted yields, and moderated near-term cuts in Federal Reserve rates. The inflation shock led to over $1.1 billion of crypto market liquidations, mainly on the back of leveraged longs. President Trump’s latest remarks provided a more subtle backdrop—his exuberance over an agreement with Putin and assertions of “perfect” inflation to dampen safe-haven buying, but his vociferous comments on sanctions, Chinese EV tariffs, and praise for American tech superiority to sustain Bitcoin’s macro hedge appeal.
Institutional and corporate buying has offset the macro headwinds. Japanese company Metaplanet contributed over 18,000 BTC holdings, reinforcing Bitcoin’s role as a treasury reserve asset, and Google’s $3.7 billion investment in miner Terawulf will boost network capacity and operating efficiency. These transactions reinforce long-term fundamentals despite short-term cautionary sentiment. Yesterday’s robust U.S. retail sales, manufacturing, and consumer sentiment releases bolstered economic strength, warding off rate-cut hopes. Today’s consumer sentiment and inflation expectations will be the decider—lower readings will resuscitate easing hopes and reinforce prices, whereas higher readings will risk prolonging Bitcoin’s consolidation or send it to lower technical support levels.
ETH Prices
As of Friday, Aug. 15, 2025, Ethereum (ETH) trades around $4,638.53, having fallen close to 2.6% from its recent record high of $4,783 on account of profit-taking and overall market volatility. Institutional appetite is strong, and spot ETH ETF products have registered strong inflows—BlackRock’s ETHA and Fidelity’s FETH have taken in $729 million in net inflows on Wednesday alone, the second-highest one-day influx on record. Inflows add up to more than $2.3 billion in the last three days, driving increasing Ethereum popularity among mainstream investors and its multi-faceted role as a core digital entry in institutional portfolios.
Whale action is putting a twist to price action. The much-watched “7 Siblings” recently sold around 19,461 ETH (valued at around $88 million) after posting record gains from prior accumulation, in what can be read as a savvy profit-taking and not an exit. The controlled selling provides liquidity and flattens too much froth while preserving the long-term bullish setup. With ETH trading near the $4,600 level, the ongoing ETF inflows could mitigate short-term sell pressure to set the asset up for a test of highs if the overall sentiment within the larger market and regulatory clarity continue to support.
