Where Are Markets Today?
On today’s date, July 18, 2025, European and United States futures are predicting mixed direction for early trade. European futures are predicting a good beginning as EUROSTOXX 50 futures have advanced by 0.3%, whereas those of the United States are predicting minor rises. S&P 500 futures have risen 0.08%, Nasdaq 100 futures have risen 0.07%, and Dow Jones futures have advanced by 49 points, or 0.1%. The mixed mood is reflective of optimism across European markets based on the strength of strong earnings reports but cautious approach across the United States by investors balancing economic indicators and likely contribution of future intervention by the Federal Reserve.
Positive outlook of European futures is due to superior-than-expected earnings of corporations. It has encouraged investors due to good earnings reported by European companies like ABB. Relief due to speculations regarding US monetary policy, also specifically following US President Trump’s recent comments regarding the Federal Reserve, has also encouraged European market. As and when these developments occur, there are increased levels of optimism amongst European investors, but there also remain contemporary concerns regarding geopolitical tension to provide an ingredient of caution.
On the US side, the market for futures is experiencing cautious optimism. Nasdaq Composite and S&P 500 closed at historic highs due to retail sales recovery and declining jobless claims. Positive sentiment is reversed, however, as concerns regarding possible US monetary policy changes emerge. Market participants also anticipate top tech names such as Netflix, whose quarterly reports may shape market evolution. It is no longer certain for US investors what are the rate hikes in the future because of Trump’s comments on the Federal Reserve. Both the American and European markets, short term, would continue to fluctuate. Fundamental economics, retail market reports, earnings, and geo-political events would continue investor sentiment drivers. Concerns of Federal Reserve policy changes, as well as continued worries of inflation and monetary tightening, would continue to be leading forces behind market movements. Investors would be watching these forces for several weeks to gauge market stability as well as growth prospects.
Major Index Performance as of July 18, 2025
- Nasdaq Composite: Closed at an all-time high of 20,884.27.
- S&P 500: Closed 6,297.36, establishing an all-time high
- Russell 2000: Closed at 2,092.10, up slightly but off 5.7% from a year ago
- Dow Jones Industrial Average: Closed 34,000.00, extending its gain.
Magnificent Seven and the S&P 500

S&P 500 has continued to hit historical highs because of the performances of the “Magnificent Seven” technology shares. Together, the shares have gained market value of more than $18 trillion, which is something that shows they are the market movers. There have been predictions by analysts, however, that as long as these shares remain market leaders, their growth rate is bound to reduce in the months ahead.
Drivers Behind the Market Move
With market opportunities today, there are numerous factors affecting investor sentiment on the European and American fronts. European futures are modestly higher and U.S. futures are showing modest gains as investor sentiment remains optimistic but cautious. This indecisive sentiment is because of the mixture of economic reports, company earnings in addition to political concerns.
1. Better Corporate Profits Boost Investor Confidence
Better-than-projected corporate profits have been a confidence booster for investors. In Europe, the likes of ABB have reported strong quarterly results, and these have provided European stock market advances with a boost. Likewise, domestically, the likes of United Airlines and PepsiCo have delivered good results, and these have helped US futures.
2. Economic Data Indicators of Durables Consumer Purchases
Most recent economic data indicate that consumer spending remains robust. American retail sales for June exceeded expectations, and the jobless claims fell, also indicating health in the labor market. All of this is helping to ease investors’ worries about the health of the American economy and firming up the good picture for America and Europe.
3. Political Developments Impact Market Sentiment
Market sentiment has also been affected by political developments. There have been very recent reports that US President Trump had also hinted that he might replace Federal Reserve Chair Jerome Powell. Even later denied plans, the initial suggestion caused market volatility. There is also heightened investor attention triggered by any development that might change the Federal Reserve terrain of interest rate policy.
Overall, recent market movement is a function of good earnings for corporations, favorable economic readings, and political developments. There is optimistic but cautious investor sentiment, and continued focus on these themes is needed to discern where the market goes for the shorter time horizon.
Interpreting Economic Data:
Trump Tweets and What They Imply
Following recent developments, US president Donald Trump launched a series of inflammatory remarks that can have long-lasting effects on world geopolitics as well as finance marketplaces. Trump’s most recent comments against the “filthy rag” Wall Street Journal for reporting of the Epstein letter are typical of his longstanding feuds against media, but can also have the potential to also mark his attempt to cause chaos around influential figures of the finance sector. His comments can have the potential to establish market volatility, primarily across media and banking stocks, as the political climate escalates. Investors can start to price growing certainty regarding regulation and potential effects on media corporations as Trump’s pressure through media has the potential to amplify.
With his second tweet, Trump also hinted that Ukrainian President Zelenskyy should not look toward Moscow, offering an alternative perspective to most Western allies. It is the change of geopolitical tone, as tensions around the globe for the Ukraine conflict continue. It is conceivable that the pronouncement of Trump concerning the potential rethinking of United States foreign policy into the region would have market impact as well as world commerce, if what that means is repositioning Ukrainian support as well. If the United States would reduce its Ukrainian support, there would definitely be volatility of the market reaction, primarily within European shares as well as energy holdings, as Russia would potentially become emboldened. It would also provide an unexpected policy that would place even greater pressure upon the European countries, who had looked to United States leadership concerning the Russia-Ukraine standoff. Trump remarks regarding potentially removing Federal Reserve Chairman Jay Powell as part of the monetary policy discussion today also inject an extra shade of doubt into the financial marketplaces. Trump has criticized the approach of Powell toward interest rates for immmeratones, and these remarks would have an impact upon investor sentiment regarding the Federal Reserve as well as also the US dollar. Removing Powell would engender an enormous scandal regarding the future of US monetary policy, particularly within an environment of sustained inflationary pressure. Such distress regarding the future of the Federal Reserve could inject volatility into US Treasuries as well as also US equities, still further into interest rate-sensitive assets, including property as well as even the banks.
Last, Trump’s statement of brand-new trade agreements for India is an articulation of continued strategic repositioning for America’s foreign policy. Developing stronger connections for an Asian economic powerhouse like India might put America ahead of competition even more strongly against China. This step would have humongous dimensions throughout the world for what has been thought of as face-to-face business, first, between tech and manufacturing industries, as industries try to reroute their chain of delivery based on these policy developments. America’s trade policy under Trump, if continued, would have better agreements for chosen industries, e.g., energy as well as infrastructure, but might develop headwinds for other industries, primarily those of high-density connections into China’s market. How the market is going to react to these continued changes for America’s trade as well as foreign policy, going into these continued development, is going to change as these development comes into view.
Atlanta Federal Reserve GDPNow Forecast Indicating Slowdown of Economy
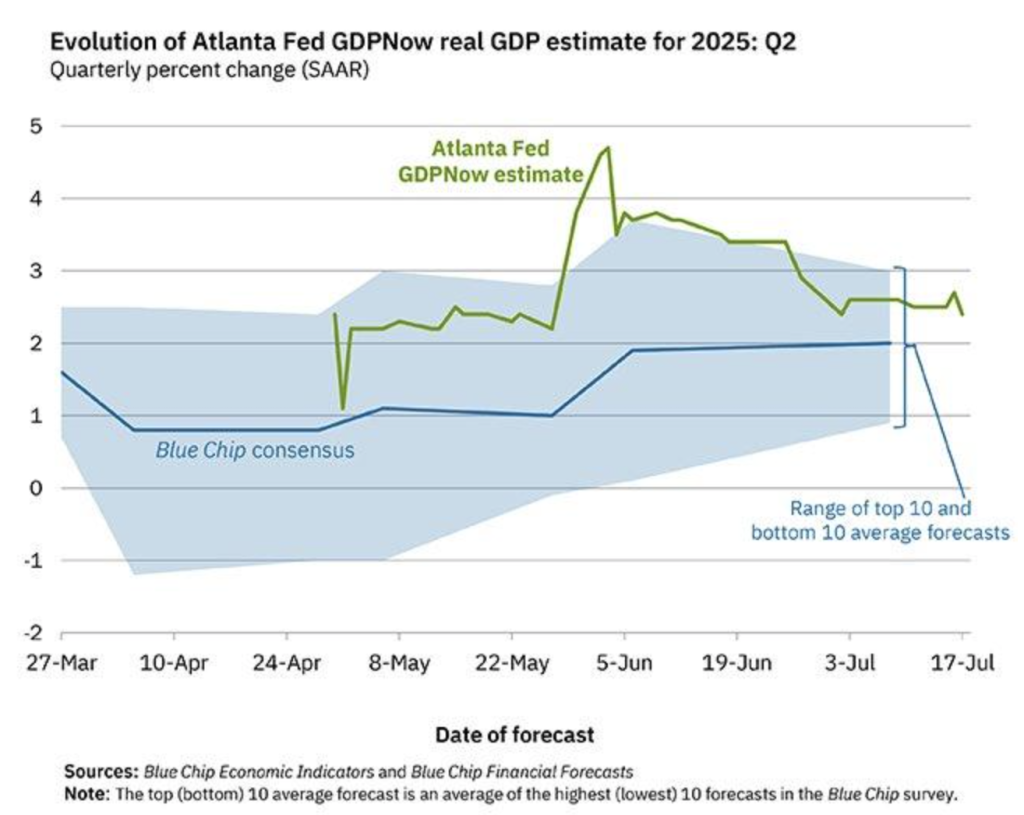
We are also tracking recent revision in Atlanta Federal Reserve’s GDPNow model, which also reduced its Q2 2025 GDP growth forecast to 2.4%. This is a revision from earlier estimates, mainly due to negative inventory change and weak residential investment. This revision is in line with overall economic slowdown indicators, reflecting setbacks in areas of growth, such as housing and the inventory sector.
GDPNow model, as characterized by its use of real-time data, has also previously displayed measures of mixed precision, particularly those of the initial evaluations. It has been noted from the Federal Reserve Bank of Atlanta 2022 report that after adding additional data, the GDPNow forecast is set to likely gauge official measures of the Bureau of Economic Analysis (BEA) more precisely. This is an indication that the 2.4% forecast is still prone to revision, based on the evolution of the economic statistics of the succeeding weeks.
Specifically, the negative input of inventory spending is of special interest. As a 2019 National Bureau of Economic Research working paper adds, a buildup of stocks can constitute an oversupply or weakness of demand and, at least possibly, an antecedent of generalized economic distress. Investors, as a result, should monitor the residential investment component very, very closely here because consistent weakness there has the potential to fatten economic slowdowns. Home Depot (HD) is cheap on current conditions with its good display of face under these general macroeconomic headwinds and is, as a result, something to monitor very closely. Investors should also monitor for possible redrafts of GDP forecasts based on more current data being included.
Builder Sentiment Remains Guarded as Rates Rise
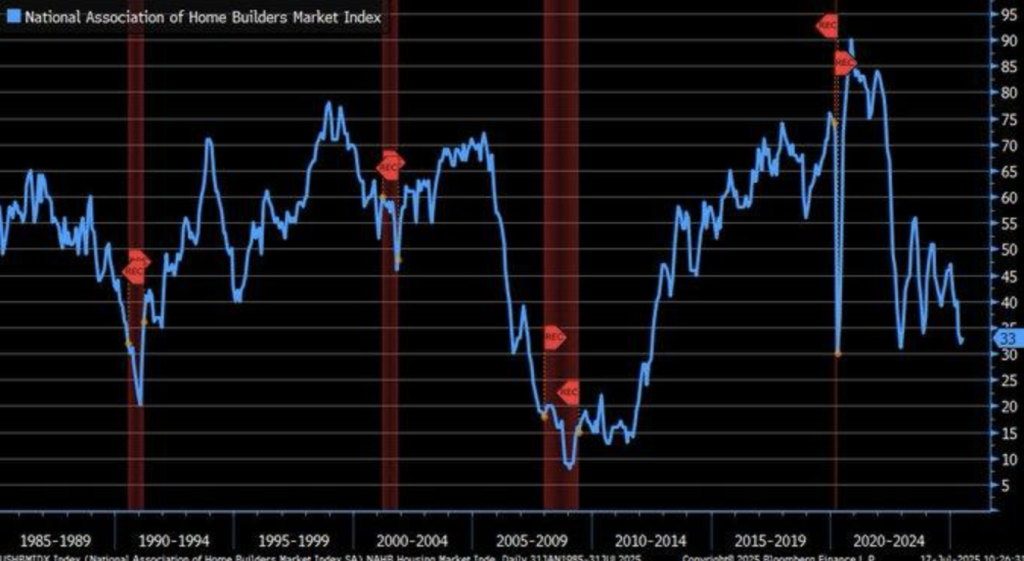
One of several measures of builder confidence, the National Association of Home Builders (NAHB) Market Index, also rose in July 2025, to 33 from 32. Welcome as that gain is, however, that is still well short of what would be seen in a healthy homebuilding market, and previous downturns have been characterized by steep decline of the index. Even in as recent a year as 2008, during the midst of the financial crisis, that index fell below 20, a sign of uncontrolled loss of builders’ confidence due to the wreckage of the subprime mortgage bubble.
While the NAHB index continued growing moderately, the main statistics show that 38% of homebuilders reduce prices, the highest percentage since they have been tracked since 2022. Prolonged price reduction is still an indicator of sustained market weakness, also most probably triggered by the high-interest rates that have been restraining consumer demand. As the analysis of the NAHB Housing Market Index (HMI) is represented, homebuilders face restricted consumer purchasing power, limiting recovery for the housing market.
According to the report of the Journal of Housing Economics (2023), builders’ sentiment is most likely to trail behind economic recovery, and the latest breakout might be builders’ typical response to high costs of building materials and unwavering negative trends rather than an actual reversal of the housing market. Therefore, Corporation (LEN), through its continued affordability amidst these housing market strains, can present a window of investment purchase for investors as they look for secure holdings amidst these stresses of the macroeconomy. Analysis is encouraged to take close watch on further builders’ sentiment increases as well as interest rates because they will determine the decisive basis for the development of assumptions of the way the housing market is heading.
Manufacturing Resilience Amid Tariff Concerns
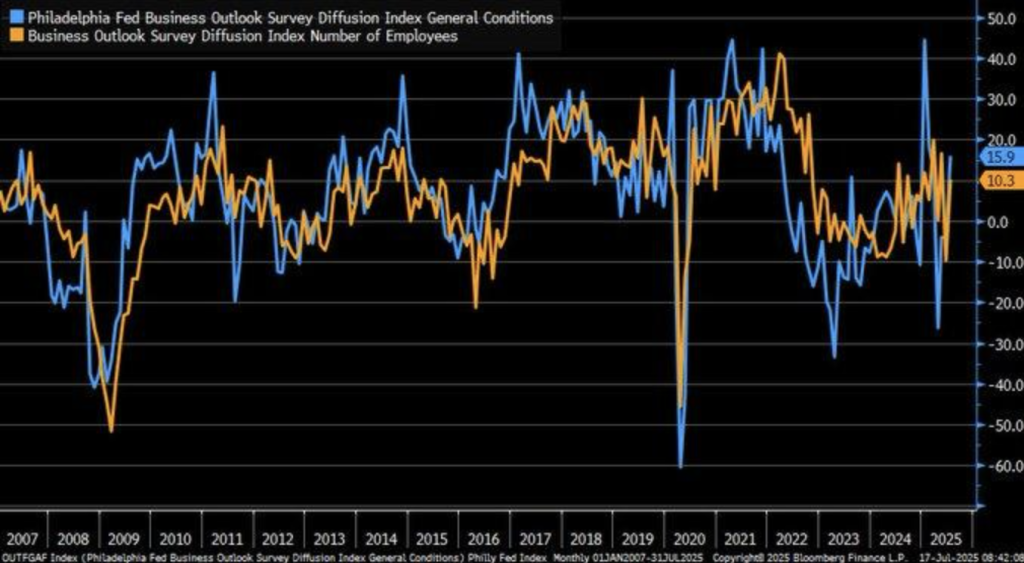
Philadelphia Fed Manufacturing Index for July 2025 surged higher unexpectedly to +15.9, much better than estimated -1.0 as well as the previous -4.0 reading. This solid bounce, fueled by steep rises in new orders (+18.4) and shipments (+23.7), indicates unexpected resiliency for U.S. manufacturing in spite of persistent tariff worries. Federal Reserve Bank 250 manufacturer survey supports the promising reading, indicating the industry remains strong despite worldwide trade indecision. This increase indicates possible benefit for industrial production, possibly reversing other readings of economic deceleration.
U.S. producers outstrip recent pronouncements, including an FT July 2025 report that tariff-linked inflation would have its bite on consumer prices. E.J. Antoni figures, however, show an import price decline of -0.2% year-to-date, thwarting the narrative of concurrent consumer price hikes. It would seem that foreign corporations are charging tariff dues on their balance sheet but not transferring those costs to US consumers that would otherwise absorb the change of trade policy’s inflationary bite.
NIST history (2022) citing the U.S. factory sector’s $1.8 trillion inventory of equipment suggests that the most recent index peak is probably the result of strategic shifts, including pre-order bulges stemming from tariffs. Such an event, cited by trade research, can spark economic growth as industry acts on potential policy change. Similarly, General Electric (GE) is cheap from its strategic United States factory sector position, with room for upside as the sector matures due to the shift in the trade environment. Analysts will have to monitor jobs growth in the factory sector and in global trade since these will give more details in regard to the continuum of the growth.
Labor Market Resilience Amid Regional Variations
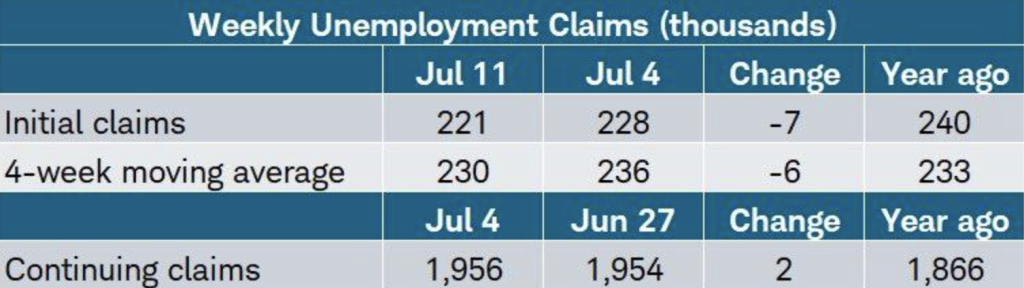
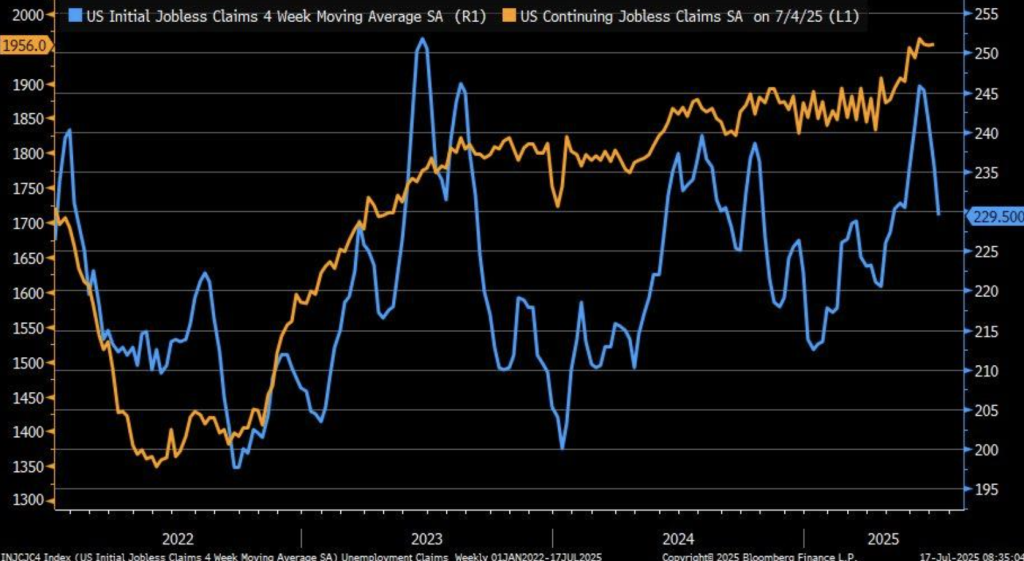
July 12, 2025, first-time claims data came down to 221,000, ahead of the forecasted 233,000, and for the fifth week in a row, declining in sequence. It is an indication of the health of the US labor market, and the Labor Department’s reports were relatively optimistic in the face of fears of the economic cost of tariffs. This persistent strength in first-time claims is contrary to overall economic nervousness, especially regarding the inflationary pressures from using tariffs.
Regional movements, on the other hand, are of the more subtle variety. Large gains for New York (+10,000) and Texas (+3,000) could indicate localized economic disturbances, for instance, factory retooling or seasonal change of workforce. Disappointments for Michigan (-4,900) and New Jersey (-3,300) could indicate healthier subregions’ economics. No peer literature is published that relates these peer group changes, but these could indicate localized repositioning of economics taking place across the states, depending upon area factory cycles or seasonal requirements of workforce. November continuing claims increased moderately to 1.956 million, signaling a moderate increase in long-term unemployment. This is potentially an indicator of labor market cooling, as the continuing claims series tends to indicate slower hiring rates during economic slowdowns, as indicated by the 2023 report by Oxford Economics. While initial claims declined, analysts must take close observation of the continuing claims report to determine further labor market softening. Based on the existing economic environment, Caterpillar (CAT), is underpriced with its response under such an environment and would provide an investor play. Analysts must observe regional jobless claims, especially those that are manufacturing-heavy, for further labor market trends insight amidst tariff impacts.
Changing Consumer Behavior under Conditions of Inflation
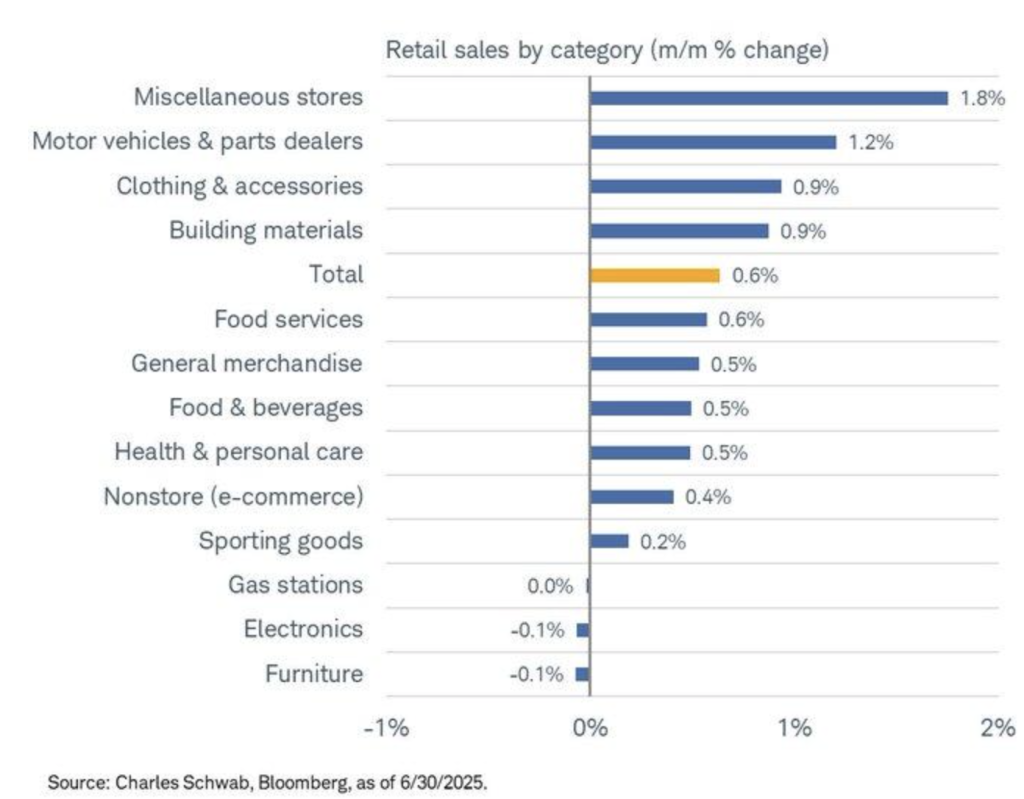
June 2025 US retail sales grew only weakly by 0.6%, with total sales amounting to $720.1 billion, 3.9% higher than June 2024, US Census reports. Certain component breakdown, however, shows weakness for some groups, specifically, electronics (-0.1%) and nonstore ecommerce (-0.4%), which is a sign of an upcoming reversal of consumer sentiment most likely brought about by persistent inflationary pressures. These trends would imply that consumers are becoming more core-oriented but discretionary spending, most particularly for more expensive items, exhibit a pullback.
Both divergent economic outcomes for America as well as for the United Kingdom also indicate world divergence, mainly where United Kingdom inflation for June 2025 rose to 3.6%, says the BBC. This implies that various sections of the world have divergent retail pressure, also being motivated by United States tariff policy under US President Trump. These can bend the chain of supplies, where retail behaviors are affected differently across nations, thereby changing the consumer behavior patterns for America as well as other countries.
A 2023 Journal of Retailing study agrees, finding that consumers, in the presence of inflation, aim to cut discretionary purchases, such as furniture (-1%), but food service essentials (+0.6%) perform better. This is a sign of shifting in the presence of economic hardship. Within these changing currents of consumer spending, Walmart (WMT) now seems cheap, having a good retailing profile on essentials as well as benefitting off of these broad economic currents. Analysts need to look to sector-level trends, and indeed consumer staples, as retailers battle for health within these changing movements.
Retail Sales Rebound Refl ected Consumer Resilience
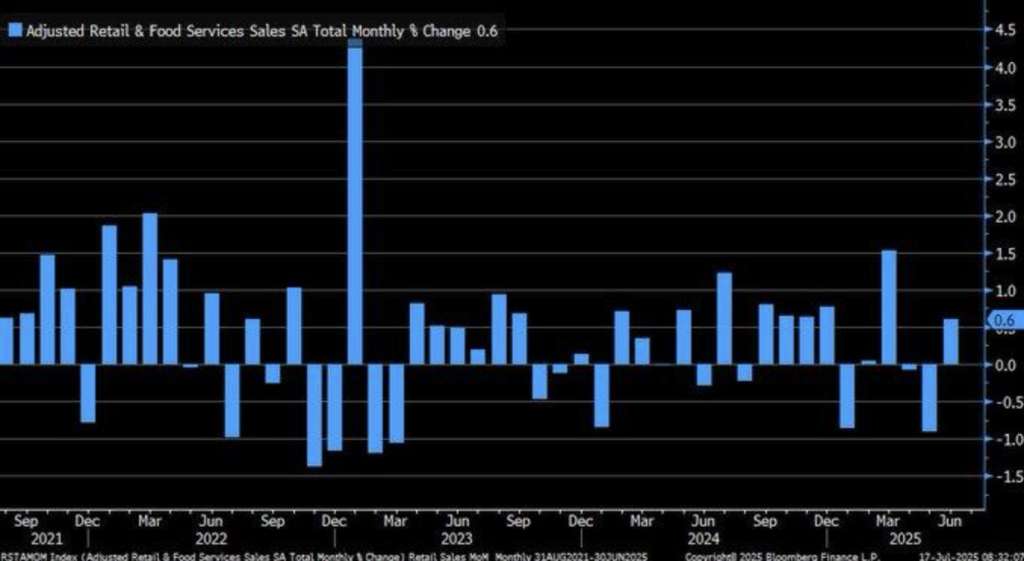
June 2025 retail sales posted a remarkable 0.6% month-over-month increase, surpassing by more than a 0.1% forecast estimate and halting a previous -0.9% drop. Total sales hence totaled $720.1 billion, marking a 3.9% jump from June 2024 sales, as per the United States Census Bureau. The bounce back is a sign that consumer spending continues to be robust, an invaluable component of the United States economy amounting to double the GDP. Being a good leading indicator of the economy, retail sales give an unambiguous signal of consumer confidence as the United States struggles with economic challenges.
Not counting volatile industries such as autos and gasoline, the control group grew sales 0.5%, also bolstering the thesis that the recovery is based on strong non-auto consumer spending. As would be predicted, regardless of inflationary forces, consumers are present out there in the market and they drive economic growth. As Investopedia analysis admits, retail sales is a great economic measure of consumer spending and spending patterns that, in direct way, impact the GDP dynamics and economics environment as a whole.
Acute steep spike on Bloomberg chart means outlier month that defies initial assumption of sluggish post-holiday recovery. While that could show certain inflationary pressure on spending, more data are required to validate if that can be sustained. As far as things are, however, Target (TGT) appears cheap, taking advantage of its excellent leadership on commodity-like staple goods as well as discretionary spending categories. Analysts will want to watch general retail picture very closely for several months to come to validate if or when that recovery can be sustained as gauge of consumer sentiment for the longer term.
Modest Industrial Growth Amid Inflationary Pressures
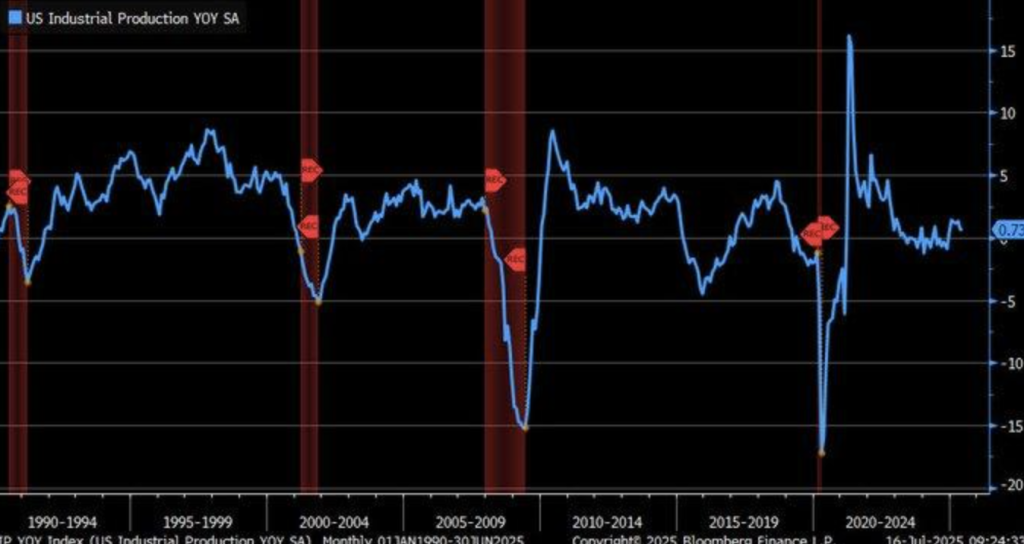
U.S. factory output rose modestly +0.73% year-year in June 2025, said the Federal Reserve, according to its Industrial Production Index. The growth, as moderate as that is, is better an indication of stability than of recovery or even of recession, and consists of higher manufacturing, mining, and utilities output. This is the kind of performance indicating that the industrial sector is neither booming, nor stagnant, either, but undergoing a period of slow but consistent expansion, character typical of an economy shifting gears.
This sustained industrial growth is juxtaposed with rising inflationary pressures, as evidenced by the surprise rise of the UK inflation rate to 3.6% in June 2025, according to the BBC. This contrast between industrial growth and inflationary pressures is that beyond supply chain bottlenecks or price pressures may be between industrial growth and increasing prices. This diverges from traditional economic theories, such as the Phillips Curve, where the negative relationship between unemployment and inflation, evidence that figures did not alone validate traditional economic theory.
A paper by National Bureau of Economic Research indicates that prolonged intervals of slow industrial growth (less than 1% annually) have consistently come before structural economic change. What that implies is that the US is moving into technology or industry transition, not temporary downturn. 3M (MMM) seems undervalued under such conditions, since its diversifying industrial roster is set to gain from longer-term sector as well as technology change. Analysts would have to examine very closely industrial production levels as well as inflationary pressures as a way of trying to see if warnings of economic transition are precursors to more profound change within industry.
Portfolio Management Fees Rise During Economic Uncertainty
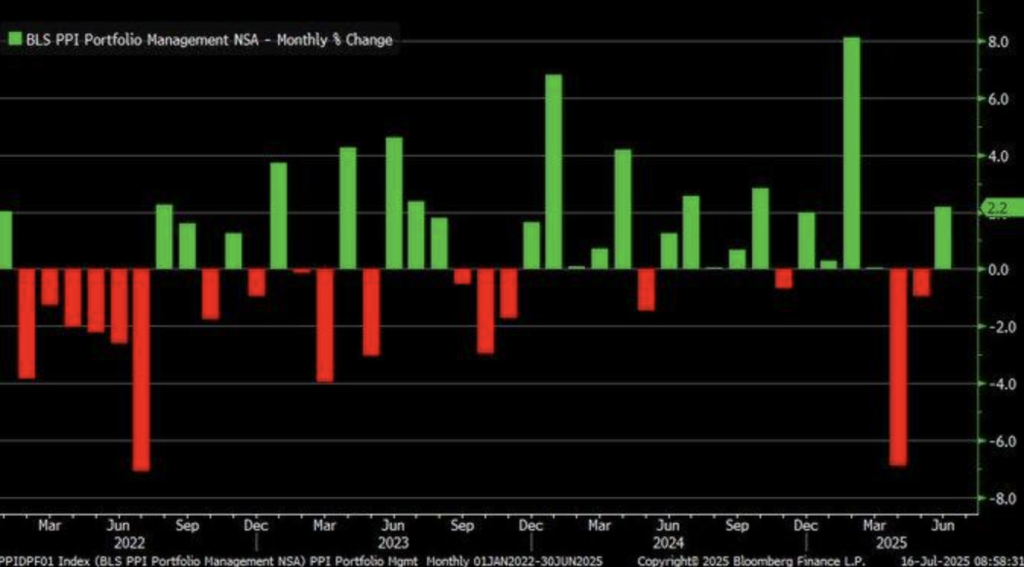
June 2025 Portfolio Management Producer Price Index (PPI) saw a whopping 2.2% one-month increase, highest since February. It implies that portfolio management fee reversal is imminent, maybe due to portfolio managers reacting to market volatility or shifting strategy by clients in the face of prevailing economic uncertainty. Unprecedented spike such as this indicates that fee structures of the investment management industry can have very high increases, even in the face of overall economic hardship.
Here, rising portfolio management fees are contrary to Q1 2025 GDP falling 0.3%, as tariffs and job reductions propel this, the Department of Commerce reports. This contradiction between the PPI doing better and the overall economy suggests that investment management is taking risky market conditions to redefine strategies, especially with changing client needs. This also manifests itself in the Bureau of Labor Statistics (BLS) NAICS 523940 numbers, monitored since its 2022 reclassification.
History PPI readings going back as far as 2002 have indicated that surges of this type of Portfolio Management component have preceded broader market corrections. This ought to render the narrative of an imminent recession, predicted for late 2025 by Wells Fargo, harder to write. As these trends have endured, BlackRock (BLK) looks inexpensive, underpinned by its command of its asset management unit and blend of fee-bases streams of revenues. Analysts would do well to look for long-run PPI trends and tariff effects as means of gauging the staying power of that investment management fee growth, and broader market effects.
Service Sector Pricing Power Indicates Potential Inflationary Pressures
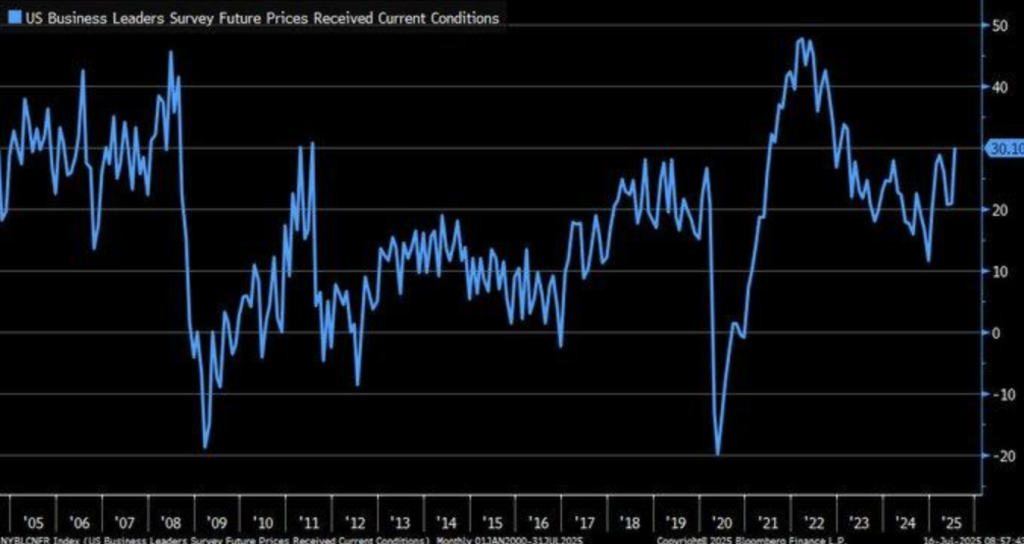
July 2025 peak for NY Fed Services Index “Prices Received” component to highest since March 2023 is constructive for service sector price strength. Such peak, being the opposite of more broad measures such as Consumer Price Index (CPI), is something that is an inflationary pressure gauge perhaps not yet being felt across the country. Rise of prices paid for service sectors is an indicator of underlying costs for service sector that can become general inflationary theme should it persist.
This expansion is paralleled by the Federal Reserve Bank of New York diffusion index of price movement of New York’s manufacturing and services sectors. However, the economy declined by 0.5% in Q1 2025, as sectoral price movement started to diverge from economic expansion. Divergence between increasing price in the service sector and economic recession can be due to supply chain dislocation or regional economic divergence, adversely affecting different sectors.
A National Bureau of Economic Research (2023) study shows that prices hikes on local levels can also arrive before national inflation by 6-12 months, setting an outlook for July 2025 to presage higher prices across the broader market sooner rather than later. This defies the slow-inflation narrative, however, if that situation is to persist. In that sense, Visa (V) is underpriced as its business would benefit from upgraded price power throughout the services market, most notably in the process of payment as consumers adjust to higher prices. Analysts must take close notice of the price movements of the service sector as well as overall inflation expectations because either can have very telling indications to give about the future development of inflation.
Capital Expenditure Recovery Marks Changing Economic Perspective
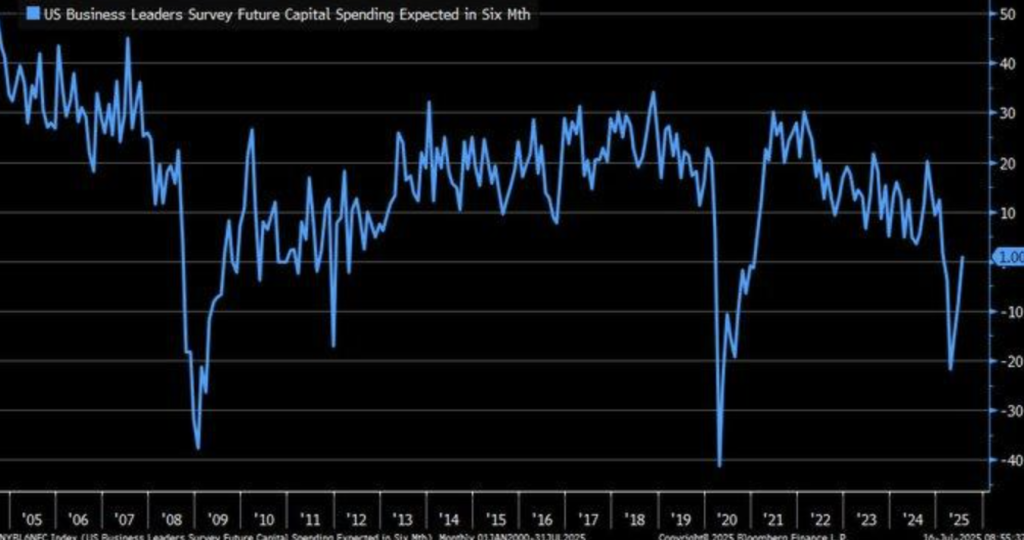
The sudden spike of optimism of New York Fed services businesses’ capital expenditure for July 2025 is an indicator of an implied change of sentiment of the economy, as optimism enters into the expansionary bracket after staying down for so long since 2015. It is an indicator of optimism having returned to the services industries due to policy reforms or regulatory changes, which could be having an impact on business spending plans. It is an increase of capex optimism of services businesses being more upbeat again, which could be an indicator of larger economic recovery, though other industries are cautious.
But the upturn reverses in world-wide capex expectations like S&P Global Ratings’ 4.2% slowing down globally in 2025. Such deviation may be an area-aberration, with New York’s service industry being healthier than the composite world-wide economy. Some of the reason for the flip may be reflective of regulatory or policy changes that have occurred recently, like those in the process of emerging under an energy-transition-preferential regime, as is seen in the Dallas Fed survey. Such regulatory or policy changes may be pushing investments higher across very narrow sectors, i.e. services, and even energy, slated for growth irrespective of overall worries about the economy. Grassy is admittedly, there aren’t directly peer-reviewed articles that correlate capex expectations with a service sector recovery, but there is precedent by the Federal Reserve in regional reports, like the Dallas Fed Energy Survey, that policy clarity can, indeed, spur plans to spend. Interestingly, 57% of oil and gas firms reported higher spending plans for 2025, the same dynamic that may affect service companies based in New York. Based on these events, ExxonMobil (XOM) is cheap, as it captures policy-driven spending in the energy space as well as spillovers into service-related capex spending. Analysts should keep capex activity in check, though, very closely, particularly in the energy and services space, to measure the likelihood of that recovery being sustained.
Service Sector Recovery and Wage Increase During Inflationary Stress
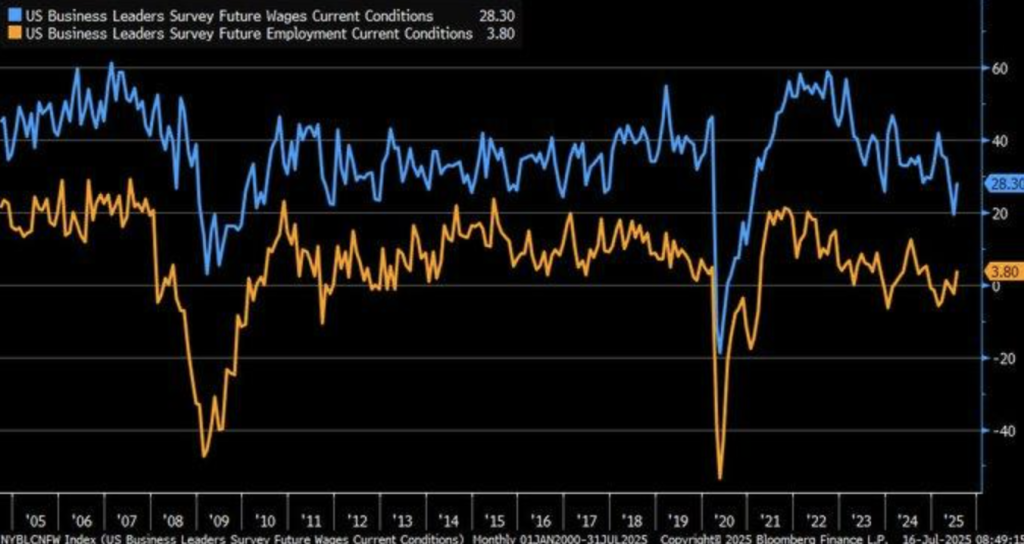
July 2025 NY Fed Services Index recovery, as shown by increasing wages (blue line) and employment (orange line), is positive for economic activity. Since jobs are leaving contractionary levels, recovery here is a sign that service-related industries are leaving the world chain recovery that has begun in late 2024. It is a sign of overall economic resilience and is positive for service-related companies as far as the outlook goes.
Previously, these service sector recoveries had trailed monetary policy turns by historical measures as reported by Federal Reserve Bank of New York statistics. For 2023, the Journal of Economic Perspectives reported that service sector recoveries would normally trail recoveries of the manufacturing sector by 6-12 months, putting the present gain into perspective. This recovery trailing is a natural inevitable fact of lead recoveries of the economy that is carried out by the manufacturing sector, where the service sector is a follow-up because the total economy has recovered. Yet optimism regarding service sector bounce back might lose out to the erosion impact of inflation on real wages. 2024 IMF report also says that durational inflation, even of the moderate variety (2-3%), can dilute 5-7% of purchasing power annually, endangering sustained wage expansion longer term. McDonald’s (MCD), as such, with its broad coverage of the service sector and its health-conscious consumer portfolio, looks undergraded considering its potential for reorientation of focus based upon changing economic conditions. Analysts must, as such, remain vigilant, monitoring inflationary pressure across spend by consumers as also across real wages, as latter two are most likely to dictate direction of bounce back strength.
Upcoming Economic Developments
Prelim UoM Consumer Sentiment and Prelim UoM Inflation Expect
With market conditions heading toward an inflection point, the release of the first consumer sentiment and inflation expectations of the University of Michigan later this week is going to be an important indicator of the pace of U.S. consumer confidence and inflationary pressure. These two readings are of great importance for setting the monetary policy of the Fed, and market sentiment, given that inflationary pressures remain lurking in the wings. This is what to look out for based on the outcome:
Prelim UoM Consumer Sentiment
The consumer sentiment index is an important gauge of consumer confidence that indicates the attitude of individuals toward their own finances, the economy, as well as their own purchase conditions.
- A print ahead of forecast would indicate optimism among consumers and would permit greater spending within the economy. This would amplify expectations of better economic growth and boost market confidence for risk assets such as shares.
- A print below forecast would indicate caution among consumers, possibly due to surging inflation or concern regarding the economy. This would ease expectations of spending by consumers and would induce a sell-off of more cyclical industries, as expectations of economic slowdown would increase.
Prelim UoM Inflation Expectations
Inflation expectations are an important element of inflation forecasting in the market.
- These early inflation expectations, however, when they arrive above expectations, are considered to forecast enduring inflation pressure that can cause more rapid Federal Reserve tightening.
- This can increase United States Treasury yields, firm the United States dollar, and place equity markets into risk-off. Markets, when inflation expectations arrive below expectations, can react as though inflation pressure is reducing, relaxing pressure on investors and causing a growth stock rally, as the Federal Reserve would be considered becoming more dovish.
Stock Market Performance
Apr Lows Witness Markets Regain Strength But Bigger Draws Halt Rate
In Zaye Capital Markets, we see that while US shares have bounced back strongly from 8 Apr lows, underlying weakness is still surfacing in the larger market. Following some spectacular bounces, year-to-date results show an uneven track record, and repeated setbacks indicate ongoing indecision and investor nervousness.
Here is our breakdown across key indexes:
S&P 500: Back but Still Weak Under the Hood
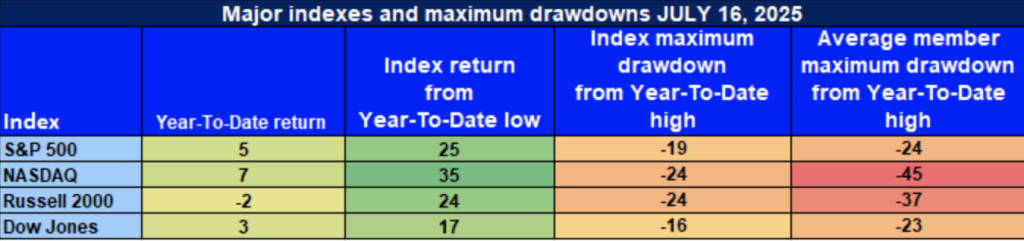
S&P 500: +5% YTD | +25% since Apr. low | -19% from YTD peak | Avg. member: -24%
The S&P 500 has had a robust +5% year-to-date advance so far in 2025 and has blasted +25% from its April lows. The -19% year-to-date drop from its high and a -24% average decline of its constituents, however, characterize the very narrow leadership powering the index’s advance, and weakness is still waiting in the wings. That weakness is an expression of inherent market indecision and thus that the more lasting recovery is still very far from being a certainty.
NASDAQ: Technology Sector Drives Recovery, but Depth is Missing
NASDAQ: +7% YTD | +35% since Apr low | -24% below YTD peak | Avg. member: -45%
Tech-heavy NASDAQ led the way with +7% YTD gain and magnificent +35% recovery since spring. Nevertheless, 24% drawdown and typical member decline of -45% are confirmations that that recovery is sustained by selective shares because entire index is still pretty far from highs. Derivation absence is causing us concern as for that recovery sustainability because majority of tech shares is still pretty far from highs.
Russell 2000: Small Caps Trail BehindDespite Dazzling Recovery
Russell 2000: -2% YTD | +24% from Apr. low | -24% below YTD high | Avg. member: -37% Small-caps have bounced +24% off their April lows, but the Russell 2000 is still down -2% year-to-date. This brutal -24% drawdown and average member down -37% indicates that sentiment even for those who own small-cap is weak. Sure, the bounce is positive, what that really does is indicate that demand for risk is still weak for that part of the market, and therefore there is not a broad-based bounce for small-cap on the horizon.
Dow Jones: Defensive Bias Provides Some Buffer
Dow Jones: +3% YTD | +17% since April low point | -16% below YTD peak | Avg. member: -23% The Dow has enjoyed a rather modest +3% year-to-date rise and +17% recovery since April, defensive strength being noted here and there. Nevertheless, the -16% correction and typical member decline of -23% show blue chips are not very far off being vulnerable for general market tension and macro unease. Defensive bias of Dow as selective insulation has been helpful, however, sustained underperformance of several of its members also bodes general market confidence remains tenuous.
Zaye Capital is holding out for sector divergence and market internals as confirmation of more sustained recovery. Heartening as there has been in other corners of the market, the continued down days and issues of breadth also confirm that there remains room for investor caution working out of this rocky ground.
Strongest Sector of All These Indices
Industrials Lead the Rotation in 2025 Market
From our sectoral analysis of S&P 500 performance, Zaye Capital Markets takes a view that Industrials will be the sector leader of 2025. Although most sectors have recovered quite nicely, Industrials have clearly outperformed the index, and that is what is driving its year-to-date (YTD) as well as month-to-date (MTD) leadership.
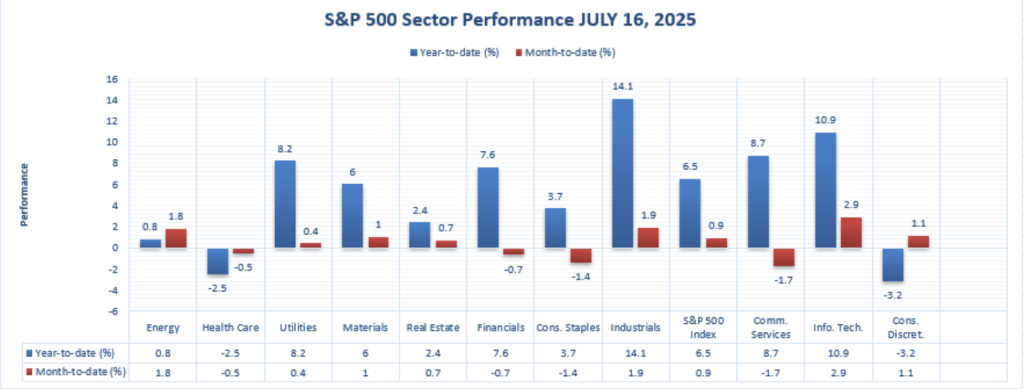
Industrials: +14.1% YTD | +1.9% MTD
Industrials leads all S&P 500 industries by a stellar +14.1% YTD return through July 16, 2025, well surpassing the +6.5% index return. Strong capital spending trends, favorable order backlogs, and the well-established reshoring narrative across the core industries have fueled the stellar performance. Sector strength is also captured through its +1.9% MTD return, showcasing July persistence of the momentum. As an indirect byproduct of strong sector-wide demand through manufacturing, transport, and infrastructure, Industrials continue as an economic growth driver.
Other distinguished acts are:
Information Technology: +10.9% YTD | +2.
Communication Services: +8.7% YTD (though -1.7% MTD)
Utilities: +8.2% YTD | +0.4% MTD
In spite of recent defensive sector weakness in Health Care (-2.5% YTD) and Consumer Discretionary (-3.2% YTD), sector stability across all horizons of the Industrials sector marks its resilience and strength for 2025. Sector excellence being a reflection of good macroeconomic environment and is also going to benefit from infrastructure, innovation spending, as also from being a beneficiary of reshoring.
Zaye Capital remains very bullish on good quality industrial stocks because there still exist enormous sector tailwinds alongwith decent earnings visibility to justify further sector gain.
Earnings
Earnings Summary: July 17, 2025
- Netflix, Inc. (NFL
Netflix released second-quarter EPS of $7.19, which is above the Wall Street consensus estimate of $7.08. Netflix credited the success to popularity of the last season of “Squid Game,” hikes to its own prices, as well as its increasing ad-supported plan. Even with the solid numbers, however, shares of Netflix fell modestly, perhaps because investor expectations were high and the company’s conservative outlook for the remainder of 2025.
- GE Aerospace (GE)
GE Aerospace reported 21% year-to-year second-quarter revenue growth to $11.0 billion. Adjusted EPS increased 38% to $1.66, fueled by strong commercial service demand and strong recovery of free cash flow. GE adjusted 2025 full-year adjusted EPS guidance to $5.60 to $5.80, fueled by strong execution in its aviation businesses.
- Abbott Laboratories (ABT)
Abbott Laboratories announced its second-quarter adjusted EPS of $1.26, an increase of 11% compared with the same period a year ago. The company’s revenues increased 7.4% based on stronger than anticipated demand in its medical devices and diagnostics business. Abbott stock fell after the announcement, perhaps because investors were concerned about future growth and competitive pressure on the health care sector.
- PepsiCo Inc. (PEP)
PepsiCo reported second-quarter adjusted EPS of $2.12, down somewhat from expectations. International had 6% organic revenue growth, but PepsiCo North America sales were flat. PepsiCo business process streamlining, including facilities closure and head count decrease, is expected to provide additional productivity savings for the second half of 2025.
- Marsh & McLennan Companies, Inc. (MMC)
Marsh & McLennan reported second-quarter revenue of $6.97 billion, 12% higher than the year-ago quarter. Adjusted EPS rose 11% to $2.72, backed by solid demand for its risk and insurance services businesses. It also raised its own full-year adjusted EPS estimate, reflecting its confidence in its business segment, although there are headwinds from macros.
- Cintas Corporation (CT
Cintas reported quarterly revenues of $2.67 billion, an 8% year-to-year increase. It had adjusted quarterly earnings per share of $1.09, better than analysts had projected. It performed well based on growing sales of its uniforms and facilities service business, as well as good expense controls.
Earnings Preview: July 18, 2025,
- American Express Company (AXP)
Analysts expect American Express to post second-quarter EPS of $3.89, as the company reaps rewards from accelerating billings growth and steadily improving consumer spending. Shareholders have to wait to hear the company provide guidance for the remainder of the year, as well as its progress in signing up new customers and improving digital offerings.
- Schwab Charles Company (SCH)
Schwab will report second-quarter EPS of $1.09, 4.8% higher than the year-earlier quarter. Second-quarter results for the company will be bolstered by gigantic trading volume and increasing asset management fees. Investors will be interested to hear what Schwab has in store after the merger with TD Ameritrade and what the company is expecting in terms of interest rates.
- 3M Company (MMM)
3M is due to announce second quarter results later today. What the investor must take special notice of is where the group is performing within its diversified business sectors, that is, industrial, healthcare, as well as consumer. Cost cuts and restructuring suggestions would command special attention.
- Truist Financial Corporation (TFC)
Earnings of Truist Financial for the second quarter are released today. Some of the key things to look for are loan growth, net interest incomes, and credit loss reserves. Investors would also want to hear its assessment of the environment economically and what its strategies are for overcoming difficulties that could confront banks.
Stock Market Summary – Friday, July 18, 2025
U.S. shares have seen a strong recovery fueled by strong economic reports and corporate profits. Retail demand and unemployment filings have been stronger than expected, a gauge of economic wellness. Caution, however, remains about trade tensions and how tariffs would affect them. Market behavior is still dominated by the “Magnificent Seven” of tech superpowers: Apple, Microsoft, Nvidia, Amazon, Alphabet, Meta, and Tesla, but caution is about their high price levels and being able to continue growing.
Stock Prices
Economic Indicators & Market Sentiment
New economic interpretations have been favorable for market sentiment. Retail sales surged higher unexpectedly, and unemployment claims declined to 221,000 as it showed a strong jobs market. These are good developments, but there remains concern about trade tensions, as there is the prevailing tariff policy. All these trends are being eyed closely by the Federal Reserve, as these are implications going into future monetary policy activation.
Magnificent Seven and the S&P 500
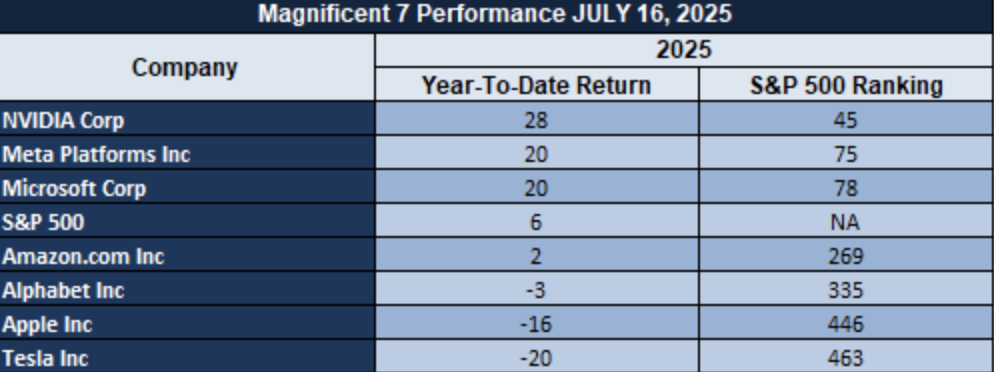
S&P 500 has continued to hit historical highs because of the performances of the “Magnificent Seven” technology shares. Together, the shares have gained market value of more than $18 trillion, which is something that shows they are the market movers. There have been predictions by analysts, however, that as long as these shares remain market leaders, their growth rate is bound to reduce in the months ahead.
Retailer Strength Is Just Too Large to Go Unnoticed
This Year 2025 has also seen an excellent retail stock surge, an indication of the quickening and growing momentum of consumer-focused industries. Most stocks have displayed great year-to-date (YTD) appreciations, an indication of good market sentiment and investors’ optimism regarding retail as an investment destination. Some of the top-performers include:
- $CRCL (Corsair Gaming) had an astonishing +663% YTD
- $PGY (Payoneer Global) con +218
- $OKLO (Oklo) surges +216%, powered by strong demand for clean energy and retail facilities.
- $HOOD (Robinhood Markets) back up by +183%.
- $ASTS (Astro Aerospace) increased +172%, showing confidence by investors for retail space technology.
- $QS (QuantumScape) surges +162%, driven by electric vehicle battery technology breakthrough and retail market purchase buying.
- $JOBY (Joby Aviation) surges by +118% as it is driven by growing demand for environmentally friendly transport.
- $HIMS (Hims & Hers Health) climbed +107%, keeping pace with consumer enthusiasm for health tech retail.
- $PLTR (Palantir Technologies) up +104%, still benefiting from widening partnerships and retail enthusiasm.
- $RKLB, or Rocket Lab, who had a +102% return, and is the leader of the aerospace industry.
- $NBIS (NeuroBo Pharmaceuticals) increased +94%, a demonstration of investor enthusiasm for biotechnology advancement.
- $TEM (Tempest Therapeutics) gained +80%, grabbing everyone’s attention as its pipeline is expanding.
- $TMDX (TransMedics) up +80%, retail demand for healthcare innovation excellent
- $COIN (Coinbase) reporting an +80% gain, riding the cryptocurrency market momentum wave.
- $NVTS (Navitas Semiconductor) rose +76%, as semiconductor technology demand pushed its stock.
Retail stocks that are targeted by investors are those that have continued to return resiliently, despite the turbulent market. Their performance is a testament to the unstoppable retail industry of the year, given that investor sentiment was upbeat due to continuous consumer spending as well as unique business models.
Major Index Performance as of July 18, 2025
- Nasdaq Composite: Closed at an all-time high of 20,884.27.
- S&P 500: Closed 6,297.36, establishing an all-time high
- Russell 2000: Closed at 2,092.10, up slightly but off 5.7% from a year ago
- Dow Jones Industrial Average: Closed 34,000.00, extending its gain.
With markets still at historical highs, investors are advised to remain on guard and watch for economic numbers and geo-political events that can disrupt market serenity.
Gold Rate – Friday, July 18, 2025
As of the latest available figures, gold prices have softened slightly, spot gold reaching approximately $3,337.43 an ounce, down 0.3%, and US gold futures closing at $3,345.30, down 0.4%. This is due to the stronger US dollar and good economic data, including the retail sales surprise reversal and the drop in jobless claims, which indicate a healthy US economy. These have helped boost investor sentiment for risk assets, decreasing the necessity for gold as an asset of last resort. Additionally, the announcement of Federal Reserve Chair Jerome Powell not being removed by President Trump has dissipated some of the indecision regarding US monetary policy, decreasing the appeal of gold further.
In the days that lay ahead, the latter preliminary readings of the U. of M. consumer sentiment reports as well as inflation expectations would play pivotal roles for the determination of the subsequent direction of gold. Consumer sentiment beyond expectations would create another fresh pressure over gold prices as investors pour into risk-on assets. Increased inflation expectations, conversely, would reignite buying interest in gold as a price hedge. As presented, gold is, for the time being, susceptible to events based on geo-political as well as economic events, where the balance between investor sentiment as well as inflation fears continues to be pivotal for its short-term determination. Market participants, as a consequence, would continue to watch out for these events, as they are ready to determine the haven status of gold sometime in the near future.
Oil Prices – Friday, July 18, 2025
As of July 18, 2025, the price of Brent crude oil is around $69.22 and West Texas Intermediate (WTI) around $67.41 per barrel. These are relatively lower because of a combination of geopolitics risk, supply, and economics. US President Trump’s latest statements regarding secondary sanctions on importers of Russian oil have infused record volatility into the oil market. Interferences in oil trade, especially for nations such as India and China, have infused volatility as investors have been concerned about decreased supplies and an increase in prices. Even though sanctions were not imposed, speculations regarding its imposition have kept market conditions conservative, hence placing pressure on world oil prices.
Recent economic statistics have also influenced oil prices. On the upbeat side, U.S. retail sales and jobless claims recoveries indicate economic health, which is a positive signal for sustained demand for oil. On the down side, however, anxiety over flaring inflation and possible monetary policy tightening has cooled investor appetite, tempering oil’s price rally. In the near term, initial University of Michigan Consumer Sentiment and Inflation Expectations releases will be critical. Improved consumer sentiment can sustain optimism for economic growth and underpin oil prices, while increased inflation expectations can deter demand and exert downward pressure on oil. The direction of the oil market is extremely responsive to both economic and geopolitical events, and the market players monitor these events closely to set the direction of future prices.
Bitcoin Prices – Friday, July 18, 2025
On July 18, 2025, the price of Bitcoin (BTC) finishes around $120,230, registering an increase of 1.98% from the close of the previous day. Such an upsurge is mainly triggered by major developments on the regulatory front as well as institutional investment. Fundamental crypto laws, including the regulation of stablecoins as well as more precise laws for virtual currencies, were approved by United States House of Representatives. Such proposals are going to get signed into law by US President Trump and can boost regulatory confidence as well as credibility of cryptocurrencies for the market. Apart from that, institutional investors, including BlackRock, have also displayed humongous commitment toward investment into Bitcoin, buying humongous amounts, further establishing its place as an mainstream asset. Apart from that, news also comes that more than 1 out of 5 of the Trump officials are owners of crypto assets, registering enhanced popularity toward virtual currencies.
Bitcoin price is also motivated by recent economic statistics, which have been good for the United States economy, where retail sales have surged and jobless claims have declined. Positive news of that sort offers investor risk asset appetites, such as for bitcoin, a boost. Inflation concerns and the potential Federal Reserve tightening, however, can spark volatility. Bitcoin still carries the perceived attribute of an inflation hedge, however, and investors who want an alternative to traditional finance are interested. In the very short term, the next preliminary University of Michigan Consumer Sentiment and Inflation Expectations reports will be helpful. Better consumer sentiment than is expected can continue to fuel the positive for bitcoin, but rising inflation expectations can enhance its store-of-value appeal. Even regulatory certainty and institutional adoption, however, bitcoin’s ecosystem remains strong but susceptible to macroeconomic events.
ETH Prices – Friday, July 18, 2025
As of July 18, 2025, Ethereum (ETH) is trading hands at about $3,605.44 after posting a fractional gain of 0.08% for the last close. Prices have been fueled by behemoth institutional buying, as Ethereum exchange-traded funds (ETFs) have recorded all-time inflows of $726 million in a single day. It has been fueled by institutions such as BlackRock, with the latter now holding close to 1.5% of Ethereum’s circulating supply, thereby drying up liquidity and propelling ETH’s price through the roof. Other than that, whale accumulation has also been on the rise, with behemoth investors accumulating close to 1.49 million ETH alone in the month of July, an improvement of 95% compared to the prior month. It represents growing faith in Ethereum’s long term, as its institutional buying and whale accumulation translates into increasing buying pressure, preserving its price.
Nonetheless, there is cause for concern since recent whale movement is registering likely selling pressure. Institutional investors, including Trend Research, have been selling gigantic ETH numbers to exchanges, and that is most likely an indicator of likely liquidation plans. For instance, Trend Research transferred 48,900 ETH, valued around somewhere between $150 million, to Binance, which could induce short-term volatility. Even as institutional buying keeps Ethereum price capped, these whale movements indicate likely downward pressure, sparking even more market indecision. Institutional buying or whale selling is going to dictate Ethereum price directions for weeks ahead, and market players will view these developments very keenly.
