Where Are Markets Today?
Markets are opening with a cautious tilt higher this Thursday as investors digest a fresh round of earnings and renewed optimism over international trade deals. S&P 500 futures are up 0.1%, Nasdaq 100 futures are leading with a 0.4% gain, while Dow Jones futures slipped by 0.2%—weighed down by post-earnings weakness in IBM. Across the Atlantic, European markets are positioned for a stronger open amid growing confidence that a U.S.–EU trade agreement may be imminent. The broad market tone reflects tempered enthusiasm: equity momentum remains constructive, but selective disappointment in corporate results and geopolitical uncertainty continue to cap exuberance.
Two key drivers are shaping this mixed yet stabilising futures landscape. First, Alphabet’s earnings outperformed, with a strong rebound in cloud services helping lift sentiment toward megacap tech and fueling the Nasdaq’s pre-market edge. However, Tesla’s 4% decline—sparked by its second straight drop in auto revenue—has pressured Dow futures. IBM’s 5% post-earnings slide due to underwhelming software revenue also contributed to the Dow’s underperformance. These results showcase the delicate balance markets must navigate between upside from AI-linked growth and broader execution risk across sectors.
The second major catalyst is geopolitical. Reports confirming tariff relief between the U.S. and Japan, alongside positive developments in U.S.–EU negotiations, are lifting European sentiment. Markets are increasingly pricing in a scenario where major trading partners agree to loosen tariffs, particularly on autos and industrial components. Trump’s recent comments reaffirming that he would “give up tariff points” for market access and celebrating Japan’s military equipment purchase have contributed to this growing optimism. Such trade relief could meaningfully improve corporate margins, especially in export-reliant sectors across both regions.
At Zaye Capital Markets, we view the futures movement as an intersection of relief and recalibration. On one hand, the Magnificent Seven continue to support headline indices, especially the Nasdaq, while solidifying their leadership through AI and cloud tailwinds. On the other hand, investors are cautiously watching today’s flash PMIs, ECB press conference, and unemployment claims for validation of the economic rebound narrative. With record closes now on the books, the next leg of market strength depends on earnings resilience, data support, and credible follow-through on tariff diplomacy.
Important Index Performance up to July 24, 2025
- Nasdaq Composite: Up ~0.45%, led by optimism in semiconductor and AI stocks.
- S&P 500: + ~0.15%, leaders of gains being clouds and artificial intelligence space.
- Dow Jones Industrial Average: Off ~0.2%, dragged down by IBM’s decline in earnings despite industrial health.
- Russell 2000: Higher ~0.3%, with risk appetites coming back into small-cap stocks cautiously.
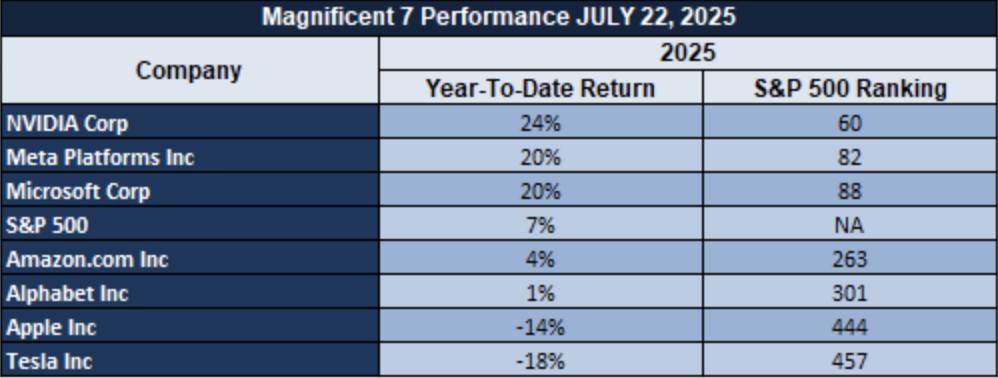
The Magnificent Seven & S&P 500 Dynamics
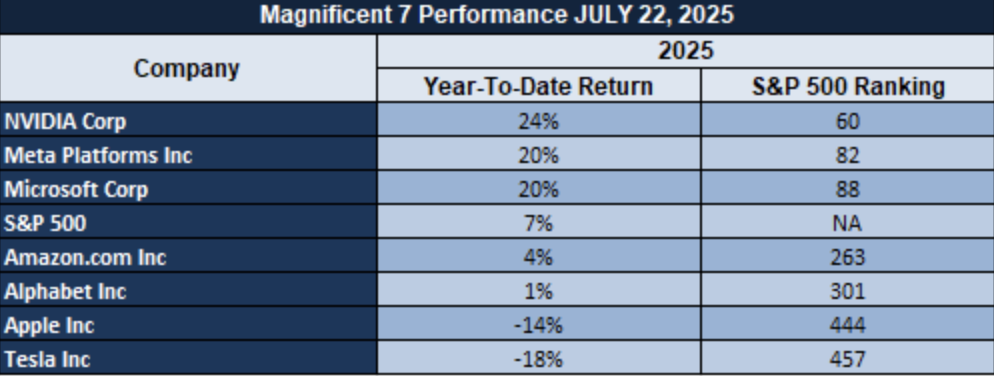
S&P 500 increased modestly with large gains coming from ServiceNow and large gains from Alphabet. The latter’s cloud business increased year-over-year 32% with enterprise demand being “absolutely on fire,” solidifying its leadership in AI infrastructure. But even megacap territory is susceptible to frenzied trading with some names gaining.
Tesla (TSLA) shares are weak after a Q2 EPS letdown. While long-term AI positioning continues to be robust, short-term delivery and margin risk are tested for investor morale. Meanwhile, Microsoft, Meta, Nvidia, and Amazon trade laterally with flat momentum that mirrors valuation and growth concentration issues.
Drivers Behind the Market Move
US/EU markets are being driven forward by a combination of three strong drivers: trade negotiations upturns, bold rhetoric from Trump on a switch in his monetary policy stance, and a week of key economics data flow. Each is affecting positioning and sentiments differently.
1. Trade Agreement Momentum
Optimism was triggered by good news from U.S. trade negotiations, following the agreement with Japan to resolve auto tariffs at 15%. Negotiations have now advanced with Europe, following that agreement. Pan-European futures are up in anticipation of reduced trade aggression boosting export industry and European investor sentiment.
2. Trump’s Rate-Cut Pressure
Trump’s latest public denunciation of the Federal Reserve as part of his broader series of remarks that also included demands for steep rate cuts and tariffs flexibly for market-opening has created uncertainty over monetary policy in the future. It’s created volatility for rate-sensitive parts of the market that rewarded equities holdings while placing a strain on bond yields as investors weigh possible action from the Fed.
3. Economic Data for Today
We’re all waiting for large macro data today: flash PMIs for Germany, France, Eurozone, UK and U.S., jobless claims and U.S. new home sales. The data will be critical in informing central bank policy—particularly ECB, who is set to delay rates amid uncertainty around trade—and has significant ramifications for both equity and fixed-income markets. A soft print will make dovish leanings more solid and bolster equities further, while a shock up print will cause markets to turn defensive. We seek trade deal breakthroughs today, Trump’s rate rhetoric, and flash macro data as the key drivers. Cumulatively they account for the futures direction rationale and will be central to whether spot rallies will prove enduring past the headline momentum–or they unravel with policy uncertainty and data risk.
Digesting Economic Data
TRUMP Tweets and Their Implications
President Trump’s recent string of public comments—ranging from panning the economy, trade negotiations, and executive power—have again thrown policy and markets into confusion. From panning calls for rate reductions to publicly arguing with Fed Chairman Powell, Trump’s comments betray a deliberate effort to make monetary policy itself the principal obstacle to acceleration. In insinuating that the American rate must be “three points less than they are,” Trump addresses the level of his exasperation further justified by his personal attack that Powell “doesn’t get it.” Both undermine independent action by the Fed as much as they escalate investor anticipation of future interventionist forays into monetary policy by politics that can corrode confidence in long-run inflation control if that meddling gets popular.
His deal-making announcements mark a more transactional, high-risk style of international diplomacy. Trump again reassured that he’ll “give up tariff points” if big nations ease up their markets for American export, and victoriously welcomed Japan agreeing to buy billions of American military gear. His rationale for reduction of Japanese tariffs—to “open up access,” as he put it—is a return to deal-making traditions for extracting bilateral wins as much as possible without concern for broader multilateral fallout. In doing so, such traditions may reap short-term wins in defence industries and export industries but kindle long-term potential for retaliatory measures, policy whiplash, and global supply chain disruption. Domestically, Trump’s renewed emphasis on AI regulation and his reported issuance of three Executive Orders in the coming AI Summit heralds a taste for steering the technological frontier. Trump’s AI policy to ease regulations and open up exports can bring in capital investment into semiconductor, cloud, and software ecosystems. This deregulation-first agenda, however, also sets the stage for debate about ethical concerns, data sovereignty, and national security that markets will now appropriately consider if legislative guidelines remain weak or patchy.
Instititutionally speaking, Trump’s lawyering move is a wild card. The Supreme Court decision that cleared him to fire Consumer Product Safety Commissioners, and the slothful executive order on ending birthright citizenship, mark expressions of ongoing executive profligacy vs. constitutional brakes. While these moves aren’t necessarily market-movers in themselves, they infect regulatory assumptions within consumer and civil policy areas, and potentially dampen sentiment within housing, healthcare, and consumer discretionary equities. From our point of view here at Zaye Capital Markets, such headlines assume status as medium-term risk repricers with tendrils spreading into interest-rate-vulnerable assets, policy-centric industries, and American institutional governance credibility in general.
Housing Stall Persists Despite Inventory Uptick
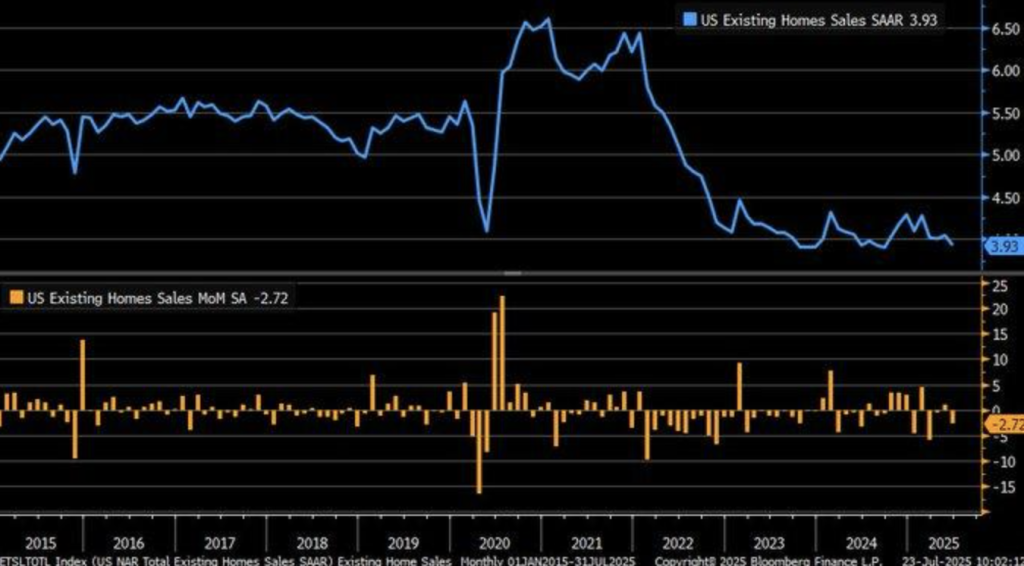
We see sharp US housing-market slowdown, June existing-home sales dropping 2.7% from the previous month on a year-earlier seasonally adjusted basis to 3.93 million units. The sharp drop, much steeper even than the previous-month 0.7% predicted drop, indicates still more discouragement from record mortgage rates and prices. Although inventory was 16% above the previous year at 1.53 million units, the market is still in stall as home owners at sub-3% mortgage rates discourage listings in the widest transaction-volume slowdown on record.
While the median sale price was 2% higher at a record $435,300 in the Month of June, the former more reflects supply constraints than normal demand. Gains in affluence from prior appreciation in dwelling homes again most negatively bias affordability towards the median-income buyer with price stress most common in sluggish suburban areas. The data verifies structural imbalance with the better-off home-owners dug in and prospective buyers on the sidelines buffeted by rate-sensitive lending and flat incomes.
We consider Lennar Corp. (LEN) undervalued in this situation. Although the headwinds in the short term still persist on the horizon, land inventory and scalability in the build-to-rent and starter home temper the stock. Builders’ incentives, mortgage buy-downs, and area price dislocations should be watched by analysts as the lead indicators toward the pickup in demand. Special attention should also attend the Fed commentary in the area of cuts in rates and timing thereof since the largest catalyst in unscrewing buyer-seller sentiment is there.
Tariff Escalation Signals Shift In Trade Negotiation Strategy
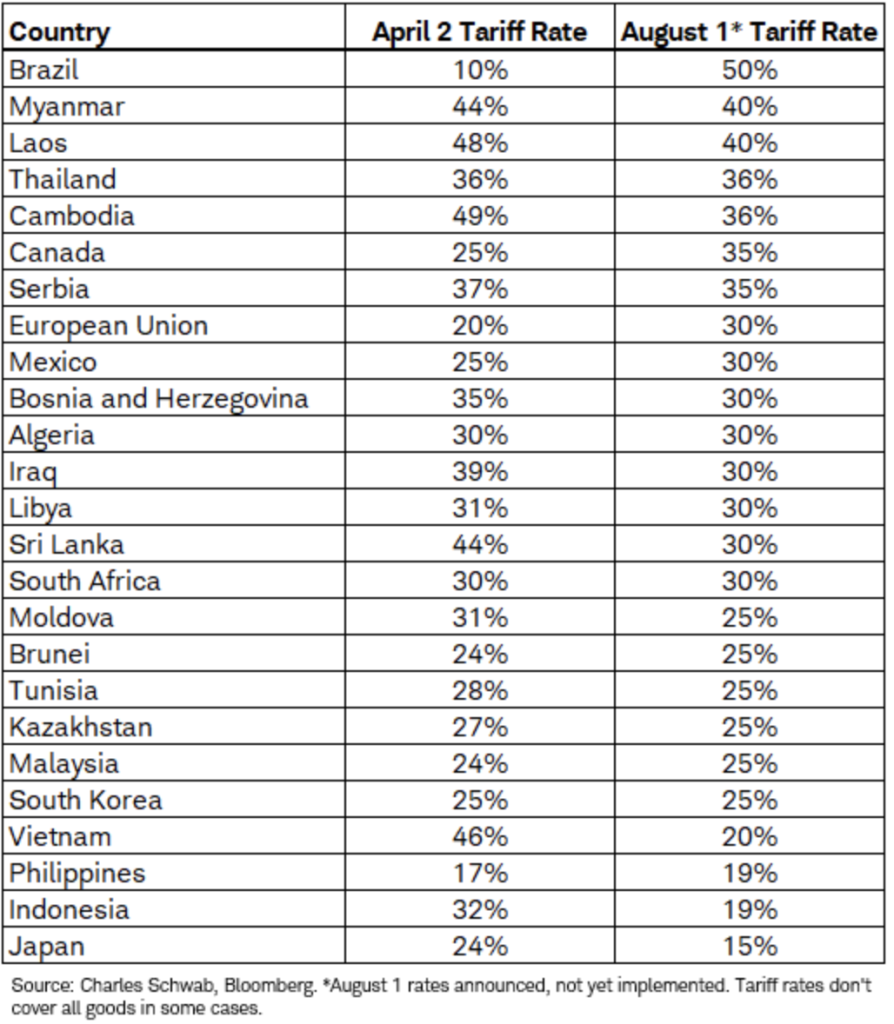
We notice a clear increase in U.S. trade policy with the increase in tariffs in 18 nations headed by Japan where the duties on incoming shipments will increase from 10% to 15% from August 1, 2025. The bottom-line indicates a strategic re-orientation by the government of the United States which appears to eliminate the tariffs as a leverage tool in the receipt of zero-duty status on American shipments. With the $7.2 billion agricultural risk exposure by Japan on the agenda, the pressure tactic will generate a bargaining tool but will equally consolidate unpredictability on the global supply chains.
Reversal in the policy refers to the execution in the re-commencement in Chineseexportation in the rare earths involving the wider transactional strategy more targeted at the short-run leverage in the long-distance trade certainty cost. Postponed execution and deliverance via the social media as the main disclosure vehicle intensify on the US and overseas players’ complexity. Such complexity may deter the plan on the investment where the most hurt players are the players in the raw material importing business houses and agro-export business houses.
While in turbulence, Deere & Co. (DE) appears undervalued. While the farm equipment business segment has near-risk in exporting related to tariffs, the longer-term opportunity lies in the Company diversification globally in the presence of risingautomation technology. Tariff timeline progressions, most sensitive partner retaliations, and transportation statistics should be watched by analysts in making the determination whether international trade flow will begin rerouting. A peek into soybean and equipment exporting volume into Asia potentially can provide a leading indicator in the success or the failure in the policy.
Federal Reserve Dissent Resurfaces, Hinting At Policy Divide
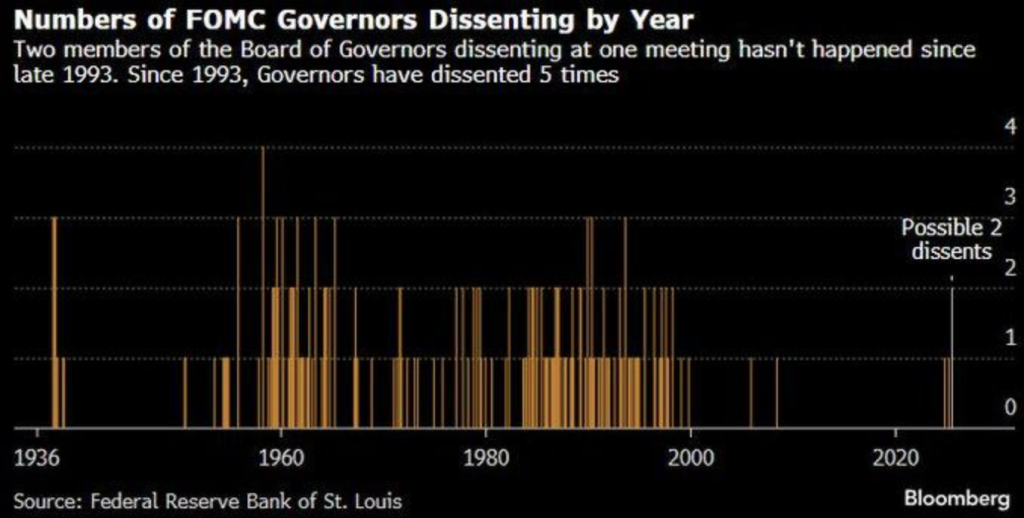
We observe keenly the unprecedented increase in dissents by Federal Reserve Board governors, the previous occasion was in the final week in over thirty years ago in the month of December 1993. From 1957 until 2013, the record indicates only 6% of the cumulative FOMC votes had dissents within them, therefore the current description is even more significant. With two governors reportedly voting against the majority before the next July 2025 meeting by the FOMC, the word is out—consensus in is fracturing in the face of rising macroeconomic insecurity.
This rising divergence will most likely be sparked by the shifting inflation-growth mix and external catalysts in the form of surging tariffs and updated GDP projections. The classic Fed model in familiar messaging may be challenged by some governors in calling for restraint and potentially implying monetary tightenings despite looser broad conditions. A central bank strategic stance reversal may materialize with more volatile bets gathering steam through the lens on the path for rates and inflation guidance.
We think Citigroup (C) is-cheap on this account. Greater monetary policy volatility tends to favor globally diversified banks with superior risk management and netinterest income growth exposure. Investors will focus on measuring dissent trends within the FOMC minutes, dot-plot shifts, and spot inflation surprises in real-time. Loss of consensus has the potential to foster opportunities within the most rate-sensitive spaces in the worst-case extreme the marketplace comes to price in the policy bifurcation.
Capex Outlook Dimmed As Manufacturing Sentiment Weakens
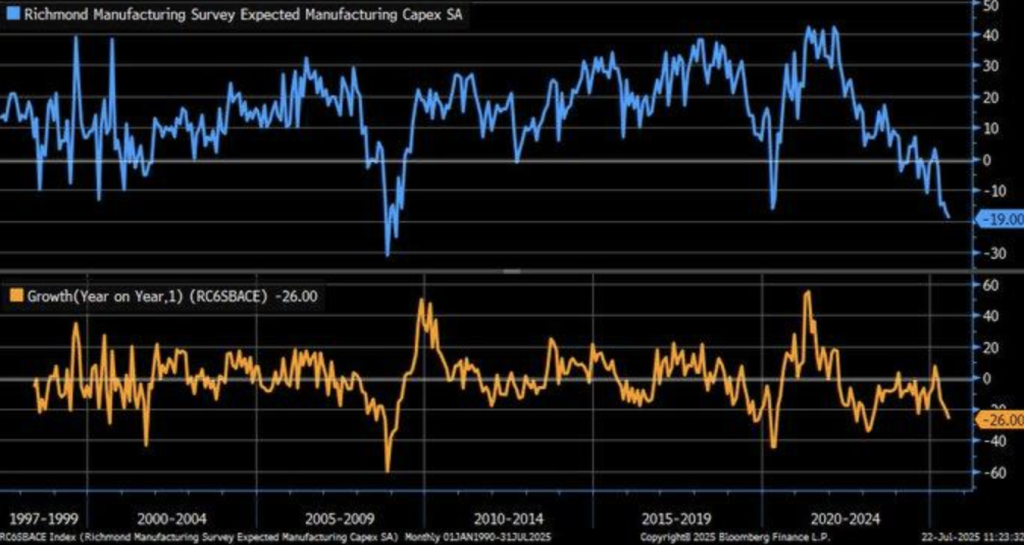
We see the sharp fall in the six-month capex outlook in the manufacturing industry as it was symbolised by the Richmond Fed Manufacturing Index in July 2025. The index registers a new cycle low in capex futures in reverse from earlier stories o industrial renaissance. The reverse is opposite from earlier triumphalist accounts oiled by regimes o protection on tariffs and deregulatory policy measures. More significantly is the reality that the backlog received orders index fell to -30, implying acute supply chain bottlenecks which derailed the materialisation in capital-intensive industrial development.
Labours pressures are accelerating the soft cycle. Future employment index decreased by -10 from -4 levels, implying manufacturers are getting more cautious in hiring more labour. That equalled earlier cautions on Manufacturing labour costs up 3.8% year-on-year vs flat participation. Those pressures raise red flags on medium-term output and gains in productivity where conditions are dependent on steady inputs and long-lead cycle spending.
Against the unpredictable world backdrop, Emerson Electric Co. (EMR) appears undervalued. Exposures to process optimization and automation position it well for capex surges when sentiment recovers. Order book trends and employment sub-indices in regional Feds and lead indicators from industrial suppliers’ suppliers should be kept in view by analysts in addition. A permanent capex spending drag will increase the differential between intention and execution on the policy side in the space and provide value rotation opportunities in quality industrials.
Regional New Orders Rise, But Price Pressures Temper Optimism
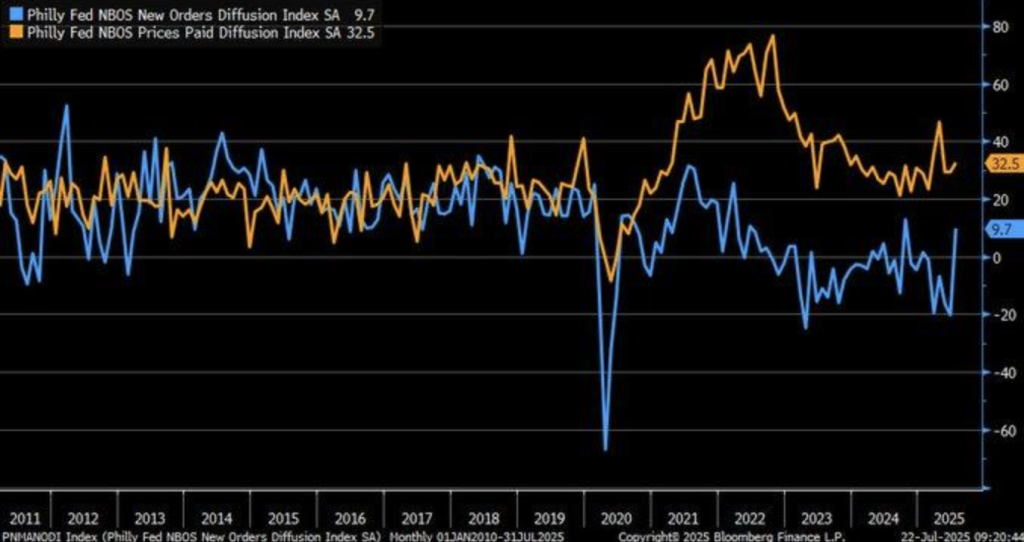
We see a 20-point flip in the new orders gauge in the Philly Fed Services Index back into -5.1 in July 2025. Still in the red, the increase ends a three-month losing streak and potentially foreshadows first signs of stabilisation in the Mid-Atlantic industrial corridor in demand. At times in the past, such shifts in momentum have been harbingers of wider industrial pick-ups; though the strength in contractionary indicators makes the durability in the current reversal questionable nonetheless.
Meanwhile, the increase in the prices paid index suggests a recovery in inflation of input prices. The new development corresponds to earlier Federal Reserve studies connecting sharp new order surges with the ensuing six-month gain in the CPI by 0.5% to 1% on average. With companies bearing increasing production costs, the potential for pass-through may increase and in the process fortify inflationary stickiness at a time when the set of policy instruments is limited and consumer margins are thin anyway.
General Mills (GIS) in this aspect comes out as undervalued. From price perspective and defense-oriented industry exposure, the constituent mitigates spiky cost dynamics in the presence of surging price inflation risks. Analysts should watch regional service indicators for wider convergence desired, deconstruct producer price questionnaire for clues towards margin squeeze, and watch out for stock bulks potentially breaking cost-control measures in the presence of surging cost dynamics by industry. A reversal back into bullish zone too soon may underweight stickiness in inflation.
Foreign ownership of u.s. Equities climbs, signaling strategic confidence
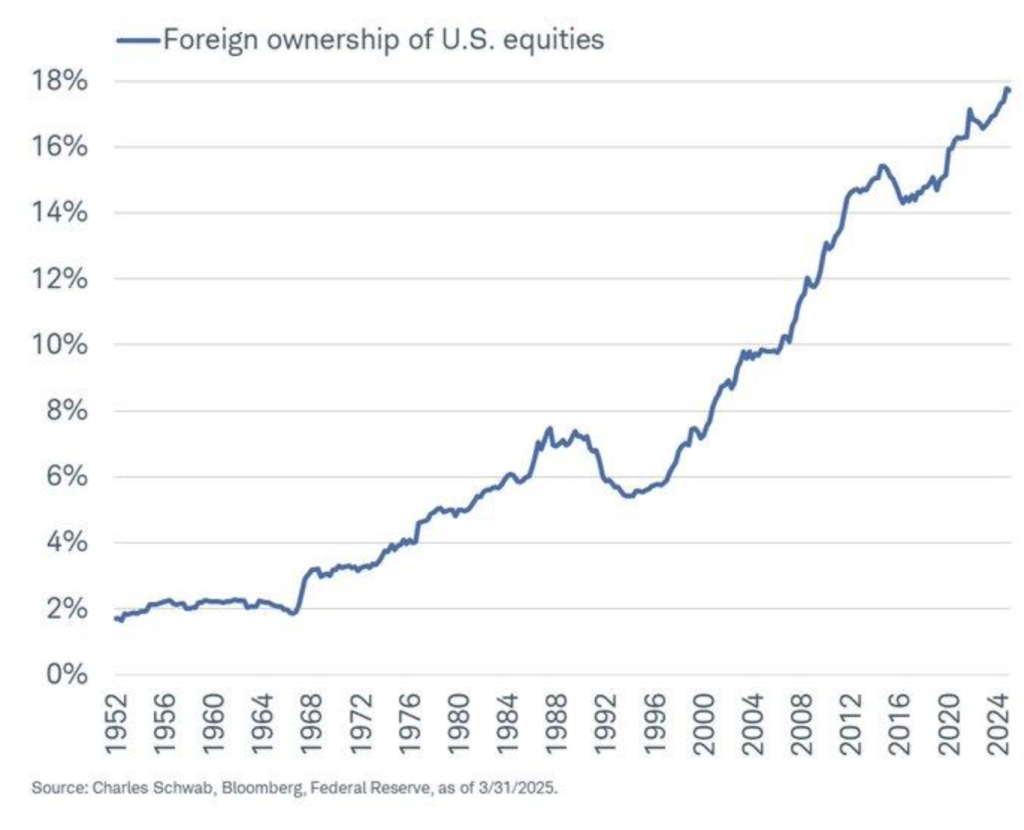
We observe a beautiful structural development: foreign American equity holding has jumped from 2% in 1950 to 17.7% in March 2025—an 800% increase in seven decades. With a minor correction from the top slots, the trend again observes world investor confidence in American financial markets amidst macroeconomic turbulence. Asset preference in the United States shows the strength as well as the liquidity in the marketplace irrespective of other world hubs reeling from political and fiscal polarizations.
This rotation is a strategic reweight by international allocators of capital, hedging risk exposure from surging U.S.interest rates—a 500 basis point gain since 2022. While the increase in rates typically deters equity inflows, the resilience through rising rates is proof of strength in U.S. corporate earnings, regulatory clarity, and the triumph of the dollar over yield-driven redemptions in allocative decisions. But the marginal cut from peak exposures may foreshadow a reweight in international portfolio weights by the lens of the rate sensitivity and FX volatility prism.
We call out Bank of New York Mellon (BK) as undervalued on this score. With broad exposure to movement in international asset flow changes through a topcustodian bank, BK stands to gain from growth in international participation in American markets. Foreign ETF inflows by institutions should go hand in hand with increase in analysts’ radar analysis along with growth in currency-hedged equity strategies and custodian fee growth as evidence signals towards lasting foreign investor interest. A reversal in the trend can pave the way towards a wider macro repositioning—though current levels indicate structural confidence in American equity markets.
Capex Confidence Ebbing Although Regional Growth Recoveries
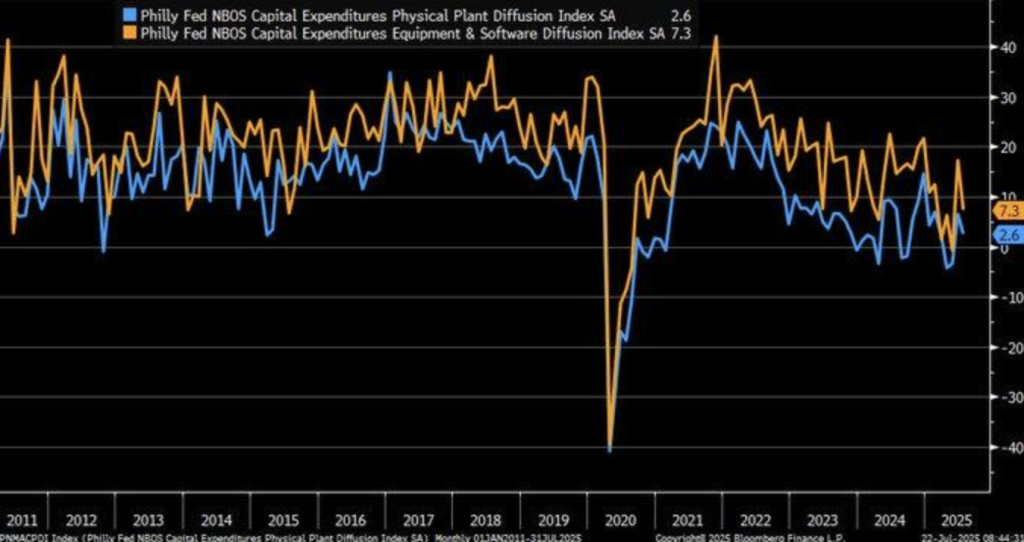
We notice a huge missing piece in the July 2025 Philly Fed release: while headline indicators suggest regional growth at a moderate clip, the Capital Expenditure Diffusion Index returned at 5.4—it lowest in several months. Previous readings in negative digits in this gauge have been associated with broad manufacturing disillusionments. The positive reading though turns sour indicates companies rethinking longer-run intentions for spending on capital and possibly preparing for macro headwinds despite apparent growth on the surface.
This circumspection is consonant with prior trends amidst unprecedented volatility in policy and trade. Businesses prefer delays in capital commitments in uncertain conditions, and the prevailing conditions of increasing global tariffs and unclear monetary signals likely contribute towards such circumspection. A disconnect between robust corporate confidence—84% of business leaders expect growth—but actual retrenchments in spending on capital reveals a credibility deficit between sentiment and spending on capital.
We think the stock of Honeywell International (HON) is too low in this environment. The years-long focus on the spaces for aerospace and automation and sustainable technology set the business up for cyclical gains once the environment turns. Strategists should look at other Federal Reserve districts’ indicators in current trade data and CEOs’ confidence indexes for confirmation or contradiction. A longer-than-anticipated slowdown in spending on the CapEx may foreshadow lagged industrial production advances and moderate short-term GDP growth despite bullish sentiment.
UPCOMING ECONOMIC EVENTS
Euro Area Flash PMIs, Rate Decision & Press Conference by the ECB, Flash PMIs in the United States, United States Jobless Claims, United States New Home Sales, United States Natural Gas Storage
We have in the week ahead a parade of significant economic developments potentially plotting the near-term course in world markets. With crucial PMI releases from the globe’s biggest economic block (Europe), a conclusive European Central Bank (ECB) economic policy meeting, and fresh reading into the US labour, housing, and energy dynamics, investors should brace for potential volatility in bonds, currencies, and stocks. Below is our in-depth analysis on the things that will matter and why:
Flash PMIs Manufacturing & Services (France, Germany, Euro Area, UK)
First on the docket will be the large release from Europe in the Flash PMIs which will reveal whether the industrial and service-oriented areas in the region are accelerating or dropping further into contraction.
- A beat by actuals from expectations—especially in manufacturing-heavy Germany—the fear of stabilizing demand will gather traction and see the euro and sterling gain ground whilst European stocks and banking shares gain traction.
- A pickup in the services area would reveal strength in domestic consumption and see the outlook for the ECB benchmark reassessed. Subdued PMIs will see new doubts over softness in the economy gather traction and will likely spark weaker regional currencies and downward bond yield pressure and rotation into the more defensives staples and utilities areas.
Main Refinancing Rate, ECB Monetary Policy Statement & Press Conference
Week’s probable highlight will be next week’s ECB policy meeting. Although the consensus fore cats widely a hold in the rates, the forward guidance will be in sharp focus.
- A hawkish bias by the ECB—the back of sticky inflation or wages pressures—would tend to appreciate the euro and steeper the yield curve more sharply, especially in the peripheral European debt.
- Dovish signs on weakness in growth concerns may spark an equity and risk rally and slam the euro. The press meeting will provide perspective—any debate regarding the damage from trade, soft PMI trends, or fragmentation concerns will increase the short-term in local volatility.
U.S. Flash Manufacturing & Services PMIs
July business activity will have the first real-time reading from the US PMIs.
- A surprise beat will clear the way in favor of the Federal Reserve continuing a hawkish approach and will push the cycle stocks such as industrials and financials higher.
- A soft reading from the numbers will have rising recession risk, will bring about buying in Treasuries, and will raise stocks such as tech and healthcare. Services PMI will particularly host the reading as the US represents a consumption-oriented economic landscape. A fall in this reading will reveal increasing stress on the margin and sentiment toward the consumer.
U.S. Unemployment Claims
Weekly unemployment claims still offer the latest reading on labour market health.
- A smaller-than-forecast reading would back the thesis on renewed strength in recruiting, bullish stocks but again raising inflation concerns—putting upward squeeze on Treasury yields and getting the Fed nervous.
- A larger-than-forecast reading would give the fear on jobs market cracks and tend to induce bond buying and a defnesive rotation back into equity universes and temper the expectation on the next Fed hike.
U.S. New Home Sales
The housing category is stressed by unaffordability and elevated mortgage rates.
- A beat on new home sales above expectations would in most cases indicate imbedded strength in home purchase demand benefiting homebuilding and real estate related stocks most probably. Such in most cases would underlie broad American growth confidence prompting inflows into building and consumer discretionery sectors.
- A soft reading may potentially raise red flags on consumer lending and stagnantly absorbed inventories–testing housing related stocks and possibly providing downward revisions in GDP expectations.
U.S. Storage Gas Natural
Though even more precise in nature, natural gas store statistics are just as crucial in forecasting the sentiment on the energy complex.
- A bigger-than-anticipated building will normally reveal weaker-than-anticipated requirement or supply excesses, in the vast majority of cases offering bearish price sentiment and disappointing stock reactions in the producers of energy.
- A smaller-than-anticipated building or draws will help towards price pick-up and help stocks in E&Ps with heavy natural gas coverage. Because volatility in the energy complex continues to be distinctly linked into geopolitics, the statistics still greatly influence position making in the region.
While these play out, we would suggest remaining agile and actively seek movement against expectation. Every release of data will lead into the response in the form of monetary policy, sentiment in the marketplace and rotation potential within asset classes.
STOCK MARKET PERFORMANC
indexes continue in June Low Apr Pros, but sustained drawdowns signal structural risk
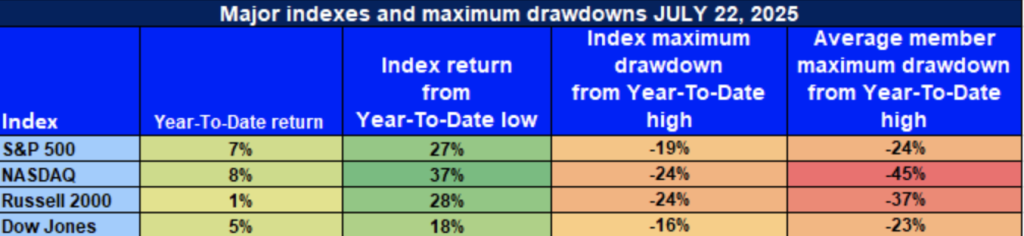
Equity markets mounted a robust recovery from April 8th lows, but whether this rally has any staying power is uncertain. While headline numbers are good, underlying member action as well as drawdowns over recent weeks indicate risk appetites both concentrated tightly on a small set of industries. That return levels across-index exist alongside mean member losses is a testament to how ephemeral is prevailing market sentiment.
Here is our most recent estimate based on leading indexes indicators:
S&P 500: Greater Resilience with Tighter
YTD: +7% | 27% off April low | 19% below YTD high | Avg. member: -24%
The S&P 500 is well within its rally with a 7% year-over-year advance and a 27% rally from April lows. Yet, with a rapid -19% drop from its YTD high and average member falls of-24%, spotty behaviour for a rally continues with more megacaps propelling it than with more generally based participation.
NASDAQ: Leading Sectors Strong, Breadth Weak
YTD: +8% | +37% from April low | -24% from YTD high | Avg. member: -45%
Nasdaq paces leader with 37% gain since April lows and 8% YTD. But average stock is down -45% from tops, a reminder of ongoing pressure in high-growth/valuation name stocks that offers a caution flags for sustainability.
Small Caps Trail Despite Russell 2000 Reversal
YTD: +1% | -28% from April bottom | -24% from YTD top | Avg. member: -37% Despite a decent 28% bounce off the April low, the Russell 2000 is still modestly up year-to-date by only +1%. This underperformance combined with the -24% drawdown and -37% average member fall suggests investors’ limited confidence in economically sensitive small caps.
Dow Jones: Pretty Stable, But Not Pencil-And-Paper
YTD: +5% | -18% since April low | -16% from YTD top | Avg. member: -23% The Dow Jones earned a modest 5% YTD return with an 18% rise off April bottoms. A comparatively modest -16% drop is a reflection of members’ defensive positioning, but median member falls of -23% indicate that blue-chip value stocks smart too.
We remain guarded—at Zaye Capital Markets—but focus on cash-flow healthy names with good margins and buyout sponsorships. As long as participation remains less general and drawdowns less stable, we remain cautious while taking advantage of sector rotation and relative outperformance.
THE STRONGEST SECTOR IN ALL THESE INDICES
Industrials Take the Lead with Divergent Vitality Across Horizons
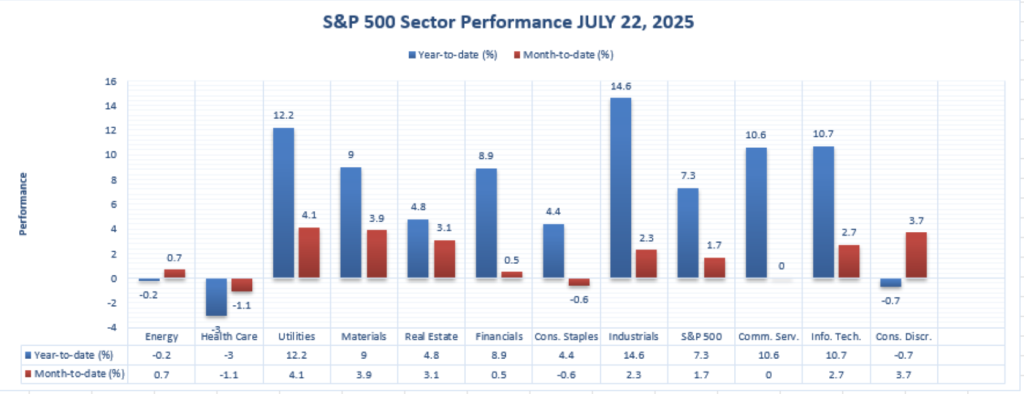
As of July 22, 2025, our S&P 500 industry analysis shows the majority of full strength within the industrials sector, posting year-to-date and month-to-date leadership. Within a season of rotation with select leadership, industrials are the outperforming group based on robust demand, investment in infrastructures and defensive revenue streams.
📊 Industrials YTD: +14.6% | MTD: +2.3%
Industrial shares continue calendar year front-runner with a return of +14.6%. On even a brief calendar, they’ve been on a tear with a month calendar return of +2.3%. This unrelenting outperformance is a loud vote of confidence in capital machinery, aerospace, logistics, and construction groups that are aided by fiscal tailwinds and strong corporate capex spending.
Against them remain in the red healthcare (-3.0% YTD), consumer discretionary (-0.7% YTD), and consumer staples (-0.6% YTD) while technology and utilities even lag behind despite themselves being leaders, behind industrials with a small +10.7% YTD, while a small gain with a +12.2% YTD is felt. It is our tactical allocation watchlist leader with its industrials sector win at putting defensive stability together with cyclical potential.
We remain bullish on selective industrials with pricing power that also have international revenue exposure along with strengths in backlog. It is our opinion that they will be insulated from volatility while taking profits into H2 2025.
Earnings
Earnings Recap– July 23, 2025
- Alphabet Inc. (GO
Alphabet experienced a robust Q2 with revenue up 14% year-over-year to $96.43 billion and EPS of $2.31, beating estimates. Growth was due to a 32% jump in Google Cloud revenue and a 12% jump in Search. It also bumped up full-year CapEx forecast to $85 billion due to more aggressive spending on AI infrastructure and data centers. This solidly centers Alphabet in the AI buildup story.
- Tesla, Inc.
Tesla posted under-estimated quarters with $0.40 a share, revenue declining about 12% while net income fell 23% year-over-year. The miss was attributed primarily to falling car deliveries together with falling revenue for revenue credits. While execution risk continues to hang over the stock, management reaffirmed its long-term robotaxi thesis and automation while remaining cost-disciplined as a near-term catalyst.
- T-Mobile US, Inc.
T-Mobile struck the right chord with Q2 EPS of $2.84 on revenue of $21.13 billion. T-Mobile added 830,000 postpaid phone customers, which was better than expected. Management increased year guidance based on strength of customer retention and ongoing wireless services traction.
- International Business Machines Corporation (IBM)
Q2 of IBM was a little better than expected yet shares declined about 5% after software and consulting prowess was tempered by softness in infrastructure services. There was investor worry that was brought about by slowing transition from past businesses combined with muted guidance despite silver linings that exist with hybrid adoption of clouds.
- ServiceNow, Inc
ServiceNow statistics were strong with $4.09 EPS and $3.22 billion revenue both outperforming estimates. Subscription revenue was up 23% year-over-year prompting the company to improve full-year estimates. Statistics represent enterprise confidence in digitization of workflow solutions.
- AT&T Inc.
AT&T reported according to forecasts with a profit of $0.54 a share on sales of $30.8 billion. The group lost 401,000 postpaid telephone subscribers but achieved flat fibre internet growth. Management again credited mobility revenue resilience and restored confidence in cost focus and future tax benefit to support capex outlays.
Earnings Preview – July 24, 2025
- Blackstone Inc.
Investors will be closely focused on fee income, deployment levels, and real estate and private credit asset flows. Growing interest in private markets will have focus on fundraising pace as well as investment strategy be the required way of measuring Blackstone’s position in a higher-rate environment.
- Honeywell International Inc.
Performance of the industry under Honeywell’s aerospace and buildings technologies will be addressed today. Margin trends as well as forward comments are notable particularly as they reflect industrial power along with its capacity to manage input costs for its worldwide operations.
- Union Pacific Corporation
Union Pacific profits will provide a clue to U.S. freight volumes and pricing power. We prefer to see indicators of cyclical softness or strength in industrial freight transportation, a top harbinger of big macro moves. Revised FY guidance will be a leading sentiment driver.
- intel Corporation
Intel profits would be reflective of stabilization of chip demand, AI-capex spending in particular, as well as optimisation in its fabs. Markets will be looking for whether it recovers competitive share in data centers as well as PC chips while it has difficulty in recovering share lost in past cycles.
- Newmont Corporation/New
The Newmont report will be driven by gold production volumes, cost-per-ounce trends, and cash flow generation. As gold prices are still volatile, investors are looking for clarity on operational discipline as well as dividend policy, particularly in a year challenged by mining headwinds globally.
- Nasdaq Inc
Trading-quantity patterns from Nasdaq’s announcements of earnings will be disclosed along with repeat technology revenue. Investors will examine rates of market activity, listings of corporations, and fee-based offerings while determining Nasdaq’s exchange-technology hybrid model for varying regimes of rates along with volatility.
- Dow Inc.
Dow’s results will offer insight into global manufacturing demand through chemical volumes and prices, and investors need to consider if the company is managing margins in the wake of input cost shifts, especially with global PMI softness continuing to dampen end-market demand.
- West Pharmaceutical Services, Inc.
Expectations from West Pharma will be derived from demand patterns for pharma and biotech customers analyzing injectable solutions. Margin guidance along with supply chain commentary will be interpreted by analysts for future pricing stability along with H2 2025 order clarity.
Stock Market Commentary – Thursday, July 24, 2025
Markets rise for most of the day as investors digest a series of high-impact reports, AI investment releases, and trade reports. Sentiment for companies remains positive in areas of growth even with larger valuation concerns that remain near record levels with leading indexes. Geopolitics tapers off and central bank rumor is in limbo with players looking for earnings for short-term guidance.
Stock Prices
Economic Parameters and Geopolitical Events
Bullish mood was also boosted by signals of easing U.S.-EU and U.S.-Japan trade tensions on one hand, while firmer PMI forecasts in early European reports on the other. In the meantime, what’s coming next from the Federal Reserve remains disputed, with markets pricing in a hold while closely listening for rate-speak. Investors remain waiting for earnings forecasts and capital spending by sector given that rate reductions appear to be delayed.
The Magnificent Seven & S&P 500 Dynamics
S&P 500 increased modestly with large gains coming from ServiceNow and large gains from Alphabet. The latter’s cloud business increased year-over-year 32% with enterprise demand being “absolutely on fire,” solidifying its leadership in AI infrastructure. But even megacap territory is susceptible to frenzied trading with some names gaining.
Tesla (TSLA) shares are weak after a Q2 EPS letdown. While long-term AI positioning continues to be robust, short-term delivery and margin risk are tested for investor morale. Meanwhile, Microsoft, Meta, Nvidia, and Amazon trade laterally with flat momentum that mirrors valuation and growth concentration issues.
Individual Stock News
Tesla (TSLA) made early discussions with Nevada authorities to introduce its robotaxi service—the forerunner of being due to commercialise its policy of autonomous driving. Tesla also continued beefing up its AI stack hardware with an additional investment of $560m in Nvidia H200 GPUs for its Cortex system, taking a cumulative total of $2.3bn H100 and H200 GPUs. CEO Elon Musk made moves to manufacture some 100,000 units a month of its humanoid robot Optimus in five years with a aggressive automation strategy.
AMD CEO Lisa Su reported that TSMC chips made in the U.S. are about 5-20% more expensive than their Taiwanese counterpart. Even with that cost, she reaffirmed that orders for Tesla and OpenAI are still strong representative of strong demand for AI hardware.
Alphabet (GOOGL) keeps cruising enterprise AI tailwinds with Google Cloud break-out growth. The platform has been a star for Alphabet so far with share gains from a highly competitive environment for clouds.
Important Index Performance up to July 24, 2025
- Nasdaq Composite: Up ~0.45%, led by optimism in semiconductor and AI stocks.
- S&P 500: + ~0.15%, leaders of gains being clouds and artificial intelligence space.
- Dow Jones Industrial Average: Off ~0.2%, dragged down by IBM’s decline in earnings despite industrial health.
- Russell 2000: Higher ~0.3%, with risk appetites coming back into small-cap stocks cautiously.
We maintain a structural AI winners and intelligent capital allocation strategy notwithstanding being responsive to index breadth decline, sector underperformance, and shifts in forward guidance.
Gold Price – Thursday, July 24th 2025
Gold is some $3,387 per ounce today, a touch off yesterday’s close of $3,397, as a subdued equities rally and eased U.S.–Japan trade tensions faced muted safe-haven demand for gold. But underlying support lies in weaker dollars and declining yields in Treasuries. Today’s flash PMI data from France and Germany for the Eurozone as a whole and for the U.S. join jobless claims data and new home sales data as a litany of matters of investor interest. If these gauges forecast economic exhaustion, they might look for rising demand for gold as a store of value if ECB or Fed rhetoric is dovish. On a different level, stepped-up criticism by President Trump of the Federal Reserve to go along with his demand for a three-point reduction in interest rates and policy discord on AI, tariffs, and housing represent one area of uncertainty that has a way of underpinning speculative demand for gold.
Tuesday’s softer-than-anticipated U.S. existing-home sales further solidified assessments of a slowing economy, dampening yields while softening the dollar—both of which remain bullish for gold. However, a growing optimism for international trade along with forecasts for less aggressive ECB tightening has moderated upside potential. If today’s U.S. data surprises on both short-sides while Trump’s control of rhetoric for money tightens more further, market forecasts might drift toward more drastic easing—returning gold to the $3,400–$3,450 range. From our Zaye Capital Markets perspective, gold does remain range-bound for now with inflation sentiment drivers of central bank tone along with geopolitical positioning.
OIL PRICES – Thursday, July 24, 2025
Oil prices are at the $65.49-a-barrel level, 0.36% higher on the day, in mismatched supply-demand disparities and geopolitics speculation. Prices gained a short-term boost from recent Iraqi Kurdistan production interruptions due to drone attacks, reducing supply from a key export pipeline. But upside is capped by OPEC+’s plan to increase output by 548,000 barrels a day in August—a gradual build-up process that amounts to 2.1 million bpd over the course of the year 2025. In the meantime, the International Energy Agency (IEA) predicted modest global demand growth of just 700,000 bpd during the year, at risk of oversupply during the second half. And so, oil is stuck in the doldrums at $65–$70 as the market looks for a clean-cut demand driver.
President Trump’s Federal Reserve rate cut attacks and Powell have indirectly put pressure on oil sentiment by casting a bearish cloud of uncertainty over economic growth expectations. His remarks linking housing market performance slowdowns to higher rates and linking AI exports to deregulation bring a dangerous mix of uncertainty and potential policy changes to fuel and industrial demand estimates. Yesterday, in contrast, weak U.S. housing data softened the dollar and yields to the benefit of crude moderately. Today’s economic releases on the agenda, however, such as flash PMIs, unemployment claims, and new home sales, will have a dramatic effect on oil prices. Weaker prints will amplify demand concerns and propel crude lower, with better data favoring optimality of consumption. At Zaye Capital Markets, we anticipate oil to remain in a $62–$70 trading range, with macro data, OPEC+ releases, and more geopolitics fueling momentum.
Bitcoin Prices – Thursday, July 24, 2025
Bitcoin now sells for around $119,025, slightly off yesterday’s 0.5% intraday decline from around $123,000. Still firmly above that key $118,600 support line itself, broader crypto markets also relinquished ground with modest alt declines and patchy macro mood. Yesterday’s rally off that GENIUS Act—that produced a stablecoin rulebook—created renewed new institutional conviction for Bitcoin as a digital-asset class leading base. This rally now even has lost some speed with traders looking for additional near-term reassurance in U.S. economics data as much as crypto rule. On the flip side, adoption rising—from that listing of Block onto the S.P. 500 to that PNC Bank deal with Coinbase—supports Bitcoin’s market base more.
President Trump’s combative drive for low interest rates, Fed attacks, and economy revivification focus by AI/IT and exports can make Bitcoin more attractive as a store-of-value against fiat/policy volatility. Equally, legislative momentum like yesterday’s Senate draft RFIA bill distributing regulated clarity to SEC is instilling long-structural optimism. Yesterday’s soft U.S. housing data together with stable Treasury yields helped crypto prices by dispensing fear of instant spike in rates. Today’s releases—most significant of them flash PMIs/ jobless gains—will be pivotal. If data remains soft, more inflows into Bitcoin may be seen on weaker dollar projections; if it surges, short-term profit taking may be seen. Our perception at Zaye Capital Markets continues to be that Bitcoin is underpinned by growing institutionalisation as well as policy reform, near-term direction most likely being propelled by macro catalysts as well as regulated clarity.
ETH Prices – Thursday July 24, 2025
Ethereum hovers around $3,648.73 as it retrenches a 2.49% session decline from near-term highs of $3,754. However, underlying strength persists on account of spot ETF demand by institutions for Ether. ETFs for ETH in turn for 13 consecutive trading sessions now saw a combined near-$4bn aggregate near-term net inflows topped by a one-day influx of a record-high $533m that reflects burgeoning investor demand for exposure to Ether. On-chain data also supports a parallel whale demand surge with reports a couple of giant wallets stacked more than $240m in ETH in recent trading through over-the-counter accumulation vehicles in addition to new address creations that allow for a structure supporting spot levels currently.
But selective profit taking was also witnessed with one whale reaping near $10mm of profits by liquidating 8,005 ETH around levels of $3,751 yet holding a significant holding. This double trend of rotation with accumulation is an indicator towards institution-driven healthy market rather than speculative one. With ETF demand now easily outstripping ETH’s net issuance supply-side tightness could further escalate if macro data like soon to be released U.S. PMIs indicate slowing economy. In our opinion from Zaye Capital Markets, Ethereum short-term range bottoms somewhere in between $3,400-$4,000 with potential for upside moves to $4,500 if institutional flow continues pouring in along with whale action being a net one of accumulation.
