Where are Markets Today?
The day begins the day moderately bullish to relatively unchanged for both U.S. as well as European stock futures following another record high day for both Nasdaq and S&P 500. S&P 500 futures are 0.16% higher, Nasdaq 100 futures 0.12% higher, and Dow Jones futures moderately higher by 78 points, or 0.17%. Euro Stoxx 50 as well as DAX futures are posting similarly muted strength, higher by more than 1% as hopes rise for successful EU-U.S. trade negotiation talks. This muted yet resilient mood is typical of a market moderately buoyed by strong earnings strength but constrained by geopolitical as well as economic risk, as both durable goods economics as well as retail sales look for confirmation of recent gains can be sustained.
The overriding catalyst for this subdued euphoria remains the strength of the earnings season. So far, with 83% of the 155 S&P 500 members reporting having topped Wall Street estimates, euphoria over corporate profits still remains high. Alphabet’s louder-than-anticipated profits and favorable AI spin particularly helped lift technology-predominant trailing sector more broadly as well as boost the Nasdaq composite into its first-ever 21,000 milestone reading. That said, this recovery comes with some qualifications—Tesla’s future-looking guide having raised new fears over EV sector saturation, some analysts remaining concerned about overpriced valuations for growth-centric sectors, especially among the “Magnificent Seven.” Also, rumors of some kind of trade agreement are providing futures markets with a sense of relief. More news of advancement towards a United States–EU trade agreement, with a reported 15% car tariff and muted commentary, is keeping a lid on panic about a widening of a tariff war. Following on from Japan’s recent deal, this provided the more evenly balanced bilateral terms of trade with a template. Euro futures have risen on the news, with DAX and Euro Stoxx making robust intra-day gains. This mood is, however, delicate—were there to be a change of mood from the Trump administration or a return of tariff threats, price gains would be rapidly reversed.
For Zaye Capital Markets, futures business for today is a buy-side search for verification. Following technical highs having been achieved, attention then turns to macroeconomic indicators—specifically, U.S. retail sales as well as durable orders goods—before recent bullish trading being validated. A disappointing surprise can spark fear of weakness in both consumer as well as industrial production, bringing the rally dead in its tracks. Better-than-expected numbers, however, can spark a further leg higher, especially if supported by dovish undertones by America’s Federal Reserve. For now, futures are suggesting a steady hand, but risks from politics, policies as well as economics are still live in a tight correlation for markets’ next step.
Key Index Performance up to July 25, 2025
- S&P 500 (SPY): Steady at $634.42, supported by collective gains for AI technology.
- NASDAQ-100 (QQQ): To $565.01, on new demand for cloud as well as leadership in AI software.
- Russell 2000(IWM): Down at $223.55, as a rotation from small caps on account of macroeconomic fears takes place.
- Dow Jones (DIA): Down at $447.11, down a little on weakness in the industrials and financials.
The Magnificent Seven and the S&P 500
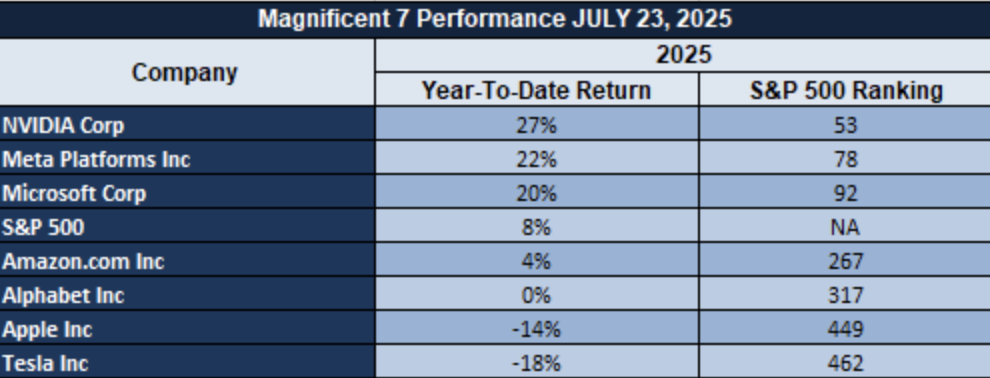
The S&P 500 is supported, still, a few mega-cap techs but stress indicators are building. Alphabet Inc. still dominates on a wave of AI infrastructure demand as well as computer time demand for cloud infrastructure, with Nvidia still equally riding high. Poor forward guidance is spoiling sentiment with Tesla, sending growth-sensitive indices lower. Index-level action relative to stock-specific fundamentals is decoupling more and more, affirming caution in general equity exposure.
Drivers Behind the Market Move – Friday, July 25, 2025
As markets open flat-to-positive today, three key recent developments are shaping both U.S. and European equity sentiment:
1. Trade and Monetary Policy Developments
Progress in U.S.–EU trade negotiations—anchored by proposals to set auto tariffs at 15%—has helped ease fears of escalating protectionism, supporting sentiment in European markets. Additionally, the recent U.S.–Japan agreement reinforces investor confidence that global trade frameworks are stabilising. On the domestic front, President Trump’s unexpected visit to the Federal Reserve and public criticism of renovation expenses have raised questions about the central bank’s independence, especially as he reiterated his desire for rate cuts. While markets reacted cautiously, they remain largely focused on data-driven signals, with most participants assuming that monetary policy direction will stay guided by macro fundamentals rather than political pressure.
2. Earnings Strength Anchoring Equity Resilience
Robust earnings continue to underpin the market’s upward momentum, with the S&P 500 and Nasdaq notching record highs this week. Alphabet’s better-than-expected results and bullish commentary on AI infrastructure have particularly lifted the tech-heavy Nasdaq. With roughly 83% of S&P 500 firms beating earnings expectations so far, confidence in corporate America’s profit resilience remains strong. This has helped balance out macroeconomic concerns and allowed markets to sustain gains despite looming headwinds in sectors like autos and financials.
3. Awaited Economic Data as the Next Catalyst
Investor attention now turns to a string of economic releases scheduled for today, including U.S. retail sales, core and headline durable goods orders, and Germany’s ifo Business Climate index. These indicators are expected to provide clarity on consumer demand and industrial output. Yesterday’s data pointed to a slight cooling in both areas, setting a mildly cautious tone across global markets. Should today’s numbers fall short, sentiment could quickly shift more defensive. However, stronger-than-forecast results would likely reignite bullish positioning and validate the recent rally.
At Zaye Capital Markets, we believe that these three dynamics—policy tone, earnings momentum, and macro validation—are collectively steering investor behaviour. The balance between political noise and data clarity will be key to determining whether equities can build on their record-breaking momentum.
DIGESTING ECONOMIC DATA
The TRUMP Tweets and Their Implications – Friday, July 25, 2025
President Trump’s recent series of executive orders and public statements are causing new jitteriness in financial markets, once again cementing the impression of an administration hell-bent on reassessing both macroeconomic course as well as institutional authority. His recent trip to Federal Reserve headquarters—where he vented bitterly about renovation expenses with a reassurance that Chair Powell would not be terminated—has again highlighted long-standing tensions between White House as well as central bank. Markets take this as both an assertion of executive fiat as well as a warning signal to policymakers in recent controversies about interest rate tilts. For investors, the episode adds still more political risk, which fortifies fears about central bank independence as well as unconventional consequences of policies.
The overall tone of Trump’s policies has gone in a direction of domestic consolidation, with sweeping executive plans on mental health overhaul, homelessness reduction, as well as college sports leadership restructuring. Such plans represent a more interventionist approach to societal challenges, with long-term consequences for state-level fiscal policies as well as for areas associated with healthcare. In moving towards college sports’ statutory status as well as federal moves on mental health, Trump is not only tapping cultural as well as economic narratives, but outlining a platform for potential federal spending reallocatioins—variables which in themselves are beginning to get priced into equities associated with healthcare as well as education. On the tech front, Trump has announced a broad pro-innovation strategy. Through signing a series of executive orders with AI as a foundation, one for building American AI infrastructure for export, Trump is delivering his government’s wider agenda of restoring United States leadership of digital change. That can have broad implications across tech industry valuations, public–private collaboration, as well as regulatory clarity—something especially for AI, blockchain, as well as cyber spaces. Businesses in the inter-section of innovation as well as infrastructure, particularly for semiconductor technology, cloud infrastructure, as well as digital identity, can be beneficiaries of policies.
Together, these announcements and statements have broad implications. From monetary pressures from the money markets to industry-focused shifts in regulation, Trump’s initiatives are restructuring risk profiles within asset classes. Our view at Zaye Capital Markets is that this new political environment is a key catalyst for Q3 investor positioning. Traders must be prepared for additional executive orders, particularly those aimed at energy, digital currencies, as well as trade, as they should significantly impact both tone within the markets as well as flows of capital during the next several weeks.
Manufacturing Rebound Masks Labour Strain In Midwest Gauge
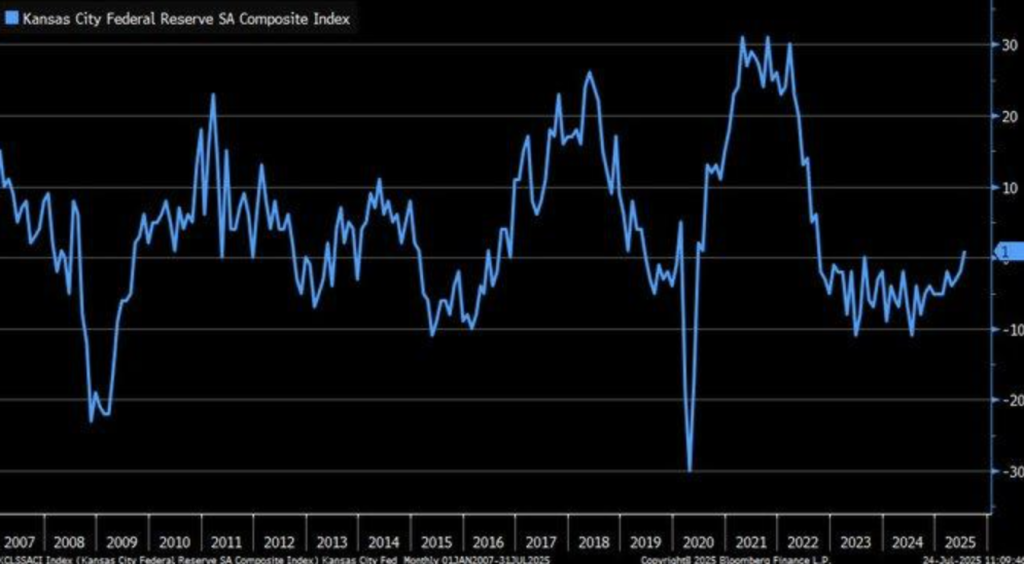
We also see Kansas City Fed Manufacturing Index bounce back into positive ground in July 2025 to +1 from a previous June reading of a flat line -2 to be top market forecasts of a flat line. New orders drove turn-around to a high of +2 showing early promise for industry. But off stage, the employment component fell to a low of -11—the lowest since early 2024—to record rising labour market frailty in regional manufacture.
Where previous trends exhibited common volatility trending trend has decreased since 2022 with May hitting -10. This fall highlights regional production cyclicality as short-term positive headline-index gains effectively mask fundamentally ingrained volatility. July headline-employment misconnection reflects previous Federal reports that labour stress along with supply chain stress tend to lag production surges. We see softening of “prices paid” to +47 as a possible leading indicator of diminishing input costs that would ease inflation concerns as well as near-term Fed positioning.
We prefer Honeywell International (HON) due to exposure to diversified automation systems with some volatility protection in headcount. Company’s strong margin control makes it a good regional peer comparator. Attention of analysts is warranted for future Fed minutes and August manufacturing PMIs for policy re-calibration signals along with re-verification of inflation moderation that will govern industrial equity flows for rest of Q3.
New Home Sales Short Of Expectations But Shortages Mounting
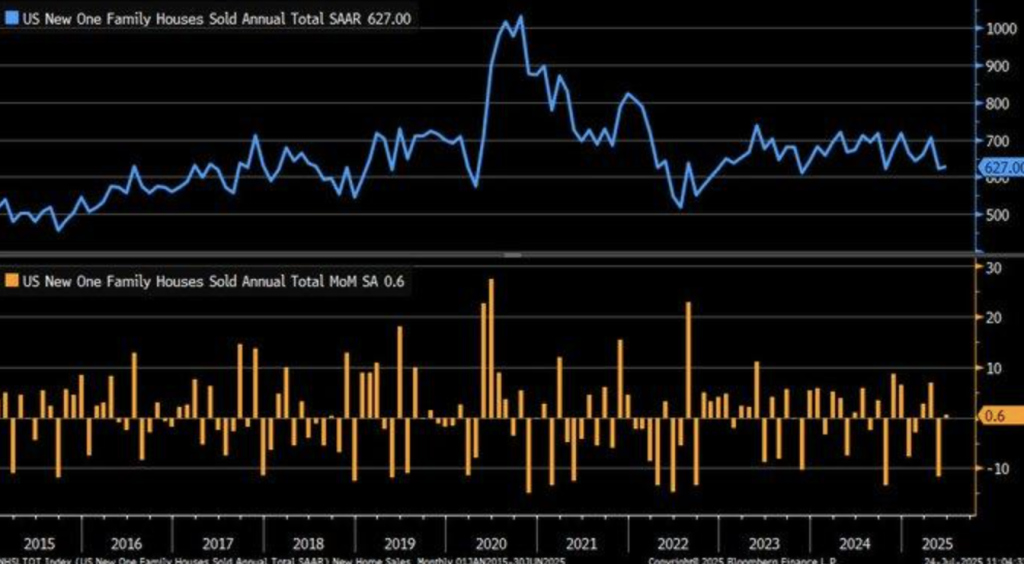
We observed that U.S. new single-family homes sales for June 2025 rose modestly by 0.6% month-over-month, a long way short of a predicted 4.3% surge. The median sales price dropped to $401,800 from a previous $422,700 in a soft market sign. Concurrently, months’ supply climbed to 9.8—a supply surplus and consumer indecision despite fixed benchmark mortgage rates. This couldn’t be more contrasting from that seen in the resale market, where 3.93 million existing dwellings traded hands for a modestly higher median of $435,300, indicating a gap between sale prices of newly constructed dwellings versus existing dwellings.
Beneath this trend lies a gap between consumer demand and supply growth that was telegraphed by further stock buildup in Federal Reserve Bank of St. Louis data. Where 2025 interest rates remain flat, it’s a tight pricing game that’s discouraging marginal buyers. The stock build that persists challenges assumptions of a recovering housing market with further build despite shrinking absorptions. History does prove that stock surges sow further pricing corrections.
Keeping that framework aside, we also believe that Lennar Corporation (LEN) is currently undervalued. Its leaner.inventories with healthy balance sheet also provide it a competitive edge coming out of slow absorption cycles. Housing starts changes with future Fed commentary for any indication around mortgage rate trends and resultant impact on purchaser demand along with construction phasing.
Initial Jobless Claims Fall Sharply, Pointing To Labour Market Durability
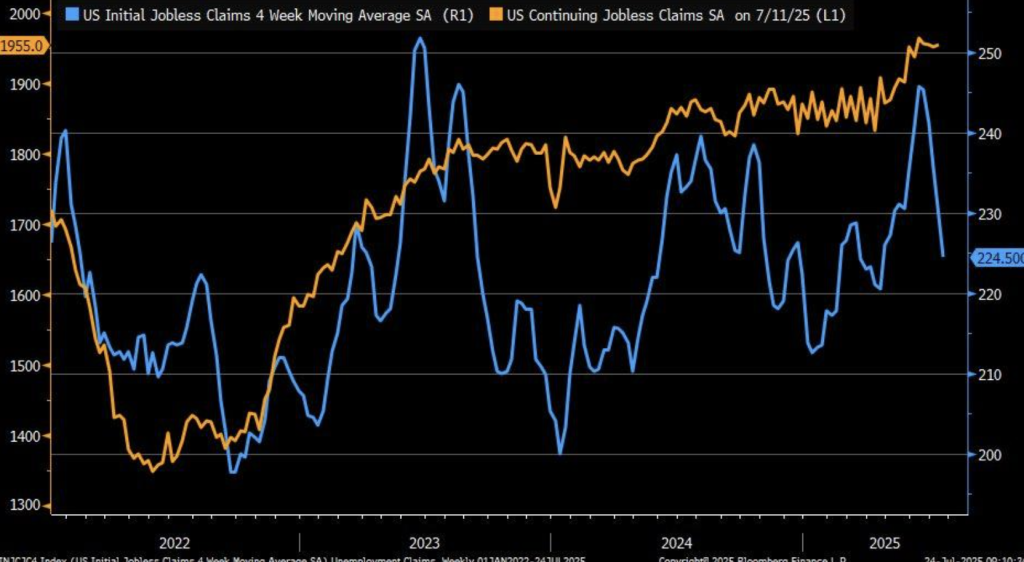
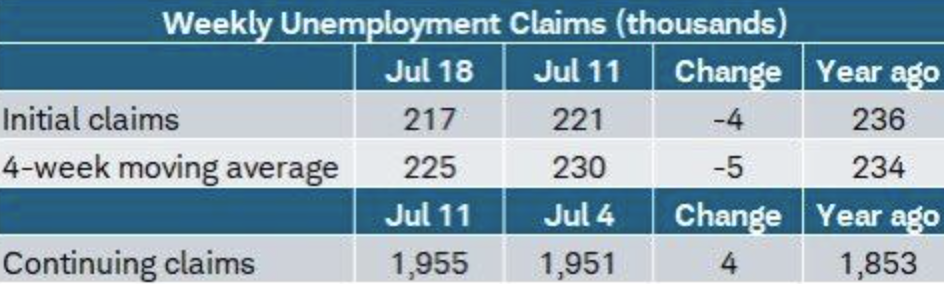
First-time jobless claims fell to 217,000 for July 18, 2025—better than expected 226,000 and a previous 221,000. This turnaround, as well as a four-week moving average of 225,000 (from 234,000 a year before), points toward additional labour market strength despite wider macroeconomic concerns. Yet moving advancing continued claims up to 1.955 million from modestly anticipated levels heralds newly materialised stress long-term in labour force participation, namely with policy changes looming in the background.
State variation confirms patchy landscape for here too: Kentucky experienced a 4.9k increase in claims while New York experienced a 12.3k decrease. The differentials identify a patchy state-level restoration characteristically evident in earlier patterns from St. Louis Federal Reserve Bank showing insured jobless responding differentially under cycle stress. Caution must be exercised with this small bump in continued claims for it might hide behind-the-headline vulnerabilities that becrip.
We also believe that Paychex Inc. (PAYX) is underpriced at this level. Its cyclic exposure to human resources and pay services allows for defensive operating scale that falls precisely in labour market inflection points. The analysts must closely monitor regional labour participation data and corporate hiring trends up to August as they could yet offer a clue if recently reported jobless data reflects underlying strength or temporary statistical one-off in a broader landscape of structural changes.
Mortgage Delinquencies Surge While Regional Stress Reemerges In The South
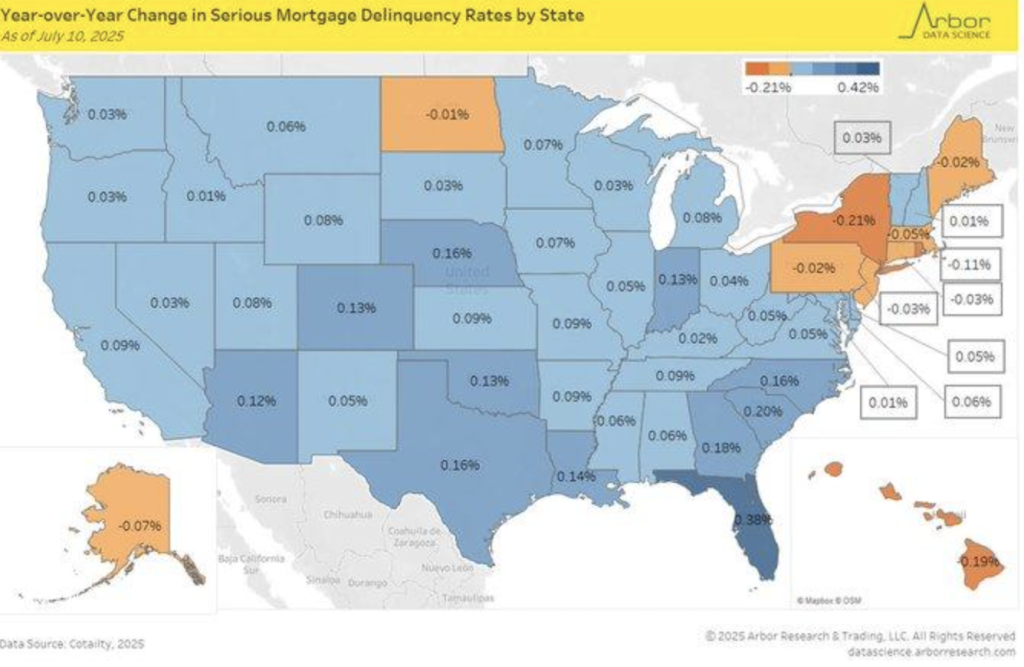
We also saw a significant jump in severe mortgage delinquencies (90+ days late) up until mid-July 2025 led by state of Florida (+0.13%), South Carolina, and Georgia. This jump offsets gains seen in New York state and Hawaii state pointing to patchy regional gains in housing. Nationally delinquencies jumped a marginal 4.04% to turn contrarian trends seen in months earlier. Again with labour markets being strong on a general level more intrinsic vulnerabilities seem to be seen with acceleration further in markets also subject to weather risk-related and broader macro-volatility.
Florida’s larger percentage also aligns with its 46 bps-quarterly Mortgage Bankers Association gain in its Q1 2025 forecast for the mortgage market. In addition to macro factors, ancillary factors of disruption related to hurricanes along with a cooling offsecond-market also seem to suppress borrower potential. Seasoned trends from National Bureau of Economic Research reports also indicate that higher insurance costs along with rising levels of interest seem to widen corresponding regional surges in delquency in more highly levered locations.
We also find MGIC Investment Corporation (MTG) to be cheap under these circumstances. In its role as a private mortgage-insurer service provider, MTG would benefit from more origination surveillance as well as credit-risk pricing. Analysts must be following changes in insurance-pricing levels levels, increased rates, along with policy changes in disaster-prone locations. Both mortgage credit-performance trends as well as sector-related equity moving into Q4 potentially will be influenced by these trends.
Mid-Range Housing Sales Climb As Luxury Market Contracts
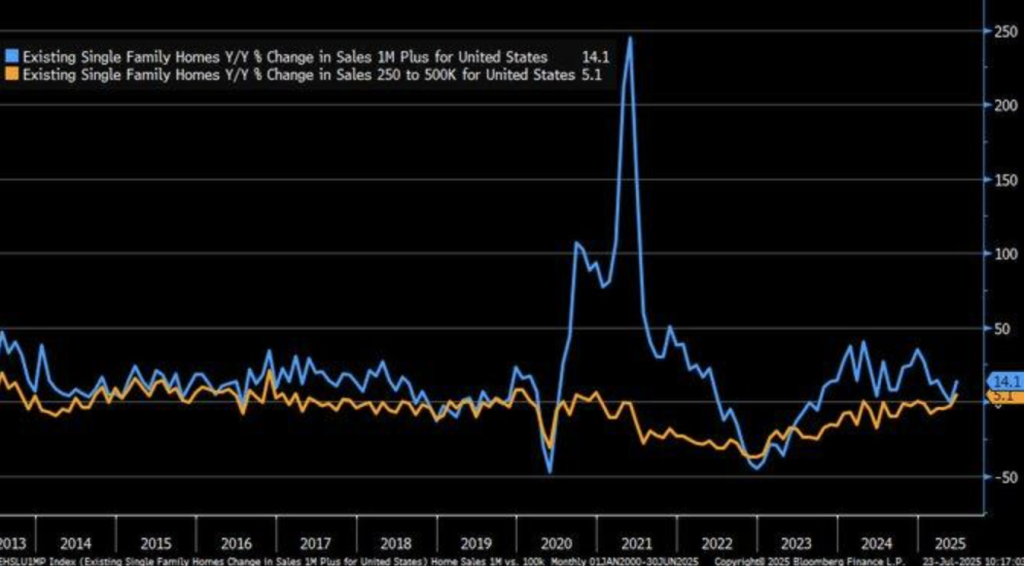
There also was a distinct bifurcation of the U.S. housing market. Units in the $250,000-$500,000 segment continued to recover from 2022 levels, while units in the exceed-$1-million category saw dramatic declines. This trend signifies a repricing of demand with continually higher mortgage rates—to 7.8% in 2023—that most affected luxury purchasers. At the same time, the middle range gained from more supply hitting markets with additional demand from buy-downs from higher-end markets as well as from first-time purchasers.
Data from Federal Reserve statistics and housing groups show that affordability limits are pushing demand out of higher-end markets. A 20% jump in sub-$500k supply of houses that was released in 2024 has accelerated that trend. Mid-level markets bounce back more readily from corrections in markets, as they did in 2008. A note of caution is, nonetheless, necessary with ultra-high rates still pinching across much of broader market for some time now and housing stock trailing some inner-city precincts.
Against this background, in our opinion PulteGroup Inc. (PHM) looks undervalued. Its move-up/affordable housing focus makes it a prospective beneficiary of flipped intentions from buyers. Analysts need to be keenly observant on trends in mortgage app due in forthcoming weeks/months, leading indicators of builder sentiments along with urban-rural turn-over changes. They will provide significant clues if mid-range stays strong (capable of retaining its leader position) or if credit gets tighter earlier with late ripples to broader housing momentum.
Existing Home Prices Climb Despite Rate Pressure And Global Contrasts
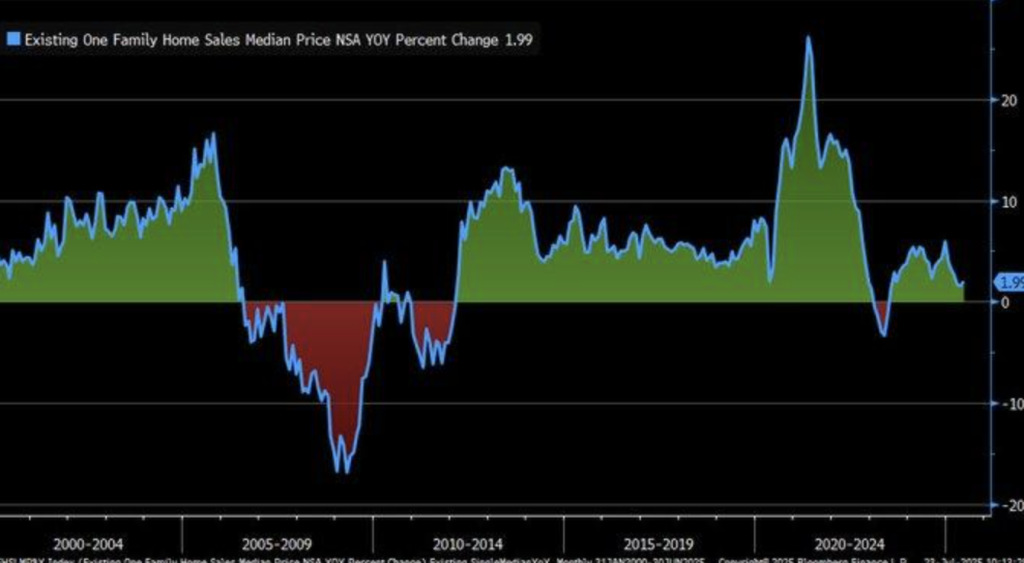
U.S. real estate markets continue to be robust with median existing single detached homes’ prices rising 1.99% year-over-year in June 2025. The trend is a big reversal from the 2008 housing market crash when prices fell by over 20% in the background of the subprime mortgage scandal. This time a supply gap of houses along with smarter lending standards so far has prevented any shock from rising rates and macroeconomic fluctuations.
Foreign forces that argue against a national strength also argue for it. In Britain, gains in housing that maintained lows—below 0.5% level in London-type supply-intensive markets—have highlighted demand-side U.S. strength, while a 6% increase in contracts to purchase recently inked has bucked seasonal softening characteristic of that time of a cycle. Census data for stock betray supply-constraints as a bullish force for pricing even as pricing for a lack of affords surges. This exception allows for a thesis that increased rates will also top housing prices.
We also think that D.R. Horton Inc. (DHI) is currently undervalued. Its emphasis on affordable/first-time housing enjoys a competitive edge in a supply-restricted marketplace with demand even in financial retrenching. Analysts need to carefully examine trends for mortgage rates, housing starts, and absorptions to see if this gradual acceleration in pricing is a harbinger to more acceleration or that acceleration that portends more deceleration in the marketplace.
Vehicle Tariff Surge Shakes US Auto Market And Global Supply Chains
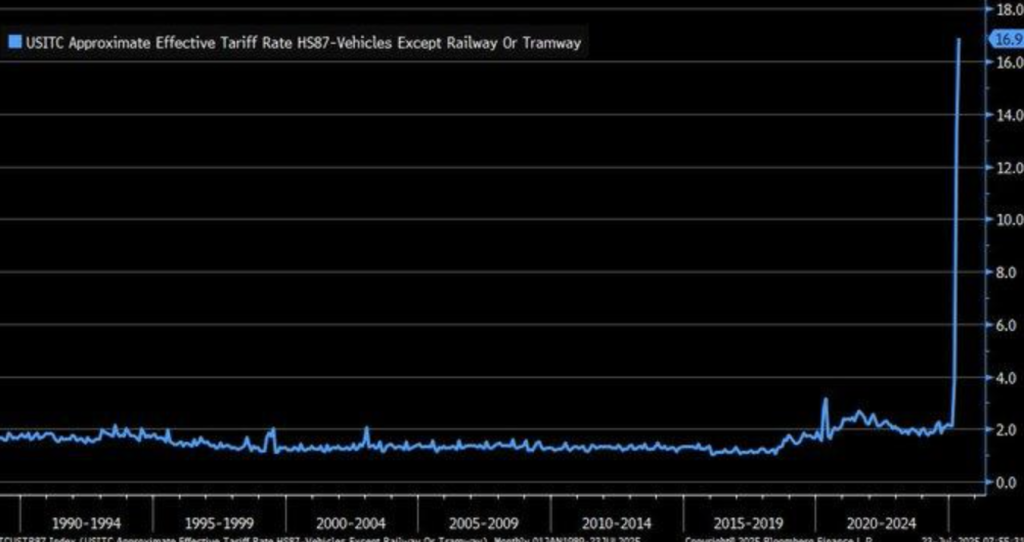
Effective U.S. protection for auto imports jumped to 16.9% in May 2025 from a long-term average of 3% or even less. This policy change with a need for protection for auto production for national security purposes has made a sudden impact on trends in pricing. New cars with a value of less than $40,000 might face additional spending up to a potential industry estimated size of $6,000 with car owners being forced towards available cars and facing a need for more aftermarket services—at a time with auto imports themselves facing additional spending.
This upward adjustment for a tougher competitive landscape does this specifically in response to a recently agreed bilateral trade agreement that decreased Japan car duty to a 15% level.Whilst this allows cheaper importations from Japan itself, it makes itcostly for American auto industry corporations with global supply chain dependency for auto parts. Higher input costs from more risky supply contracts with more protracted lead times will shave margins while introducing further volatility into the industry with doubts being cast on existing policy on tariffs.
Against this backdrop, our future outlook for AutoZone Inc. (AZO) is positive as it will gain from rising repair/maintenance demand with car owners retaining aged vehicles. Used car prices indexes, dealership equities, up until trade flows in Q3, will be gauges that require close tracking by analysts as they will be critical forerunners of consumer adjustment as well as possible policy re-adjustment under rising cost pressures.
Oil Rig Decline Signals Strategic Shift Amid Low Price Environment
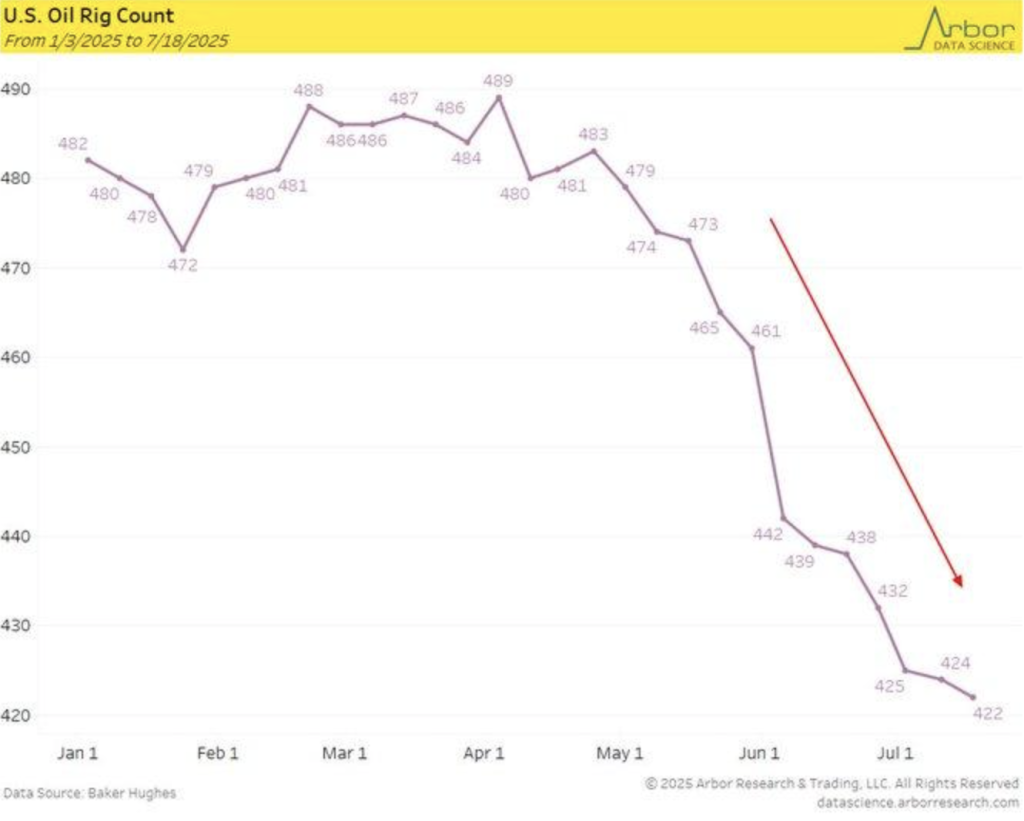
U.S. oil-producing locations rigs fell for a record consecutive 15 weeks from 473 units to 422 units, a fall of 10.8% since early 2025. The fall occurs despite increased volatility in crude markets alongside decreasing WTI prices averaging $70 a barrel in July 2025. Despite rhetoric from both politics for robust drilling, investment attitude is more restricted from economics alongside borrowings from strategic petroleum reserve than headline optimism or campaign rhetoric.
The sudden decline is characteristic of previous cycles, particularly the 2014-2016 crash when driller numbers dropped from over 1,600 to under 400 as prices declined. This most recent benchmark also implies that this cycle probably witnesses a conscious backing off more than a near-term decline. Drillers appear to be stepping back due to weaker margins expected, confusion induced by regulators, and slow global demand comeback. Accordingly, switching also reflects increasing sensitivity to expenditures with production break evens still being a concern despite subdued forward pricing.
We also mark Halliburton Company (HAL) as being underpriced in this arena. Its thinly built costs structure along with multi-footimprinted oilfield services entice a reacceleration as conditions lift. Technicians will be looking for indicators of rig productivity, SPR drawdown schedules, and geopolitical supply disruptions for they will set points of capital reallocation across the energy complex and shape any upstream return back into Q4.
UPCOMING ECONOMIC EVENTS
Retail Sales m/m, German ifo Business Climate, Core Durable Goods Orders m/m, Durable Goods Orders m/m
In advance of a pivotal week for global financial markets, investors prepare for a string of data that might dictate direction in both the Atlantic basin. Releases that range from as soon as U.S. consumer attitude up to a release from Germany on business sentiment seek to illuminate estimates that range from shifts in monetary policy to corporate profits along with general economy robustness. When inflation tension relaxes yet growth looks patchy, markets will be highly reactive to data surprises. This is a rundown of pivotal dates along with related releases that might influence trading permutations:
Monthly Retail Sales
Retail sales is one of the biggest contributors to U.S. GDP along with a real-time barometer of consumer health.
- If it beats estimates, it would be a good sign of healthy spending power that is potentially being underpinned by rising wages and job security. This would be positive for consumer-focused stocks, retail ETFs, and travel stocks along with being bullish for the U.S. dollar as markets rebalance potential policy tightness by the Fed.
- However, if retail sales is a disappointment versus estimates, it would underpin fears of household caution with rising debt levels and fatigue with rates. This would facilitate a switch out of discretionary stocks with a flow into defensive assets including bonds, gold, and consumer staples.
German Ifo Business Climate Indices
Germany’s ifo index provides leading insight into Europe’s industrial pillar.
- A better-than-expected reading would be bullish for a return to good business mood, potentially due to stabilising energy prices or improving global demand. This would be good for a bullish euro, tight EU sovereign bond spreads in the EU, and be good for cyclicals like autos and capex.
- A soft print would be a bad omen for Europe’s leading economy stagnation, dampening the DAX and potentially accelerating demands for further stimulus from the European Central Bank. For FX markets, it might exert downward pressure on the euro, especially vs. safe-havens.
Core Durable Goods Orders mom & Durable Goods Orders mom
These indicators serve as a proxy for private sector confidence and long-term investment.
- A strong beat in both core and headline figures would indicate that businesses are committing capital to expansion despite policy uncertainty—supporting the outlook for manufacturing and lifting industrial and machinery stocks. This could also drive U.S. Treasury yields higher as markets price in greater economic resilience.
- However, a disappointment in these numbers would suggest that firms remain cautious, perhaps holding back on investment due to geopolitical risks, elevated borrowing costs, or supply chain realignments. Such an outcome could see equity indices dip, particularly the Dow Jones and S&P industrial names, while reinforcing the appeal of safe-haven assets.
These aggregate indicators will provide markets with a long-awaited snapshot of the trajectory of the real economy. Both headline figures but also changes, driving factors, as well as leading indicators must be closely monitored by analysts as they will play a significant role in informing sentiment for the beginning of Q3.
STOCK MARKET PERFORMANCE
Indexes Rise Sharply Since April, But Member-Level Weakness Signals Underlying Caution
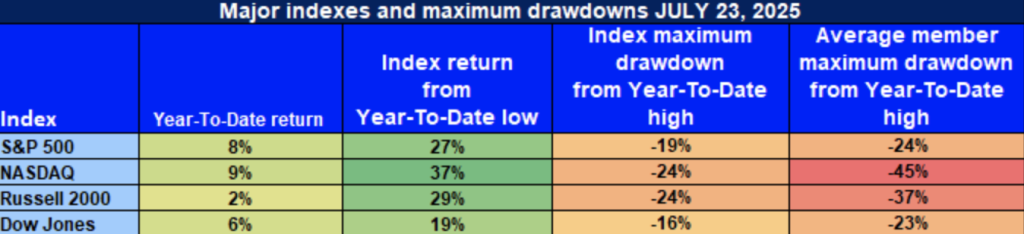
We’re near witnesses to the rally in U.S. equities. Big indexes surged out of bottoms from lows on Apr 8th yet worry about structure. The gap between headline gains in indexes and average member draw-downs signals a leader-led concentrated rally rather than a participation-led one.
Here is our latest analysis of equity performance according to most recently available data:
S&P 500: Large-Caps Big Winners; Small Caps Behind
YTD: +8% | +27% off Apr bottom | -19% off YTD top | Avg. member: -24%
S&P 500 is higher by 8% YTD and off 27% from its bottom in April due mostly to megacap appreciation. Yet a 24% average member decline and 19% decline from the YTD top remain lingering breadth issues—all of which members collectively cannot yet stand up.
NASDAQ: Oversized Bounce With Invisible Agony Below
YTD: +9% |-37% off bottom in April |-24% off YTD high | Avg. member: -45%
Best rally comeback is still that of NASDAQ with a 37% rally from April and a 9% YTD one while it also boasts worst average draw-down members to 45%. It reflects one-sided nature of rally with strong dependency on small list of tech titans while rest of the growth names remain long way in red.
📊 Russell 2000: Small Caps Lag Despite Sharp Bounce
YTD: 2% | +%29 below April low | -24% off YTD top | Avg. member: -37% Small Caps gained 29% from their lows in April yet the Russell 2000 gained a paltry 2 YTD—a harbinger of investor caution for economically vulnerable names. A 24% top-down drawdown with sharp member declines signals risk appetite weakness in this corner.
🏛 Dow Jones: Resilient But Still Vulnerable
YTD: +6% | +19% off April low | -16% off YTD high | Average member: -23% YTD 6% return and unremarkable 16% drawdown for the Dow merely mirror its defensively positioned membership with value-leaning industries showing relative stability. A 23% average member decline does show, though, that even safe-havens cannot hide from broader macro headwinds.
We from Zaye Capital Markets remain selective—preferring companies with solid fundamentals, sustainable earning power, and dominance in industries—yet closely watch breadth indicators to verify strength and duration of this market action.
THE STRONGEST SECTOR IN ALL THESE INDICES
Industrials Leadership for YTD and Month with Across-the-Board Performance
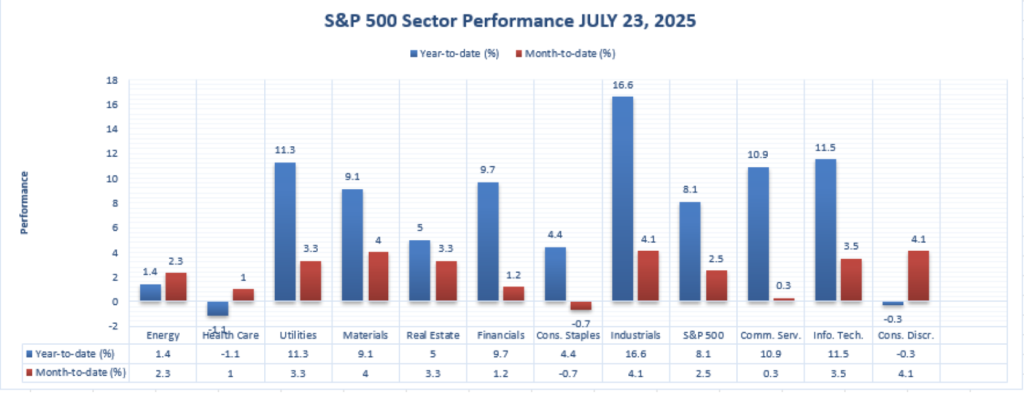
Of all industries that make up the S&P 500, Industrials remain top performers this year 2025 with both additional gains along with increased gains. Until July 23, the industry gained a year-to-date 16.6%–topping all other industries–and an additional month-to-date 4.1% appreciation for good solid investor sentiments. This twin movement speaks of a good health mix of cyclical tailwinds, good earnings, as well as infrastructures’ state optimism.
Some of the other good industries that stand out next to Information Technology (+11.5% YTD, +3.5% MTD), Utilities (+11.3% YTD, +3.3% MTD), and Communication Services (+10.9% YTD, even a good +0.3% MTD) aren’t quite yet up to the level of across-the-board gains that we’re seeing in Industrials, headed up by cycles of capex spending, trends toward reshoring, and
We remain optimistic on rotational strength in Industrials for exposure to automation, defence, and engineering construction. Both investors and analysts need further guidance from top industrial stars with announcements due for earnings and forward estimates that would justify any outperformance being sustainable further out in Q3.
Earnings
Earnings Recap – 24 July 2025
- Blackstone Inc.
Blackstone reported strong numbers, distributable EPS of $1.21, well past analysts’ expectations. Revenue surged 32.7% to $3.71 billion due to strong fee income from its lines of business in private equity, real estate, and infrastructure. Assets under management were a record $1.21 trillion. Blackstone also chose to increase its quarterly dividend payment to $1.03 as a means of telegraphing its belief about recurring cash flows as well as about building momentum in lines of alternative asset class performance.
- Honeywell International Inc
Honeywell exceeds expectations with Q2 revenue of $10.35 billion, 8.1% more than a year earlier. Adjusted EPS of $2.75 surpasses an expectation of $2.66. Everything was in aerospace, 10.7% higher due to good demand for components as well as maintenance. Honeywell raised its full-year outlook due to continuing demand for commercial aviation as well as building technologies, although free cash flow slowed slightly to $1.3 billion due to timing considerations.
- Union Pacific Corporation
Union Pacific revealed Q2 adjusted EPS of $3.15 amidst favorable pricing as well as improved operating efficiencies. Net income advanced to $1.8 billion, aided by lower fuel costs as well as flat freight volumes. Rumors of a merger with Norfolk Southern created upward pressures on shares, though management held its calls steady with a focus on capital discipline as well as cost competitiveness on core routes.
- Intel Corporation
Intel generated $12.9 billion of revenue—higher than estimates—although reporting a net loss of $2.9 billion. EPS of $0.10 trailed estimates of $0.01 due to restructuring costs because of layoff of workers as well as forgoing expansion aspirations in Europe. Apple, its primary customer for its Silicon products, is delaying orders as a result of eventual terminations of its iPhone business with Apple.
- Newmont Corporation
Adjusted EPS and revenue of $1.43 and $5.32 billion, respectively, both better than analysts estimated, were reported by Newmont. Adjusted EBITDA was $3.0 billion, fueled by increased realised gold prices and robust production. The miner confirmed full-year guidance despite temporary disruption to its Canadian Red Chris mine and reported enhanced capital discipline and free cash flow generation.
- NASDAQ, Inc.
The Nasdaq posted adjusted EPS of $0.85, 6% above what the street had expected, with revenue of 12.7% to $1.31 billion. The exchange operator cited strength in its index business as well as its analytics business. Shareholder returns were $155 million for the quarter, based on margin expansion as well as controls over costs, in support of the company’s position in a still-volatile market environment.
- Dow Inc.
Dow disappointed investors with an adjusted loss of $0.42 per share as revenue dropped 7% to $10.1 billion. Pack packaging and plastics demand stayed weak, forcing the corporation to slash its dividend in half to $0.35 a share as well as lay out cost-reduction initiatives including closing plants. Prolonged macro headwinds as well as tariff uncertainty were highlighted as key risks by management.
- West Pharmaceutical Services, Inc.
West Pharmaceuticals crushed estimates with $1.84 EPS, well above an estimate of $1.51. 10.7% growth of proprietary product sales and higher full-year guidance were a big boost. Tariff risk decreased to $15–20 million, a bullish for sentiment. Through superior execution of its core business in drug delivery, the company stands out in a defensive healthcare space.
Earnings Preview – 25 JUL 2025
- HCA Healthcare, Inc.
HCA’s first quarter will be analyzed for hospital admissions trends and revenue per patient. Staff shortages are ongoing and healthcare providers’ increasing wage pressures will have investors seeking signs of operational and margin strength. Commentary on forward guidance and payer mix trends will be the primary focus in identifying strength of outlook.
- Southern Copper Corporation
Southern Copper has to release commodity-sensitive figures. How much was produced and how much per tonnage will be of key interest, given that copper prices are volatile. Shareholders will be keen to find out the firm’s hedging program as well as any possible facts pertaining to capital expenditure within the context of an unstable industrial demand climate globally.
- Aon Plc
Aon’s fortunes will be fueled by its growth in its reinsurance, broking, and analytics segments. Markets will be keeping an eye on levels of fee retention, in addition to competitive pricing strength in renewals. General macro risks still remaining elevated, success in margin growth as well as consistent delivery of its earnings will be the determining factor of equity sentiment for the company.
- Charter Communications, Inc.
Charter’s Q2 will combine mixed broadband with cable subs trends. Churn with ARPU would be of greatest interest to analysts with consumers trimming discretionary spending. Updates on capex self-restraint, new growth initiatives, as well as broadband space headwinds due to regulations would be of greatest significance to investor sentiment.
We at Zaye Capital Markets will be watching thesearnings very closely to search for both short-term tactical trades andlong-term value plays.
Stock Market Commentary – Friday, July 25, 2025
Markets remain closely poised as investors process macroeconomic signals, company news, and building political commentary. Federal Reserve credibility is stretched with one more bout of criticism and tariff redeployment still echoing in terms of trade circulatory systems, with risk appetite scattered. Optimism regarding AI remains intact, however, breadth into stocks wanes.
Stock Prices
Economic And Geopolitical Imperatives
The wider market responded slowly to President Trump’s recent call for rate reductions and implicit challenge of Federal Reserve autonomy. Behind the scenes, there are still talks, with the United States keeping its tariffs high even in partial alignment with Japan and the EU. Durable goods order mixed signals are further fueling doubt about business spending strength in early Q3.
The Magnificent Seven and the S&P 500
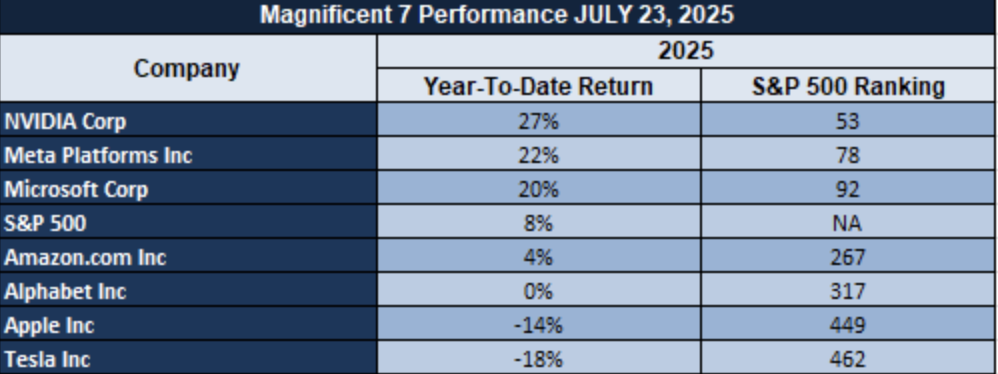
The S&P 500 is supported, still, a few mega-cap techs but stress indicators are building. Alphabet Inc. still dominates on a wave of AI infrastructure demand as well as computer time demand for cloud infrastructure, with Nvidia still equally riding high. Poor forward guidance is spoiling sentiment with Tesla, sending growth-sensitive indices lower. Index-level action relative to stock-specific fundamentals is decoupling more and more, affirming caution in general equity exposure.
Stock News Highlights
AST SpaceMobile ($ASTS ASTS launched a $500 million raise as a series of 2032 convertible notes in conjunction with a four-year bank debt issue to refinance $135 million of upcoming debt. It is structured to shore up its balance sheet as well as growth for its space-based broadband business.
Alphabet Inc. Alphabet acquired a $1.2 billion multiyear cloud services deal from ServiceNow ($NOW), for a second time cementing itself as a formidable AI infrastructure player. Investors feel they are underestimating Alphabet’s strategy richness in its AI foray—fears of a long-run winner for extended leadership after ad leadership.
Key Index Performance up to July 25, 2025
- S&P 500 (SPY): Steady at $634.42, supported by collective gains for AI technology.
- NASDAQ-100 (QQQ): To $565.01, on new demand for cloud as well as leadership in AI software.
- Russell 2000(IWM): Down at $223.55, as a rotation from small caps on account of macroeconomic fears takes place.
- Dow Jones (DIA): Down at $447.11, down a little on weakness in the industrials and financials.
We still maintain a focus on structural positioning and not momentum chasing. Policy risks are building up and concentration in the market is increasing, so quality, resilience in earnings, and sectors with fiscal resilience and price power are our focus.
Gold Price – Friday, July 25, 2025
Gold is trading at about $3,369 an ounce right now, up as investor sentiment swings with a dose of politico-pressure with an undertone of skepticism about economics. President Trump’s appearance at Federal Reserve building with his vituperative comments about costs of renovation—though after he pledges not to fire Chair Powell—stoked fears of autonomy for central bank. Noted with new executive moves on AI, mental disease, as well as college sports leadership, the market is taking those as a harbinger of more politicking of policy with institutional habits. That’s given a boost to gold’s image as a hedge, particularly as speculation grows about ever more the Fed is driven towards softer growth with rate reductions or a relaxation of liquidity. General story of more government intervention into controls of economics is creating demand for safe-haven destinations.
Meanwhile, release of upcoming economic figures—U.S. retail sales, Germany ifo business climate, and durable goods orders—introduces a twist into short-term gold dynamics. If those reports come in softer than anticipated, it would be supporting a story of slowing pace of economy, validating expectations of a more dovish monetary reaction—pushing gold prices further up. If, again, better-than-estimated data thwarts that script, it would trump further gold progress as yields return to normal. Softening of macro indicators yesterday already planted a fear of caution on asset classes, and taking positions to flights of safety have been induced. In Zaye Capital Markets, we continue to view gold as a strategic hedge in portfolios owing to policy rhetoric shifts, slowing pace of economy, as well as poor institutional confidence.
Oil Prices – Friday, July 25, 2025
The price of oil is trading at about $69.35 for Brent as well as $66.18 for WTI today, bouncing back near about 1% after four sessions of decline. Support came from a larger-than-projected 3.2 million-barrel decline in U.S. crude inventories as well as renewed hopes for a U.S.–EU trade deal. On the other hand, speculation for a Russia export ban of gasoline sparked short-term tightness of supplies. Nevertheless, OPEC as well as IEA remains subdued with its outlook with both forecasting tepid demand growth for 2025—700,000 bpd for IEA as well as 1.29 million bpd for OPEC. While OPEC+output keeps rising, with its biggest recent contribution from a sharp Saudi increase in exports, this leaves a hangover of supplies which tops price exuberance, especially with declining demand in Asia.
President Trump’s recent statements, although not naming oil explicitly, still injects policy uncertainty into general markets. President Trump’s Fed criticism, calls for regulator reform, as well as focus on U.S. factory revivals, all feed macro-sensitive energy market response. His mercurial tone surrounding trade as well as institutional policy offer a risk premium to energy commodities such as oil. Data-logically, yesterday’s disappointing weaker-than-expected durable goods as well as retail reads did feed worries about weak economic momentum as well as a possible dampening effect of upcoming oil consumption. Today’s major data releases—U.S. retail sales, Germany ifo business climate, as well as durable goods orders—will be crucial; disappointment would create upside pressure upon oil prices, as well as better data would offer short-term respite only unless accompanied with production restraint from the majors. At Zaye Capital Markets, we still track the balance of supply-demand as well as macro-policy settings as key drivers of near-, as well as intermediate-term oil valuation.
Bitcoin Prices – Friday, July 25, 2025
Bitcoin sells for about $117,200 per coin, declining somewhat from recent highs as the market absorbs a series of politcal and regulator cues. Yesterday’s historic legislative passage of the GENIUS Act provided clarity long overdue in stablecoin constructions, taking digital asset market cap past $4 trillion. Cointed with anti-CBDC bills ad CLARITY Act advancing in House, investors have greater clarity with regulations. Institutional demand, however, is going deep—fuelded by MicroStrategy’s purchase of more than 6,000 BTC, taking cumulative holdings past 607,000. While still well in front as a major market player with nearly 198,000 BTC across departments, a new group of competitors for strategic holders of Bitcoin—governments—has entered onto the scene: governments, with Texas havingadiercially approve a Bitcoin reserve law.
President Trump’s recent move—his executive orders regarding AI to statements of affirmation for Elon Musk to a visit to the Federal Reserve—are stoking speculation for a more friendly-to-cryptocurrency White House. Such a move is serving to enhance Bitcoin’s reputation as both a political hedge as well as a decentralized store-of-value. Yesterday’s weaker United States economics across retail sales as well as manufacturing helped fuel growth jitters, which have a tendency to strengthen demand for unorthodox currencies such as BTC. Upcoming, this day’s economics releases—mostly retail as well as durable goods—are set to further affect sentiment. Weaker prints can enhance Bitcoin’s attractiveness as a macro hedge as uncertainty increases, while strong prints can limit eventual gains for the short-term. At Zaye Capital Markets, our sentiment for Bitcoin is bullish as structural adoption picks up steam as well as United States policy further shifts towards legitimizing digital currencies.
ETH Prices – Friday, July 25, 2025
The price of Ethereum is currently at around $3,684.57, having risen 1.19% today as institutional demand and strong inflows into ETFs push it upwards. ETH spot ETFs have experienced 14 uninterrupted days of positive flows in a row, with a $332 million inflow on July 23, taking total holdings in ETFs past $10 billion. Tightening of supplies in response to this strong demand has specifically come as whale activity increases—over 150,000 ETH have gone into top wallets this week alone, with one of them adding $145 million of ETH alone. Zaye Capital Markets analysts believe that this indicates strong deep institutional conviction, with staking growth, DeFi integration, as well as programmable contract functionality, underpinning ETH valuation strength as we speak.
Macroeconomic as well as political narratives are giving tailwinds as well. President Trump’s tech-savvy rhetoric, focus on AI supremacy, as well as recent pro-crypto policies such as the GENIUS Act, have given optimism for Ethereum’s eventual long-term function as a decentralized layer of infrastructure. Yesterday’s soft U.S. retail as well as durable goods reports brought about modest risk-off flows, further driving allocation into digital currencies like ETH. If today’s macro headline prints come in softer than expected, Ethereum can anticipate new demand as a hedge against policy risk as well as growth softness. Or else stronger data can cap upside in the short term—but with ETF strength as well as whale support in place, we anticipate ETH to remain solid even amidst constricting liquidity as well as general volatility in the market.
