Where Are Market Today?
European and U.S. futures are in a conservative tone at the onset of the trading day with investors taking a wait-and-see attitude ahead of Wednesday’s Federal Reserve decision on interest rates. S&P 500 futures were unchanged Monday evening after President Donald Trump’s nominee Stephen Miran was unanimously confirmed by the Senate to sit on the Federal Reserve, a day ahead of the central bank’s meeting to determine if it would reduce interest rates. Futures on the broad index and Nasdaq 100 futures each dipped 0.07%, and Dow Jones Industrial Average futures dropped 40 points or 0.09%. This conservative action is an indication of a cautious mood as the investor community processes recent economic data and anticipates possible policy shifts by the Fed.
On the other side of the Atlantic, European stock futures are down too. German DAX futures lost 0.3%, French CAC 40 futures declined 0.1%, and U.K. FTSE 100 futures lost 0.1%. This conservative sentiment in European-based markets is fueled by a mix of global economic worries, political tensions, and local issues damping sentiment. With the possibility of tightening liquidity and lingering fears of inflationary pressures, European markets are approaching the day with caution like the general tone in U.S. futures. The biggest market sentiment driver today is the Federal Reserve’s expected interest rate decision. As Fed funds futures are pricing in a 100% probability of at least a quarter-point off the rate, market participants are interested in how the central bank will react to prevailing economic conditions. Traders are eagerly listening to the subsequent press conference by Fed Chair Jerome Powell, where any signal of further rate reductions or even hawkish comments will either validate or spook markets. This choice will be likely to affect interest-rate sensitive areas like technology and real estate and may dictate investor sentiment in the near term.
Along with the Fed’s ruling today, market participants will be intently focused upon forthcoming economic indicators released today. Important indices such as retail sales, import prices, housing market information, and business inventories will deliver a greater sense of clarity on the economy’s well-being. Softened economic data will likely support bets on additional monetary easing, whereas robust higher-than-forecast numbers could support these bets and indicate greater caution on the Fed’s part. As these elements come to life, European and U.S. futures are in store to open flat to slightly in the red ahead of potentially volatile action as markets look ahead to this week’s crucial Fed meeting.
Major Index Performance through Tuesday, September 16, 2025
- S&P 500: Trading at 6,603.49, up 0.29% on the day.
- Nasdaq Composite: 22,243.20 now, up 0.46%, marking a gain in technology.
- Dow Jones Industrial Average: Higher by 0.03% to 45,848.39 on energy and financial sector advances.
- Russell 2000: No change at 2,147.63, down on the back of rate sensitivity in the.
The Magnificent Seven and the S&P 500 Index

The “Magnificent Seven”—Apple, Microsoft, Nvidia, Amazon, Meta, Alphabet, and Tesla—are showing signs of fatigue. A recent sector breakdown shows the group averaging a drawdown of over 18% from their recent highs, with Tesla and Meta leading the decline. This signals a valuation recalibration, especially in AI-driven growth stories that have run ahead of fundamentals. The S&P 500 remains under pressure as tech leadership wavers. While energy and industrials are offering some support, the index is unlikely to rally sustainably without renewed participation from its core mega-cap drivers.
Drivers Behind the Market Move – Tuesday, September 16, 2025
European and U.S. markets are in cautious optimism today amid a mix of expected central bank moves, geopolitical updates and econ data releases. S&P 500 futures held their ground Monday night after the Senate confirmed President Donald Trump’s nominee to join the Federal Reserve, Stephen Miran, a day ahead of when the central bank is to gather and discuss cutting rates. Futures on the broad-based S&P index and Nasdaq 100 futures each dipped 0.07%. Dow Jones Industrial Average futures dropped 40 points, or 0.09%. This muted action is in a wait-and-see mode as markets look ahead to the Fed’s policy moves.
1. Expectation of Federal Reserve’s Interest Rate Decision
Markets are in wait and watch mode ahead of Wednesday’s announcement by the Federal Reserve on interest rates. The Fed funds futures are now pricing in 100% chances of at least a quarter-point cut in the interest rate, CME’s FedWatch tracker reveals. Traders will closely observe the latter press conference by Fed Chair Jerome Powell to gauge signals on the direction of monetary policy in the weeks to come. The anticipated rate cut is having a bearing on market sentiment, and the chances of increased liquidity might be positive for risk assets. The move might be significant on rate-sensitive areas such as technology and real estate.
2. Geopolitics and Domestic Policy Developments
Recent comments by President Donald Trump have added a touch of unpredictability to the market. Trump’s statement about planning a “second kinetic strike” on narcoterrorists and Mexican drug cartels indicate an increased priority toward national security. His statement on investigating George Soros and taking presidential powers on tariffs indicate likely domestic policy moves. This could lead to added volatility as markets absorb the risk of increased geopolitical tensions and change in trade policy.
3. Economic Data Releases and Market Sentiment
Markets will be closely following today’s release of important economic data like retail sales, import prices, housing market data and business inventories. The information will provide an indication of how the economy is doing and could impact market speculation over the policy actions of the Fed. Weak economic figures will argue in favour of reducing interest rates while above-expected figures will spell safety and caution. The outcome of these data releases will be highly significant in deciding market mood and informing market participants’ actions.
Markets eagerly wait for these events and sentiment among investors is cautious and futures are indicating a flat to down open. The combination of impending central bank moves, political developments and economic announcements is in store for a very volatile trading session. Investors will be closely watching these parameters in a bid to discern the trend in the markets in days to come.
Digesting Economic Data
The Trump Tweets and Their Consequences
Recently, President Donald Trump has shaken up domestic and foreign markets with his comments on military action, national security, and economic policy. Specifically, Trump’s tweet to deliver a “second kinetic strike” at the narcoterrorists and drug cartels betrays an increased focus on national security. By saying these violent groups “pose a threat to U.S. national security, foreign policy, and crucial U.S. interests,” Trump is signaling the possibility of increased military action in areas like parts of South America. This could have dramatic geopolitical ramifications, with markets reacting to the possibility of increased military confrontations or disruptions in regions important to commerce and global security. The threat to U.S. interests and the overall foreign policy agenda may trigger volatility in energy markets, namely oil, because any sort of energy-producing region disruption may stimulate pricing fluctuations.
Another key part of Trump’s rhetoric is his remark about George Soros, implying a “RICO case” is possible. This would create the possibility of intensified examination of powerful players in world finance and could spread into international markets. The possibility of lawsuits in influential individuals often brings added regulatory uncertainty, and with the focal point on Soros, markets may read this as the possibility of greater political divisiveness or tighter financial regulation. Investors are often in search of stability, and steps towards politically-driven investigations or lawsuits to powerful players could bring uncertainty into market forces, specifically in areas related to financial regulation, cryptocurrency-based areas, and foreign commerce. Trump’s statement that “the president has the authority to regulate tariffs” directly relates to his trade and economic policy and possible actions on foreign relations or domestic economic scenarios. Since he has already levied tariffs on several countries, especially China, this statement implies the president might again utilize the policy on trade to affect foreign relations or domestic economic scenarios. Sensitivity to trade in market areas like agriculture, manufacturing, and tech shares may be impacted if Trump’s administration takes further action to increase tariffs. This would affect market sentiment worldwide because trade war usually causes supply chains to be disrupted, costs to escalate, and international trades to decline. Investors are likely to carefully observe all news on tariffs because tariffs tend to cause inflation pressures affecting anything from consumer products to energy prices.
Also, Trump’s statement on Chicago’s situation being “worse than Afghanistan” and military action in American cities like Memphis has undertones of domestic unrest. This rhetoric references the prevalent strains in certain U.S. cities and the threat of increased military action may have strong impacts on investor sentiment in urban areas and infrastructure spending. Additionally, comments by the White House on a “stopgap” solution imply delays or interruptions in the functioning of government and are likely to evoke the threat of a government shutdown or budget imbalances. The larger-picture implication from these political and military steps may impact U.S. markets since investor sentiment is an indication of broader political stability. Domestic policy uncertainty and potential security actions will likely keep markets on edge in particular in segments where government policies like defense, infrastructure and consumer goods are important.
Manufacturing Decline Raises Concerns Ahead of Fed Decision
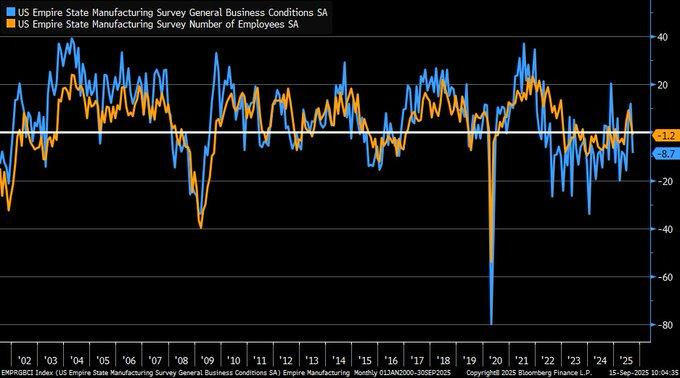
The September 2025 Empire State Manufacturing Index has issued a stark message to the U.S. economy by slipping to -8.7 levels way below the predicted +5. This steep factory activity contraction combined with a 20-point slump in new orders (-19.6) and shipment levels (-17.3) highlights widening vulnerabilities in the U.S. manufacturing space. The decline is an omen of bigger economic problems ahead with analysts keenly observing how these trends are likely to affect the Federal Reserve on September 17-18, 2025 in their decision to raise or maintain the interest rates.
The historical volatility in the Empire State Index is a cause for concern, even more so in light of its track record in the face of monetary tightening. The same 42.4-point decline in August 2022 amid the Fed tightening led to a sharp decline in manufacturing, exacerbated by a similar decline in world trade factors. Further contributing to the analysis is the continuation of tariff policies—initiated by the administration in 2025—potentially worsening the contraction in New York factory activity since greater tariffs drive up production and competitiveness costs on American manufacturers. This is in alignment with recent reports on the impact of trade tension on overall economic stability. Since National Bureau of Economic Research research reveals a 70% correlation between such manufacturing index declines and subsequent GDP declines, analysts are well-advised to be cautious. Previously, these indicators have been ahead of recessionary conditions by 6-12 months and so are a source of concern regarding the sustainability of recent market highs. As we move towards the meeting of the Fed, we would be monitoring further manufacturing data and shifts in trade policy. For the time being, stocks such as General Electric may be inexpensive given the pressures it is coming up against but will be equally well-rewarded if there are shifts in the structure of tariffs or policy in the short term.
Key Indicators That Will Dictate Market Mood
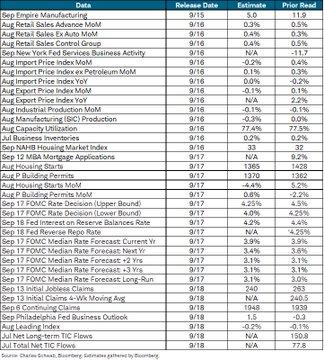
As we move into mid-September 2025, the economy is taking center stage with a series of critical data releases that will be informing market sentiment. The September survey drop in the Empire State Manufacturing Index to -8.7 reveals an unexpected New York factory downturn after several months of summer expansion. This unwelcome manufacturing decline and poor new orders and shipments may test the rosier market expectations driving recent bull runs. Investors will want to be aware of these trend developments since an ongoing manufacturing decline may be an omen of wider economic frailties to come.
Retail sales numbers on September 16 will be another key to watch. As traditionally contributing to around two-thirds of U.S. GDP, these numbers are key to assessing consumer spending health. A break from the forecast 0.3% expansion may sharply affect equity markets. Technical analysis has often recorded positive stock performances correlating with stronger-than-forecasts retail sales performances in the past. Retailers such as Target and Walmart may witness significant price action on the outcome, and analysts will be keenly observing consumer behavior shifts affecting long-term growth trajectories. The FOMC rate decision on September 17 will be a market focal point. The Federal Reserve is likely to leave rates in the 4.25-4.5% range, marking a cautious approach given sustained inflationary fears and macroeconomic data. Residential data like the UK House Price Index (which increased 3.7% year-over-year) implies strength in property markets, but mini-caps might witness tighter funding pressures. As the Fed approaches the decision date, stocks like Homebuilders will be volatile depending on the central bank guidance and the overall market will be vigilant on Fed positions towards inflation and prospective rate reductions.
Fall in Housing Need Triggers Red Flags
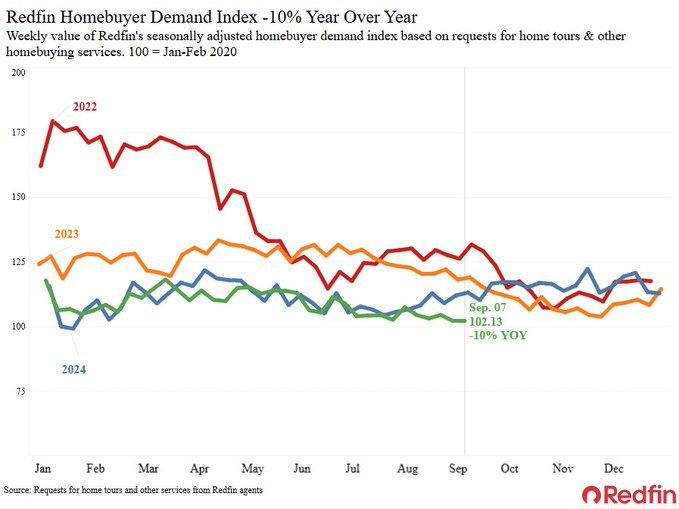
The Redfin Homebuyer Demand Index has fallen 10% year-over-year through September 2025, reflecting a steep decline in U.S. home demand. The decline is primarily blamed on higher mortgage rates and sustained affordability challenges, reflecting a decline in home tour and offer requests in 15 large metros. The seasonally adjusted data on a 2014 baseline reports a decline that is similar to earlier indications of U.S. housing market corrections. The trend to slow down has implications on the soundness of the housing market if rates maintain levels above 6%, as already high mortgage payments quell buying interest.
Historical analysis of the 2006-2010 housing crash reveals a pattern that may signal a potential correction. During that period, a similar decline in demand preceded falling median home prices and rising foreclosure rates, suggesting the current cooling could be an early warning for a broader downturn. If high interest rates persist, we may see further contraction in home sales, tightening affordability, and exacerbating existing economic vulnerabilities. Real estate investors should keep a close eye on price trends and inventory levels in key housing markets, as they could provide clues to the scale of potential future corrections. Compared to the U.S. real estate market on the world stage, the UAE offers a stark contrast as UAE residential sales increased by 23% in the first half of 2025. This increase is mainly due to stable real estate policies and cash-based market dynamics, shielding the market from the fluctuations experienced in mortgage-based markets like the U.S. There is a need for analysts to observe world policy directions and the effect of rising rates in the U.S. while making prospective real estate investment decisions. As U.S. housing experiences challenges, areas with policy stability may present less volatile areas of investment in the coming time.
Recurring Consumer Skepticism Despite Tariff Stressors
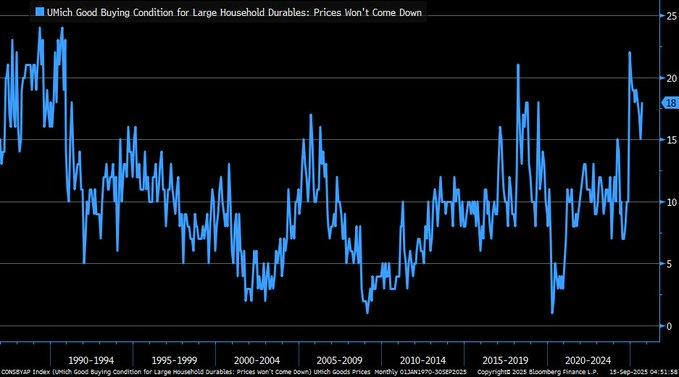
Updated data on the University of Michigan Index consumer expectations on prices of large household durable goods reveals a high in pessimism in the earlier periods of 2025 and consumer sentiment staying at highs despite taking a slight dip. The greater degree of pessimism appears to be associated with the 50% U.S. tariff on Chinese semiconductors in the earlier periods of 2025 addressed in the Federal Reserve real-time study on tariff effect. Price hikes induced by tariffs have had a significant effect on consumer expectations, particularly on durable goods such as electronics whose prices have risen by a total of 16.2% since 2020, Trace One estimates using an analysis of U.S. Bureau of Labor Statistic data. Consumers expect continued increases but the Federal Reserve study estimates tariff effect on final consumer prices could be overstated if substitution (such as to non-tariffed goods) is an option.
Regardless of the possibility of substitutability, consumer forecasts are still relatively unchanged. This implies the market is possibly insensitive to alternatives and prices may stay high unless tariffs are adjusted or market dynamics change. The strong forecasts of price increases are consistent with the continually rising durable goods prices, possibly compounded by low substitutability of consumer choices to less expensive alternatives. Consequently, companies in industries relying on durable goods are best positioned to prepare for sustained pressures on their costs, possibly affecting consumer discretionary shares in related ways such as to electronics and appliance dealers. On the world stage, rising trade tensions have accelerated since mid-2025, further solidifying consumer anxiety over sustained price pressures. Specifically, a 100% Chinese electric vehicle tariff and Chinese backlash in return might inject even greater supply-chain disruptions worldwide and affect consumer prices and market buoyancy. With evolving world trade policies in full swing, market players should be keenly attuned to possible secondary effects on market segments such as automotive manufacturing, electronics, and energy. Businesses exposed to volatility in tariffs should be revisited in terms of risk on the off-chance of further trade friction accelerating existing price problems.
Regional Patterns in Households and Price Growth
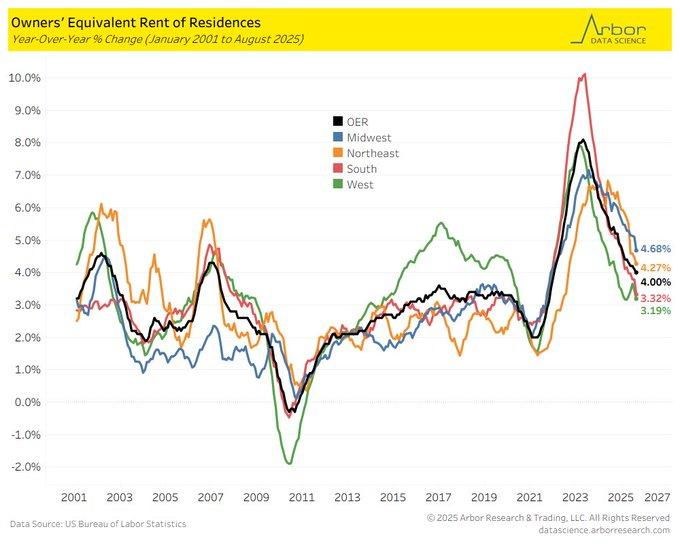
Up until August 2025, the Midwest owners’ equivalent rent (OER) has spiked by 4.6% compared to the same period in the previous year, well ahead of the West’s 1.3% rate. The steep Midwest increase is an indication of wider supply shortages, fueled by a 6.1% jump in single-family rentals in July 2025, according to CRE Daily. The spike is an explanation of rising demand for rentals, particularly in less developed parts of the nation, where institutional buying is fuelling pressure on space availability. The Midwest regional trend is in direct contrast to the steadied or even flattening markets in large urban centers. With rising owners’ equivalent rent (a key CPI component), this trend may test the story of spatially uniform inflation by highlighting inter-regional differences in housing costs.
As identified by a 2023 Federal Reserve report (FEDS Notes), shortages in housing are likely to escalate rent growth in non-urban areas like the Midwest, where affordability and in-migration pressures are inducing a compression in the space of rentals. The confluence of surges in institutional capital and flows of migration is fanning a wave of demand and driving up rents in the absence of sufficient stock to absorb. The Midwest dynamic bodes a long-lasting mismatch of housing supply and demand and suggests pressures on prices are likely to be sustained in both rents paid by renters and prices paid by homebuyers in the long term, specifically in areas with significant in-migration. Conversely, the West’s gradual OER expansion is associated with a 6.3% vacancy rate increase in Q1 2025, according to CRE Daily, indicating a possible market transition to renter dominance in the West. This is likely to be affected by an increase in build-to-rent units that are causing a stabilization in rentals. The East Coast is again somewhere in the middle of these dynamics, with innercities like New York and Boston still experiencing relatively stable OER expansion but still experiencing upward pressure in suburbs and newer rent markets. For analysts, real-time observation of regional movements in housing demand and supply will be important in discerning coming months’ possible opportunities and challenges.
Rising Unemployment Forecast Despite Labor Market Easing
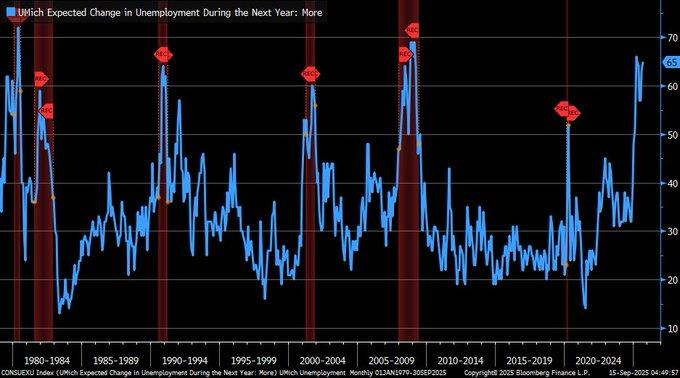
The recent University of Michigan (UMich) consumer surveys indicate a worrisome sudden spike in unemployment expectations through the coming year, with close to two-thirds of participants anticipating increased unemployment in September 2025. Previously, such negativity has led to impending economic downfalls, most famously in the 2008 global financial crisis when spikes in unemployment expectations preceeded widespread economic strain. The trend suggests increasing consumer anxiety over prospective employment security and is an indication the mood may be veering towards increased prudence while the underlying economic data is less clear-cut.
Yet examining the unemployment data in closer context presents a differing portrait. According to a 2023 National Bureau of Economic Research study, consumer sentiment overstates the probability of declines in the short term and is often fueled by media reports and views on shaky economy. The actual unemployment rate has even remained steadfast in the face of rising consumer pessimism. The elevated unemployment expectation may thus be based on perception and less on short-term economic reality. The report implies an overreaction on the part of consumers to fears of an impending decline and less to the true course of the present labor market. The recent rise in unemployment expectations is timed in parallel with labor market cooling signs such as a record reduction of 818,000 jobs in 2024 recorded by the Bureau of Labor Statistics. The reduction highlights underlying labor market vulnerabilities and pushes the Federal Reserve to contemplate rate reductions. The reductions like in the 1990s rate periods may either support the economy or even amplify vulnerabilities based on the overall macroeconomic environment. The analysts should look at the Federal Reserve’s coming choices and observe labor market metrics to determine if this negativity is an expression of real economic vulnerability or mostly consumer sentiment.
Downward Sloping Expectations of Consumers and their Implications on Economic Growth
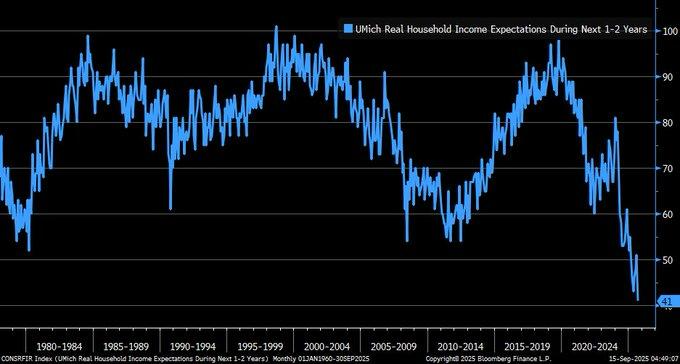
New University of Michigan data demonstrates a record low in American consumer optimism about real income gains in the coming 1-2 years. This steep decline reached a record low in September 2025. This massive decline is a clear indication of an increase in economic pessimism and might be fueled by sustained global trade tensions. The steep fall in consumer sentiment is a clear expression of rising anxiety in terms of economic stability as consumers understandably expect less income growth in the short term. This might have a widespread effect on consumer behavior and strain the idea of a strong economic recovery even further.
This decline in consumer sentiment is directly related to recent American tariff policy, as 60% of consumers brought up tariffs in the University of Michigan survey. The mutual tariff announcements by the U.S. in April-May 2025 have probably been key to the sentiment. Despite IMF-proposed global growth estimates pointing to 3.0-3.1% expansion in world GDP, these trade policies appeared to have taken a nearer impact on American consumer expectations over brighter global estimates. The growing uncertainty in trade might be stoking consumer anxiety over rising prices and declining income growth. More insight by the Federal Reserve Bank of New York in 2024 is that longer periods of negative income growth expectations may lead to a decline in consumer spending by 0.5-1 percentage point annually. With pessimistic expectations maintained over a long period, these may dampen economic recovery through the central role consumer spending plays in U.S. GDP growth. For market commentators, the trend may be an indication of possible negatives to be cautious on areas depending on discretionary consumer spend. With consumer sentiment affected by lingering tariffs and international trade disputes, consumer spending and sentiment will be important to monitor in months ahead to predict economic outcomes.
CPI lag and Residential market fluctuations
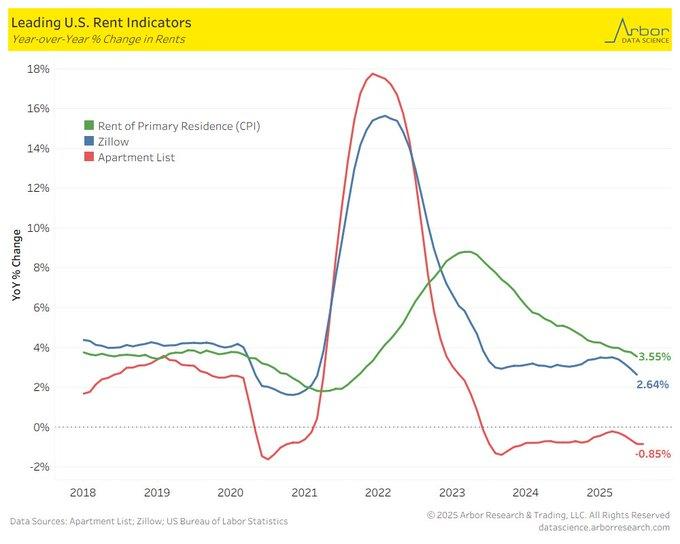
Recent data from Liz Ann Sonders highlights a significant lag in the Consumer Price Index (CPI) rent of primary residences, which consistently trails private market rent indices like Zillow and Apartment List. According to a 2021 Bureau of Labor Statistics (BLS) study, the CPI rent data relies on surveys that have a 6-12 month lag, explaining why it reports a 2.64% year-over-year decline, which contrasts with the -0.85% year-over-year decline shown by Apartment List. This discrepancy suggests a methodological delay in CPI’s ability to capture more immediate market trends, particularly in the volatile housing sector. As a result, CPI’s rent data often reflects outdated market conditions, raising questions about its reliability as a real-time inflation indicator.
The lag in CPI rent data reveals a larger trend in the housing market induced by rising interest rates since 2022. As mortgage affordability declines, consumers have increasingly become renters, initially contributing to rising rent inflation. Recent easing tendencies—visible in Zillow’s Observed Rent Index—also indicate a market correction, fueled by rising inventory in rentals. Specifically, a 37% Las Vegas housing inventory increase as of September 10, 2025 is an important signal of a possible oversupply in the space of rentals and could dampen price pressures in subsequent months. This transition represents an important inflection point in the housing market where rising inventory and easing demand might bring down slow rent growth or even rents, particularly in oversupply areas. The disparity between CPI rent data and real-time market information highlights the disadvantage of using CPI as a timely inflation signal, particularly in housing. A 2023 Federal Reserve paper argued against CPI’s housing segment for being below-proportionate to fast market movements and argued that real-time indices ought to be used by policymakers in making their decisions. As the market further fine-tunes itself, private sources such as Zillow and Apartment List will provide increasingly accurate real-time information on the conditions within the rental market, a better measure of the affordability of housing and general inflation movements.
Upcoming Economic Events
As we begin another important week in financial markets, a batch of important-economic data announcements will bring clarity and will likely drive investor sentiment. From significant labor market data to sales figures and German economic sentiment, these reports will bring new information into both American and worldwide economic well-being. The weeks ahead will be important in forming expectations for Federal Reserve policy, international trade flows, and inter-asset market directions. Below is a listing of key market events to watch and their likely effects on market behavior:
Average Earnings Index (3m/y
The Average Earnings Index offers a key insight into wage growth, which is directly related to inflation dynamics.
- If the actual is above market expectations, it would be an indication of strong wage growth, feeding fears of sustained high inflation. This could induce speculation that the Federal Reserve will have to continue its tough stand on interest rates, causing bond yields to climb by pushing the U.S. dollar higher and possibly precipitating an equity pullback on the back of rising expectations of greater borrowing costs.
- If the index is below market estimates, however, it will alleviate worries about inflation increases and provide greater latitude to the Federal Reserve to keep rates softer and longer. This could induce a risk-asset relief rally led by equities and curb bond yields on the back of reduced anticipation of rate hikes.
Claimant Count Change
Claimant Count Change is the change in the number of claimants to unemployment benefits and is used to gauge the strength of the labor market.
- A smaller-than-expected number would be positive and indicate a labor market remaining strong and an improving or sound macroeconomic environment with strong consumer spending prospects. If the claims decline or are smaller than expected, it could stir investor optimism in consumer-driven areas like housing, services, and specifically within the space of retail. However, an enduring performance in the labor market may merely foment worries over sustained wage pressures and may encourage the Federal Reserve to remain on a tightening trajectory.
- However, if the Claimant Count Change is larger than expected, an implication being that a greater number of claimants are emerging to claim unemployment benefits, it may be an indication of rising fragility in the labor market and ignite worries over a potential recession. This will likely induce a risk-off sentiment and encourage safe-haven purchases in U.S. government securities and in defensible spaces like healthcare, utilities, and consumer staples.
German ZEW Economic Sentiment
The ZEW Economic Sentiment tracker is a survey of investor sentiment in Germany and is a barometer of European Union-wide sentiment.
- The market is expecting a bigger-than-expected reading and a fall in sentiment to indicate optimism in Europe about short-term growth. The optimism could spill over to other parts of the world and signal to other markets that the European recovery is going well despite challenges in other parts of the world.
- A softer-than-expected print might signal an anemic European outlook and be negative for the euro and European shares. With the risk of easing global trade relations and lingering effects of policy uncertainty on risk appetite, the release in ZEW will be important in establishing the mood in European investors and the overall market sentiment.
Core Retail Sales m/m.
Core retail sales, excluding volatile automobile sales, is a key indicator of consumer spending, which represents a significant portion of U.S. GDP.
- A stronger-than-forecast figure would indicate robust consumer demand, suggesting that the economy remains healthy despite external pressures such as high interest rates. This could encourage optimism in consumer-focused sectors such as retail, tech, and discretionary spending. However, the flip side is that higher consumer spending could keep inflation elevated, making it more challenging for the Federal Reserve to ease monetary policy anytime soon.
- If core retail sales come in lower than expected, it would suggest a slowdown in consumer spending, potentially signaling weakness in the economy. Such a result could dampen investor sentiment, particularly in growth sectors, and could send investors flocking to defensive stocks or U.S. Treasuries in search of stability.
Retail Sales m/m
Like core sales in retail, the overall retail sales report is an important gauge of consumer behavior and the health of the economy.
- If retail sales are ahead of expectations, it would be a testament to the strength of the U.S. consumer and imply the overall economy is still solid. This would be positive for sentiment in cyclical areas, particularly those with direct exposure to consumer spending such as retailers, restaurants, and leisure. A pleasant surprise would also breed speculation that the Federal Reserve will continue to tighten to support inflationary pressures and send bond yields higher and the U.S. dollar higher.
- If retail sales are short of expectations, however, it would be a signal consumers are retrenching on spending and could be a harbinger of an overall economic slowdown. This data would encourage a rotation toward defensive assets and areas such as utilities, healthcare, and consumer staples and pressure growth areas such as in technology and discretionary.
Overall, the coming week presents important data points that will likely have a large bearing on market sentiment. Traders will be closely scrutinizing these releases to make portfolio shifts depending on strength or weakness in key areas and determine if the U.S. economy has been able to sustain through the myriad challenges on the global front. With important implications on Federal Reserve policy meetings, world trade dynamics and consumer sentiment on the cards, market players may want to be on their guard and revise their expectations as these important economic indicators are presented.
Stock Market Performance
Indexes Recover Decisively Off April Lows but Participation Remains Patchy
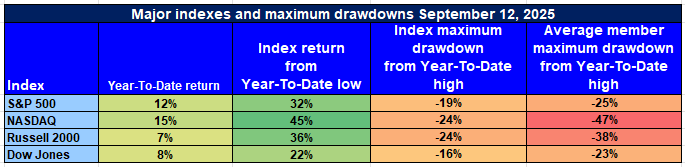
For Zaye Capital Markets, we are still closely following equity performance as the markets establish on the recovery of April 8th. With headline index returns appearing robust while underlying drawdowns and mean member losses indicating continued pressure on individual stocks, the disparity here is significant in suggesting continued fragility underlying the surface.
Following is our summary of recent performance on key U.S. indexes up to September 12th, 2025:
S&P 500: Strong Recovery, But Breadth Concerns Persist
YTD: +12% | -32% below low in April | -19% below YTD high | Avg. member: -25%
The S&P 500 has logged a robust 12% year-to-date gain and has rallied 32% off the lows in April. The 19% correction off the high and 25% member-average drop appear, though, and reflect the fact the gains are still very concentrated in a handful of big caps with broadened participation yet to be attained.
NASDAQ: Strong Rebound in Guise of Deeper Individual Losses
YTD: +15% | +45% low in April | vs. YTD high by -24% | Avg. member: -47%
NASDAQ leads performance by rising 15% this year and 45% off the low in April. The strength is dwarfed by the biggest member declines on average by index at 47%, pointing to vulnerabilities in the high growth and tech-intensive segments of the market.
Russell 2000: Small Caps Lag Despite Sharp Bounce
YTD: +7% | +36% below the low in April | -24% versus YTD high | Avg. member: -38% Small caps have come back 36% off lows in April but the Russell 2000 has only advanced 7% YTD. The selloff of 24% off the highs and an average stock decline of 38% are evidence of weak investor sentiment toward economically sensitive small names.
Dow Jones: Relative Stability with Lower Volatility
YTD: +8% | +22% down from April low | -16% down from YTD high | Avg. member: -23% The Dow Jones is relatively stable, having risen 8% this year and 22% since April. Its lesser drawdown of 16% and lowly average member loss of 23% reflect its defensive stance, though risk is present even in value arenas.
Zaye Capital Markets is still oriented towards market internals and likes stocks with solid fundamentals while keeping an eye on breadth and volatility to confirm evidence of a sustained bull trend.
Strongest Performing Sector in All These Indices
Communication Services Leads as Sector Topper in 2025
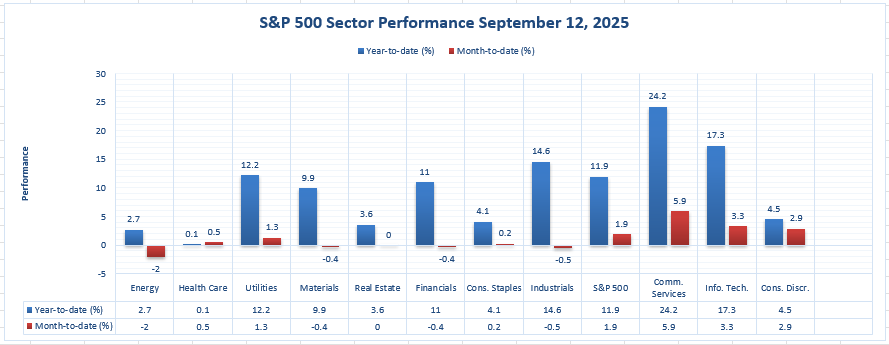
At Zaye Capital Markets, we monitor index-level movement plus sector leadership driving movement within the broader S&P 500. Through September 12th, 2025, by far the best sector on all time frames is Communication Services.
Leading by a YTD gain of 24.2%, Communication Services leads other sectors by virtue of strength in media and entertainment and certain mega-cap tech-adjacent names. This relative outperformance dwarves even the total S&P 500’s YTD gain of 11.9%.
Even on an MTD basis, Communication Services leads with a 5.9 percent advance again besting the comparable market’s 1.9 percent return within the same time. No other sector even approaches the twin leaders in both YTD and MTD.
Other big achievers are:
- Information Technology: +17.3% YTD | +.
- Industrials: +14.6% YTD | -0.5% MTD
- Utilities: +12.2% YTD | +1.3% MTD
Few are anywhere near the performance and consistency of Communication Services.
For Zaye Capital Markets, it is a positive signal towards investor demand for scalable platforms, repeat revenue streams, and digital infrastructure. We are selective on exposure to this space and exercise caution on valuation risk with rising concentration in leadership.
Earnings
Earnings Recap: September 15, 2025
- Dave & Buster’s Entertainment Inc. (NASDAQ: PLAY)
Dave & Buster’s reported Q2 2025 earnings with a notable decline in net income. The company posted a net income of $11.4 million, down from $40.3 million in the same quarter last year. Adjusted earnings were $14.1 million, or $0.40 per share, compared to $0.99 per share in Q2 2024. Revenue remained flat at $557.4 million. The decline in earnings was attributed to increased operating expenses and a challenging consumer environment.
- Radiant Logistics, Inc. (NYSE: RLGT)
Radiant Logistics reported a profit of $4.9 million for its fiscal fourth quarter, with adjusted earnings of $0.11 per share. Revenue for the quarter was $220.6 million, up from $206.03 million in the same period last year. The company highlighted a 24.4% increase in adjusted EBITDA, reaching $38.8 million for fiscal 2025, driven by strategic acquisitions and operational efficiencies.
- LightPath Technologies, Inc. (NASDAQ: LPTH)
LightPath Technologies is scheduled to report its Q4 2025 earnings on September 18, 2025. Analysts expect the company to post a loss of $0.03 per share on revenue of approximately $12.2 million. Investors will be keen to assess the company’s progress in its strategic initiatives, including the recent $8 million investment from Ondas Holdings and Unusual Machines to support its BlackDiamond™ Glass technology for drone applications.
- Ispire Technology Inc. (NASDAQ: ISPR)
Ispire Technology announced its Q4 and full-year 2025 earnings on September 15, 2025. The company reported a loss of $0.26 per share, missing the consensus estimate of a $0.14 loss. Revenue figures were not disclosed. Investors will be looking for insights into the company’s strategy and outlook during the upcoming conference call scheduled for September 16, 2025, at 8:00 AM ET.
Earnings Preview: September 16, 2025
- Ferguson Enterprises Inc. (NYSE: FERG)
Ferguson Enterprises is expected to report Q1 2025 earnings on September 16, 2025. Analysts forecast earnings per share (EPS) of $3.01, representing a 1.01% increase year-over-year. The company’s price-to-earnings (P/E) ratio is projected at 22.44, higher than the industry average of 16.60, indicating expectations of higher earnings growth compared to competitors.
- Rezolute, Inc. (NASDAQ: RZLT)
Rezolute is scheduled to release its Q4 2025 earnings on September 18, 2025. The company is expected to report a loss of $0.22 per share, with no significant change in quarterly revenue compared to the previous period. Investors will be looking for updates on the company’s progress in its clinical trials and any developments related to its rare disease treatments.
- LightPath Technologies, Inc. (NASDAQ: LPTH)
As mentioned earlier, LightPath Technologies is set to report its Q4 2025 earnings on September 18, 2025. Investors will be closely monitoring the company’s financial performance and any updates on its strategic initiatives, including its focus on defense and infrared markets and the impact of recent investments.
Stock Market Recap – September 16th, 2025
U.S. stock markets began the week on an optimistic but tentative basis as the market anticipates the meeting of the Federal Reserve on policy. The S&P 500 and Nasdaq Composite saw negligible gains while the Dow Jones Industrial Average held steady. The Russell 2000 remained in decline on market uncertainties.
Stock Prices
Economic Indicators and Geopolitics Developments
The market’s cautious tone is attributed to a combination of factors. The U.S. economy added only 73,000 jobs in July, significantly below expectations, raising concerns about labor market strength. Additionally, President Trump’s recent imposition of tariffs on imports from several countries has heightened trade tensions, contributing to market volatility. These developments have led to increased risk aversion among investors, impacting market performance.
Latest Stock News
Alphabet Inc. (GOOGL) achieved a milestone by hitting a $3 trillion market capitalization for the first time. The milestone has been driven by a rebound in optimism about artificial intelligence and an antitrust decision. The Class A shares of the company were up 3.8% to $250 and Class C shares were up 3.7% to $250.4, both at their highest. The stock has risen more than 32% this year to date and has surpassed the S&P 500’s 12.5% rise. The company has now become the third tech giant after other leaders Apple and Microsoft to achieve a valuation of $3 trillion as AI chipmaker Nvidia has a market cap of $1.2 trillion, further cementing the dominance of technology stocks in the current market. This surge highlights the continued strength of AI and digital infrastructure, particularly as these companies capitalize on growing demand for AI-driven products and services. The impressive valuation reflects a broader trend in tech stock growth, despite ongoing market concerns regarding overvaluation in some segments of the tech sector.
The Magnificent Seven and the S&P 500 Index
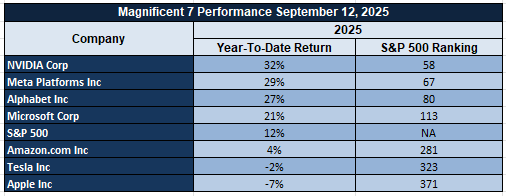
The “Magnificent Seven”—Apple, Microsoft, Nvidia, Amazon, Meta, Alphabet, and Tesla—are showing signs of fatigue. A recent sector breakdown shows the group averaging a drawdown of over 18% from their recent highs, with Tesla and Meta leading the decline. This signals a valuation recalibration, especially in AI-driven growth stories that have run ahead of fundamentals. The S&P 500 remains under pressure as tech leadership wavers. While energy and industrials are offering some support, the index is unlikely to rally sustainably without renewed participation from its core mega-cap drivers.
Major Index Performance through Tuesday, September 16, 2025
- S&P 500: Trading at 6,603.49, up 0.29% on the day.
- Nasdaq Composite: 22,243.20 now, up 0.46%, marking a gain in technology.
- Dow Jones Industrial Average: Higher by 0.03% to 45,848.39 on energy and financial sector advances.
- Russell 2000: No change at 2,147.63, down on the back of rate sensitivity in the.
Sector rotation and positioning are things that we watch very closely here as we are in earnings season. How market leaders are able to maintain their earnings push through tapering policy will determine where the wider equity markets are going into Q3.
Gold Price – Tuesday, September 16th 2025
As of today, gold prices are stable at around $3,679.04 per ounce and indicate a marginal drop of 0.01% compared to the earlier session. This level is close to the recent highs achieved in the earlier week, demonstrating the sustained strength in the market. The present-day price in the market signifies gold maintaining status as a strong safe-haven store as the investors are still trying to navigate through a highly uncertain world. There are several reasons backing this sustained interest in gold commodities, mainly in light of rising geopolitical tensions and economic uncertainties. Interestingly, the market is already preparing itself to face a rate-cut by the Federal Reserve and hence possibly add to gold’s non-yielding assets. As the political gridlock in the U.S. government persists with President Trump exercising greater authority on tariffs and military interventions, the geopolitical sentiment remains a dominant force behind safe-haven demand. Correspondingly, the on-going domestic challenges in Washington and even in Chicago added to the overall anxiety and are driving additional investors towards gold as a store of value. As the Fed’s rate-cut is impending in the latter part of the week, greater speculation prevails with gold possibly maintaining upward moves and potentially reaching the $4,000 mark in terms of an ounce, depending on how subsequent economic information and global events may trend. Recent economic data has only strengthened the case for gold’s continued rise. The University of Michigan’s Consumer Sentiment Index for September came in below expectations at 58.1, signaling weaker consumer confidence, while the Philadelphia Fed Manufacturing Index fell sharply to -12.4, indicating contraction in the manufacturing sector. These figures point to potential economic slowdown, with investors increasingly seeking the safety of gold as a hedge against uncertainty. Furthermore, today’s data on Average Earnings, Claimant Count Change, and Core Retail Sales are all under scrutiny for their potential to impact market sentiment. Lower-than-expected earnings growth or disappointing retail sales figures could intensify worries about the economy, leading to increased gold demand. Additionally, with inflation pressures still looming and the prospect of a dovish Federal Reserve, the opportunity cost of holding gold remains low, which will likely continue to attract investors. The combination of economic concerns, political instability, and an accommodating Fed has set the stage for gold to remain a favored asset, with its price likely to continue its upward trajectory as these dynamics evolve.
Oil Prices – Tuesday, September 16, 2025
As of today, Brent crude oil is valued at around $67.58 a barrel and West Texas Intermediate (WTI) is changing hands at around $63.45 a barrel, having recorded a slight gain compared to the earlier session. The movements come in the face of intensified geopolitical tensions and lingering fears of oil supply disruption. The oil market has been very responsive to supply risk in recent weeks, such as recent attacks on Russian refineries by drones and fears of disruptions in global oil flows. President Trump’s remarks calling on NATO countries to cease buying Russian oil have further added to the mix with the specter of extended sanctions. The geopolitical risk is maintaining oil prices at their present levels as market participants are fearful of possible supply reductions. In the meantime, the OPEC+ group, in response to market sentiment, has pledged to add to production quotas in an effort to add 137,000 barrels a day to output from October 2025. The effort is to add to global oil supply even though the International Energy Agency (IEA) has cautioned that the oil market will face an oversupply in 2025 by an estimated 2.7 million barrel a day. This will be exerting downward pressures on oil prices if demand fails to match expanded supplies and add another layer of complexity to the market’s short term prognosis. More recent economic data has again fueled the market’s cautious mood. The University of Michigan’s September Consumer Sentiment Index registered at 58.1, well below forecast, and so consumer confidence is again fragile. The Philadelphia Fed Manufacturing Index too fell sharply to -12.4, a signal of contraction in the manufacturing sector and a reason to question the overall robustness of the economy. These are signs of possible economic slow down and will encourage investors to look to safe-haven assets such as oil as a form of insurance in case of further market volatility. For the rest of the week to come, today’s purchasing data in the form of Average Earnings, Claimant Count Change, and Retail Sales will be crucial in forming market sentiment. If these reports indicate poorer-than-forecast performances, then oil will witness further price gains since investors may look to it to hedge their bets on economic insecurity. However, if the data is firmer than forecast, then pressure on oil prices may ease and the trend will be stabilization. With political tension, supply projections, and economy performance all inextricably linked, prices of oil will likely be volatile and investors will need to be highly responsive to these prime drivers to witness further market action.
Bitcoin prices – Tuesday, September 16th, 2025
Bitcoin (BTC) is now at around $115,137 USD, down by 0.21% from the earlier session. This is a spot of consolidation after recent gains saw Bitcoin just below the earlier high above $116,000 USD. Despite the very slight pullback, however, the cryptocurrency is still at high levels and buoyed by general market sentiment and rising institutional demand. Traders are closely observing the price moves in Bitcoin ahead of the Federal Reserve meeting decision on interest rates and how it is likely to influence investor sentiment. Technically, analysis reveals Bitcoin testing key supports in the zone around $113,000 to $114,000 USD and critical to maintaining positive sentiment. Further on-chain evidence reveals accumulation taking place and particularly by mid-sized players and institutions and bodes well in the medium term for prices in Bitcoin. Volatility is again at the very heart of the cryptocurrency market and as political risk and regulatory updates and macroeconomic data feed through to sentiment. Recent President Trump comments and U.S. economic updates have indirectly affected the price of Bitcoin too. Trump’s statements on military actions and a possible “stopgap” funding plan could lead to market-wide uncertainty and encourage some stakeholders to look to assets like Bitcoin to hedge their bets. On the regulatory side, key announcements by the SEC and CFTC on the alignment of crypto policies are having an effect on market sentiment too. The U.S. government’s consideration of using Bitcoin as a reserve and forming a strategic Bitcoin reserve to back it might further endorse the asset and encourage further institutional funds into the space. Meanwhile, worldwide fears of systemic risk—in exemplification by India’s reluctance to introduce a full crypto framework and France’s threat to block foreign crypto companies—are causing price volatility in Bitcoin. Nonetheless, in spite of regulatory issues, Bitcoin is still reaping the benefits of rising acceptance as a store of value and rising interest by both retail and institutional stakeholders. As the data on the economy by itself and key metrics like Average Earnings and Retail Sales keeps unfolding, the price of Bitcoin will be responsive to changing sentiment by investors and wider macroeconomic conditions.
ETH Prices – Tuesday, September 16, 2025
Ethereum (ETH) is currently trading at approximately $4,518.03 USD, marking a slight decline of 0.25% from the previous session. This price level reflects a period of consolidation following Ethereum’s recent surge, where it briefly exceeded $4,600 USD. Despite this minor dip, ETH remains within a strong range, bolstered by robust market sentiment and continued institutional interest. Over the past few weeks, ETH has been consistently supported by growing accumulation, particularly from mid-sized investors and institutional players. On-chain data reveals that large Ethereum holders are continuing to position themselves for long-term growth, with a clear trend toward strong accumulation at current levels. Additionally, Ethereum’s price movements are being closely monitored as market participants look to the upcoming Federal Reserve decision on interest rates. The outcome of this decision will play a crucial role in shaping broader investor sentiment, especially for risk assets like cryptocurrencies. Ethereum has been testing key support levels between $4,490–$4,440 USD, with these levels serving as critical markers to maintain bullish momentum in the short term. As always, Ethereum remains vulnerable to volatility, driven by geopolitical developments, regulatory news, and broader economic conditions that affect investor confidence across markets.
Ethereum’s price action is also heavily influenced by recent developments among whales and institutional interest. Notably, a prominent Satoshi-era Bitcoin whale executed a massive swap, converting nearly $4 billion worth of Bitcoin to Ethereum. This shift in asset allocation has sparked optimism in the Ethereum market, as it signals increasing confidence from large holders. This whale activity is fueling bullish sentiment, with market observers anticipating significant gains in the third quarter of 2025. Furthermore, institutional inflows into Ethereum have been strong, especially through Ethereum-based ETFs, with Fidelity’s FETH ETF seeing a staggering $315 million in investments. These inflows underscore growing institutional confidence in Ethereum, particularly as it continues to benefit from increased exposure in the ETF market. However, recent economic data has weighed on overall sentiment. The University of Michigan’s Consumer Sentiment Index for September showed a notable dip to 58.1, far below expectations, indicating weaker consumer confidence. Along with a sharp drop in the Philadelphia Fed Manufacturing Index, these figures suggest potential economic slowdown, which could trigger a flight to safer assets like ETH. Today’s upcoming data on Average Earnings, Claimant Count Change, and Retail Sales will be critical in determining whether this cautious sentiment continues. If these reports come in weaker than expected, ETH may continue to see price increases as investors look to hedge against economic uncertainty. On the other hand, stronger-than-expected data could help stabilize Ethereum’s price by easing broader market concerns.
