Where Are Markets Today?
US and European equity futures are opening the day in the green, echoing tentative optimism following the first interest-rate cut of the year by the Federal Reserve. The Fed cut its benchmark by 25 basis points to 4.00%–4.25%, describing the move as a “risk-management cut” to counteract declining labour market indicators without relinquishing control of inflation. S&P 500, Nasdaq-100, and Dow Jones futures are up by about +0.4% to +0.7% as of this morning, while European markets are similarly modestly in the green. Market participants are trying to reconcile the Fed’s assurances that more cuts are likely later in the year with the reality that inflation remains sticky enough to call into question policymakers’ aggressiveness in the end.
The initial reason for higher futures is found in moving-rate expectations. Following the Fed decision, interest-rate futures traded in above 90% odds of another reduction at the October meeting, implying that markets expect the central bank to be pushed into a more dovish policy as labor markets deteriorate. Recent indicators, such as weakness in U.S. housing permits combined with a recovery in unemployment claims, has underpinned that theme. The news diminishes short-term recession risk while bolstering the idea that monetary policy will be biased toward easing, boosting equity sentiment in the United States and Europe. The second reason stems from recent economic releases and commodity flows. A sharper-than-expected drawdown in U.S. crude inventories, paired with slightly better industrial output numbers, pointed to some resilience beneath the surface. Yet the slowdown in residential construction and regional employment indices signaled broader caution. Taken together, these data supported futures markets: demand concerns keep inflation fears in check, while supply-side tightness argues for more policy support. European traders, meanwhile, responded to the Fed’s actions as a relief valve for global liquidity conditions, although the European Central Bank is expected to remain measured given persistent eurozone inflation.
Finally, geopolitical and policy developments continue to weigh on sentiment but also reinforce the case for safe entry into risk assets. With conflicts in Gaza and Ukraine still unresolved and U.S.–China trade tensions resurfacing, investors are acutely aware of downside risks. Yet the Fed’s decision and broader expectations for central bank accommodation provide a cushion, helping futures maintain a positive bias. At Zaye Capital Markets, we see the current move in futures as reflective of a market that is leaning cautiously risk-on—optimistic that policy support will stabilize growth, but fully aware that surprises in upcoming inflation or labor data could reverse gains quickly.
Major Index Performance as of early Thursday, September 18, 2025
- Nasdaq Composite: trading at ~22,261.33, off by approximately 0.3%.
- S&P 500: around 6,600.35, down about 0.1%.
- Russell 2000: modest gain of ~0.2%.
- Dow Jones Industrial Average: stood at ~46,018.32, up ~0.6%.
The Magnificent Seven and the S&P 500

The “Magnificent Seven”—Apple, Microsoft, Nvidia, Amazon, Meta, Alphabet, and Tesla—are showing signs of fatigue. Collectively, the group is averaging drawdowns of over 18% from recent highs, with Tesla and Meta leading the pullback. This valuation reset highlights that AI-driven growth narratives have stretched ahead of fundamentals. The S&P 500 is struggling to gain traction without their leadership, with sectors like energy and industrials offering some support but lacking the weight to carry the market alone. Sustained upside will likely require renewed strength in these core megacap drivers.
Drivers Behind the Market Move
- Fed’s Interest-Rate Reduction & Pressure from Trump
The Federal Reserve’s first rate cut of the year (-25 bps to 4.00-4.25%) is a primary catalyst. Markets are interpreting this move—along with Chairman Powell’s “risk-management cut” framing—as a shift toward accommodating weaker labour market signals while still watching inflation closely. Meanwhile, internal pressure is growing: Stephen Miran dissented for a steeper cut, and Trump has publicly pushed for more aggressive easing. These mixed messages matter. Investors are now trying to assess how much more easing the Fed will deliver, and how fast, which is driving futures higher and encouraging risk assets, particularly in the U.S.
- Economic Softness & Anticipation of Key Data
Recent US data—in rising unemployment claims, weaker industrial/manufacturing readings, and poor starts for housing—has elicited fears of easing demand. That underpins expectations that economic growth is losing momentum and increases the stakes for coming US labour data and the Philly Fed survey of US manufacturing. In Europe, mixed inflation, divergent growth within countries, and policy drift (caution from the ECB) are sources of market edginess. Speculators are positioning before these releases, assuming that weaker numbers will spur central banks to looser monetary policy and thus support equities, but stronger data may inspire reversals.
- Political & Regulatory Risk Gaining Relevance
Trump’s wider agenda—from pressing executive orders against political violence and hate speech, to criticism of the independence of the Fed and intimations of intervention in the functioning of regulatory bodies—poses another risk. Market sensibility to even the idea of weakening the independence of the central bank can lift long-term yields even as short-term rates drop. Similarly, trade-/risk-geo-political concern (e.g., the US–China tech disagreements, and global conflict in Gaza/Ukraine) is putting pressure on industries connected to global supply chains and tech trade. It all creates uncertainty that pushes investors to safer havens or at least decreases exposure, tempering how far markets can go up even with favorable data.
At Zaye Capital Markets, we see these three forces—monetary policy shifts, economic data surprises, and political/regulatory risk—as the primary triad currently driving market behavior. They explain both the modest upside in U.S. and European futures and the caution in valuations. We will be watching today’s unemployment, Philly Fed, and Bank of England moves closely for confirmation of trend direction.
Digesting Economic Data
Trump Tweets and Their Consequences
President Trump’s latest spate of statements is representative of the broad-based nature of his political, economic, and geopolitical agenda, all of which hold important market and sentiment implications. Stateside, the White House is drafting an executive order for political violence and hate speech, underscoring increased fears of social instability going into a rancorous election period. Designating Antifa a “major terrorist organization” holds out the potential to raise the stakes for law-and-order policies and generate a scenario in which investors begin to price in the possibility of social unrest or political deadlock. Both of these elements serve to inject uncertainty, often making for favorable conditions for safe-haven assets like gold, US Treasuries, even cryptocurrencies like Bitcoin, as policy turbulence hedges.
Globally, Trump’s return to the United Nations during the raging conflict in Gaza and Ukraine is another sign of increased diplomatic activity at a moment when global stability is precarious. His meetings at Windsor Castle with King Charles are also of symbolic significance, showing attempts at bolstering transatlantic cooperation despite ongoing geopolitics tensions. Market analysts note that fresh US activity in the global spotlight can change the equation surrounding energy, defense, and currency markets if the administration assumes tougher conflict resolution stands or puts pressure upon allies to take firmer stances. Those actions could boost volatility within energy-related goods like oil and natural gases due to their sensitivity to geopolitics outbursts. Economically, Navarro’s scathing criticism of Federal Reserve policy—demanding an immediate 50-basis-point reduction and another at the next meeting—showcases pressure from within the Trump circle for more assertive monetary easing. Though Trump himself has reaffirmed that the Fed needs to be independent, these divergent tones reflect the internal conflict: the need for reduced borrowing costs to boost growth, versus the Fed’s reserve in calibrating inflation risk. Remarks by prominent financial leaders such as Jamie Dimon and Brian Moynihan, who emphasize independence and inflation concern, affirm the precarious balance the Fed is in. For markets, it creates the likelihood of continued volatility in rates, as investors find it difficult to balance political pressure against central bank independence.
Lastly, Trump’s focus on trade and technology relationships is once again a continued theme. His government’s characterizing China’s aggression against Nvidia as counterproductive is an indication of willingness to hold fast to a tough approach to US–China economic relationships. For stocks, particularly in the semiconductor and artificial intelligence space, it introduces risk as well as opportunity: stocks could be buffeted in the short term by tense trade relationships, yet the longer-term requirement for supply chain autonomy and domestic investment could be a source of structural support. In total, Trump’s latest series of statements builds out into a complicated pattern of forces—entangling domestic political stress, foreign diplomacy, monetary policy stress, and global trade rivalry—that collectively reinforce the uncertain yet opportunity-filled world markets must accommodate.
ISM Indicator Awakens Inflation Fears
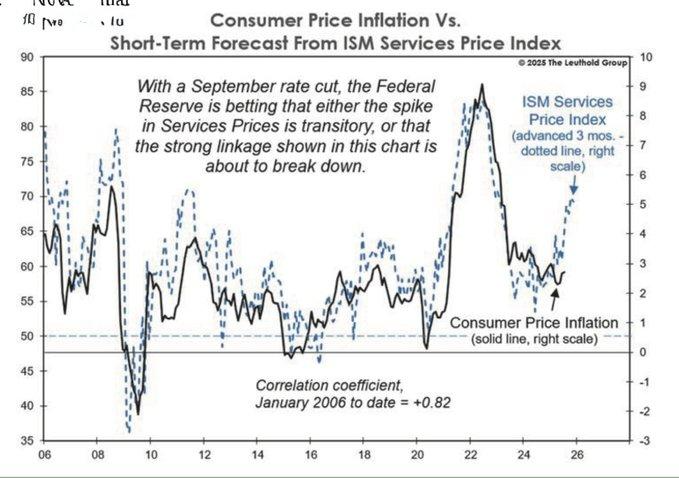
We at Zaye Capital Markets carefully considered the recent ISM Services Index surge—from July’s 50.1 to August 2025’s 52.0—once combined with past correlations between the ISM Services Price Index and wider consumer price inflation, sounding alarms of potential re-accelerating inflation. The +0.82 strength of the correlation from January 2008 onward suggests that services sector price pressures will likely feed through to headline inflation measures. That surge is a pointed challenge to recent monetary easing moves, particularly the 25-basis-point interest rate cut passed on September 17.
Recent months’ inflation readings indicate CPI is at plateau year over year (e.g. ~3.8% in the UK) despite indexes of prices for inputs and services moving higher. If inflation is stickier than expected, there may develop a substantive divergence between central bank forward-looking commentary and realized inflation paths. As inflation expectations change, that will feed into interest rate expectations. As of today, some policymakers see the federal funds rate staying in or moving to 3.50%-3.75% by year’s end—but surging costs from services may require a change of mind. From an equity viewpoint, the inflation picture that is portrayed by these ISM indicators is that there are stocks that are under‐valued and potentially ripe for investors. Specifically, stocks from industries with good consumer services exposure—particularly those that possess price leverage (e.g. utilities, health care, selected retail)—potentially hold upside for investors if inflation stays higher. On the flipside, those industries that come with tight margins and cannot easily pass through input‐cost inflation need to be carefully considered. It would be important for analysts to monitor coming CPI releases, the next ISM Services Prices sub‐index, and corporate third‐quarter corporate earnings guidance for margin stress as early indicators of inflation’s trajectory.
Fed’s Rate Reduction Hints at Labor Market Worry
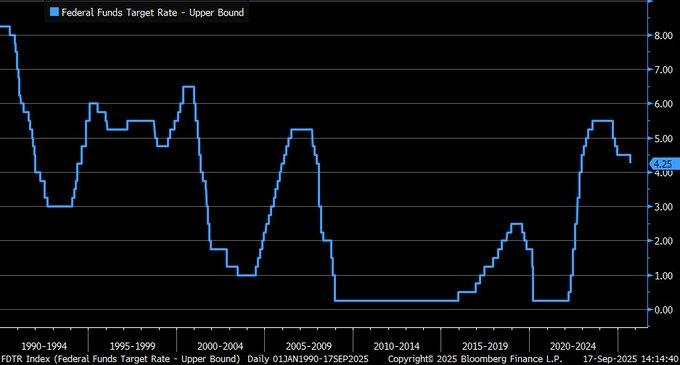
We at Zaye Capital Markets observe the Federal Reserve’s September 17, 2025 decision to cut the federal funds target rate upper bound to 4.25%, the first reduction since December. It was accompanied by forecasts of two more quarter-point cuts this year, signaling increased concern from the central bank over labor markets. Slower job growth, increased unemployment, and declining average hours of work all contributed to increased fears that employment risks are rising. One dissent was noted as Governor Stephen Miran preferred a steeper 50-basis-point reduction, reflecting internal conflict over how quickly to respond to these developments.
Our reading is that the Fed is adjusting its policy tack, placing relatively more emphasis upon employment’s downside risks rather than underlying, albeit moderating, inflation forces. Though inflation is still higher than target, policymakers seem poised to accept stickier prices for extended periods if doing so stabilizes the labor market. It’s all quite consistent with past tendencies of post-2008 cycle rates cuts, when cuts came relatively gradually under uncertainty over world anchors and financial conditions.
From an equity standpoint, the policy change creates opportunities in financials, especially banks, that are underpriced in our view. Softer rates easing pressure in funding costs and potentially boosting credit demand, selected banks with healthy balance sheets will gain. Otherwise, other sectors that are sensitive to financing costs, including utilities and real estate, can see profit margins diluted unless inflation does soften as projected. Labor market readings, inflation sentiment, and the Fed’s adjusted forecasts of rates need to be watched carefully by analysts to see if that dovish easing trajectory can maintain growth without sparking price pressures.
Revisions to GDP Reflect Cautious Optimism
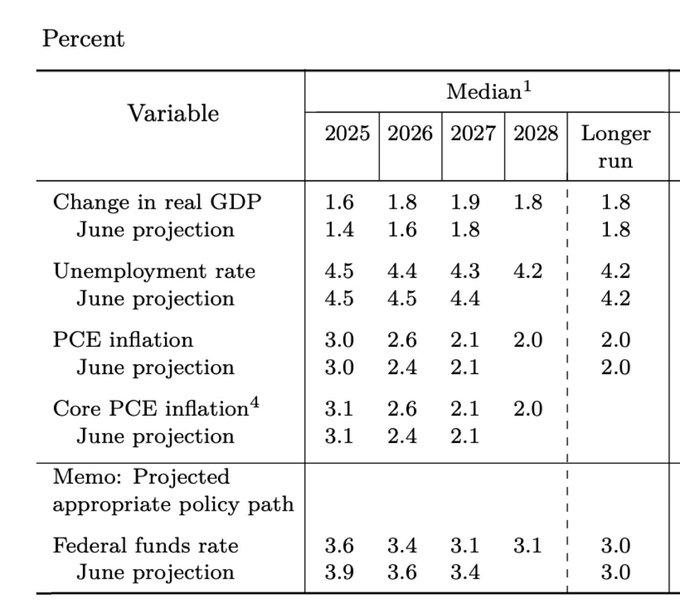
We see that the Federal Open Market Committee has revised its real GDP growth outlook for 2025 slightly higher, to 1.8% from 1.6%, with unemployment predictions largely unchanged at 4.2% to 4.5%. The revision is sign of cautious optimism, and that policymakers feel they can see enough strength within the US economy to hold up much stronger growth despite ongoing global uncertainty. Consistent unemployment estimates reinforce the picture that the labour market, even losing steam, is fortified enough to underpin consumer demand.
Nonetheless, history cautions against placing too much hope in such stability. Historical data reveal that forecasts always underpredicted volatility—most significantly in 2020, when GDP estimates deviated from reality by over 10 percentage points. The latest revision may do the same for risks associated with bilateral trade tensions, tariffs, and changing supply-chain configurations. External shocks are again a compelling wild card, by which even slight disruptions could change growth pathways much more quickly than forecasts usually anticipate.
Examining inflation dynamics further, core PCE inflation forecasts stay in the 2.0% to 2.6% range up to 2025–2028. However, supply chain normalization has materially lowered inflation persistence, according to evidence. If trade disruptions further dissipate, inflation can moderate more quickly than anticipated, boosting margins for businesses with global sourcing risks. In such a backdrop, industrials and selected multinational food and consumer businesses look undervalued, for their potential profits could gain from less cumbersome global logistics and lowered inputs costs. Market analysts should monitor trade flows data, shipping rates of containers, and supply chain stress indexes vigilantly to anticipate how external forces can prove correct—or wrong—even current inflation and growth estimates.
Treasury Yields Reflect Fears of Slowing
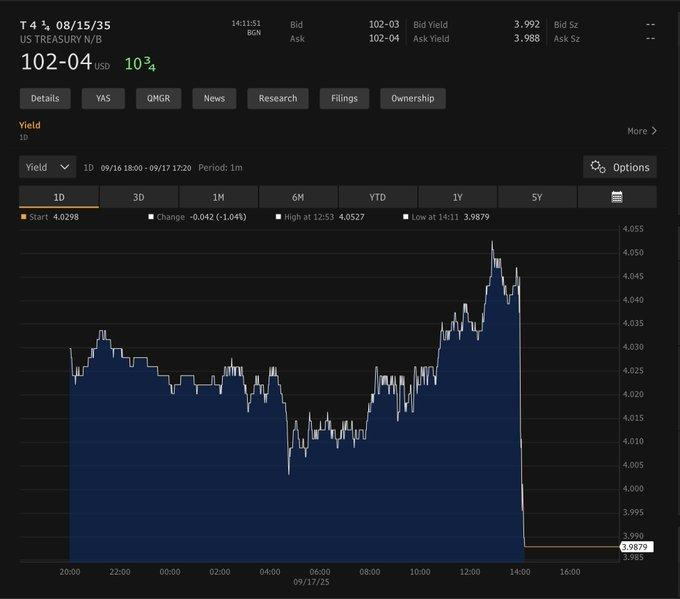
We at Zaye Capital Markets point out that the 10-year US Treasury yield dropped below 4% on September 17, 2025, straight after the Federal Reserve reduced its benchmark by 25 basis points to 4.00%–4.25%. The yield shift was due to investors anxious over weakening labour market data released during the first part of the month and supported forecasts that another easing is coming. The response is the opposite of September 2024, when the yield increased following a cut, and it highlights how sentiment is now shifting to price in risks of economic slowdown over inflation fears.
Historical analysis corroborates that interpretation. An extensive investigation of yield behavior reveals that precipitous decreases in long-term rates after Fed reductions have preceded sharply higher recession odds in about 70% of preceding instances. Coupled with the Fed’s own signal of “downside risks to employment,” the current reduction indicates bond markets becoming increasingly doubtful of continued growth. Volatility was nonetheless prominent as yields snapped back to 4.07% within hours, echoing rates’ hypersensitivity to intraday flows and algorithmic positioning.
For equity investors, defensive sectors such as consumer staples and utilities appear cheap relative to today’s environment. These sectors hold up better when bond markets price higher risks of recession, especially when yields dip appreciably. Key things to watch over the coming days are Treasury auctions coming up, moves in rate futures, and volatility measures like the MOVE index, as they will determine whether the decline in yields is just transitory dislocation or something more sustainable yet pointing to slower economic velocity.
Housing Market Stalls Despite Fed Rate Cuts
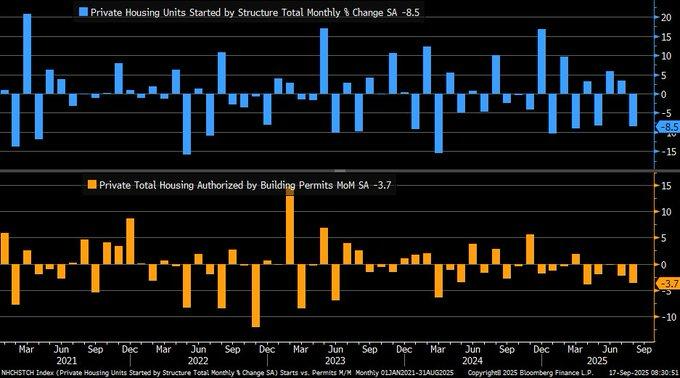
We at Zaye Capital Markets point out that U.S. housing starts declined 8.5% in August 2025, and permits for building declined 3.7%, sharply weaker than projected. The magnitude of the fall is bad news for residential building even as the country has been experiencing chronic housing shortage—roughly almost two million units annually. It reveals a fundamental disconnect: structural under-supply is in existence, yet builders are retreat-ing due to sluggish demand, higher costs, and less favorable financing.
Federal Reserve’s 25-basis-point September 17 interest rate cut was spurred, in part, to encourage housing through softer borrowing costs and employment market stability. But history is the warning—rate cuts in a vacuum haven’t consistently yielded sustainable recovery of housing demand when affordability is maintained under pressure. Higher costs of construction, wage-price inflation, and uncertainty among consumers may maintain stress on new construction even if mortgaging costs ease by incremental amounts. It is doubtful that monetary policy can profoundly remedy structural housing imbalances without offsetting fiscal or regulatory support. Regionally, single-family starts dropped 7% and multifamily fell barely 12% during the quarter, reflecting over supply in selectively chosen local markets and flagging buyer interest. Building inventories, approaching totals last seen before the 2007 housing downturn, make the outlook all the more challenging. From an equity perspective, we view homebuilders and building products firms as undervalued against long-term housing demand fundamentals. While near-term headwinds may stress margins, firms with favorable land banks, productive cost structures, and exposure to relatively resilient regional markets can take advantage once affordability stabilizes and latent demand returns. Trends in the mortgage rate, permit data for unsold inventory, and forward-looking approvals of permits are leading indicators that need to be watched keenly to determine whether housing can swing toward recovery.
Increasing Insurance Cost Betrays Climate Risks
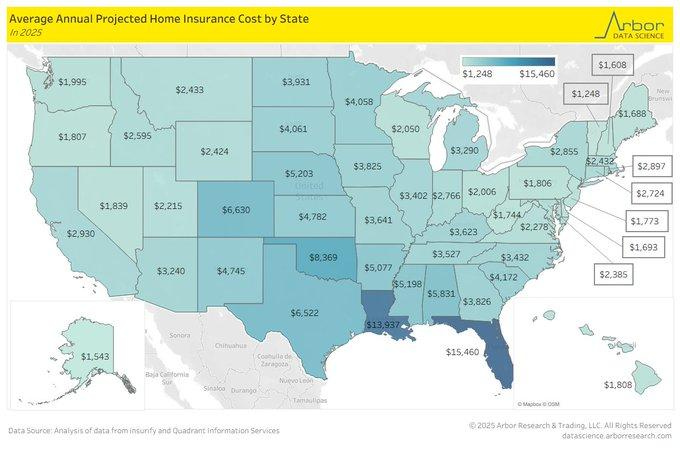
We at Zaye Capital Markets observe that housing affordability is being pushed even further by a spike in home insurance premiums, especially in climate-exposed areas. Florida’s $15,460 average annual price tag for 2025 is a reflection of the accelerating hurricane cycle, with ocean heating responsible for increasing the occurrence of hurricanes by 50% since 1980. That enduring risk is compelling insurers to deliver higher costs for reinsurance and claims, redesiging affordability even for families with fixed mortgage rates.
Louisiana is next, with annual premiums projected at $13,397, reflecting its double exposure to hurricane and inland floods. An additional 25% of exposure over the next ten years due to subsidence of the land and sea level rise demonstrates that climate effects are not constant but superimposed over various hazards. These make older models of insurance pricing, which relied on assumptions of cyclical rather than structure-intensifying weather risk, unsuitable. It is a warning to policymakers and markets that the cost of houses will be more determined by climate adaptation as much as by interest rates or trends in construction. Even in Oklahoma, whose tornado activity has reached stability, homeowners are paying premiums up to $8,369 annually—higher due to hail and wind damage delivering over $1 billion every year in insured loses. That means secondary perils are becoming important in regional housing risk analysis. From an equity perspective, property reinsurers and insurers that possess healthy capital cushions and diversified risk pools appear underpriced, owing to the possibility of repricing risk forcefully in affected markets. Regional lenders and homebuilders that are concentrated within higher-exposure states, conversely, can be subject to valuation stress as higher costs of insurance reduce affordability and demand. Climate-risk pricing, costs of reinsurance, and adaptation steps from regulation should be monitored by analysts as leading indicators of the housing-finance nexus.
Indexes of Jobs Predict Downside Risk
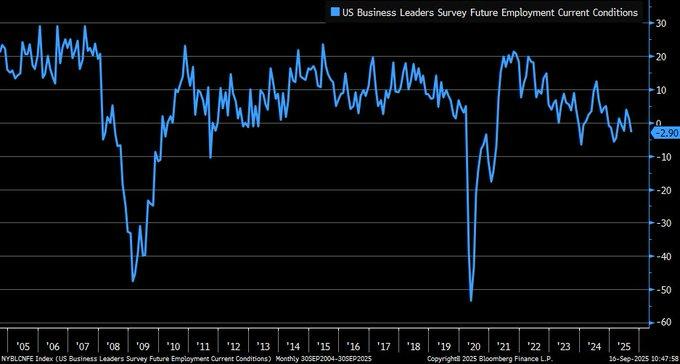
We observe at Zaye Capital Markets that the Future Employment Current Conditions index of the US Business Leaders Survey has relapsed into negative in September 2025, bringing to an end its fleeting recovery from earlier during the year. The sharp decline is illustrative of intensifying caution by business leaders whose employment outlook has deteriorated from mid-2022. The broader New York Fed Weekly Economic Index that incorporates real-time labour, production, and consumption indicators has also cooled off in similar fashion—suggesting that the script of the rebound being powered by services is losing steam.
Historical precedents render this development particularly alarming. Lasting decreases in employment indexes in the past have accompanied recessions, such as during the 2008 financial disaster, when labor market sluggishness forecast wider systemic strain. Historical evidence repeatedly reveals that when companies reduce recruitment, consumer sentiment and consumption tend to follow less within six to twelve months. Though the Federal Reserve’s latest interest rate cuts aim to blunt employment risk, it is unclear if monetary easing by itself can balance fading sentiment among businesses.
From the equity value perspective, labor-intensive service firms and small-cap companies look vulnerable, with many of them still above fair value due to the increasing risk of margin compression and limited flexibility to hire. Companies with diversified revenue streams, adoption of automations, or lean cost structures could be better off. In our view, certain technology and business services firms with durable productivity leadership are undervalued today given their ability to offset labor deficiencies. Regional employment surveys, plans for small business hirings, and wage cost measures should be watched by analysts as the leading indicators of whether this labor market contraction develops into the wider recessionary cycle.
Spending by Consumers Defies Labor Market Weaknesses
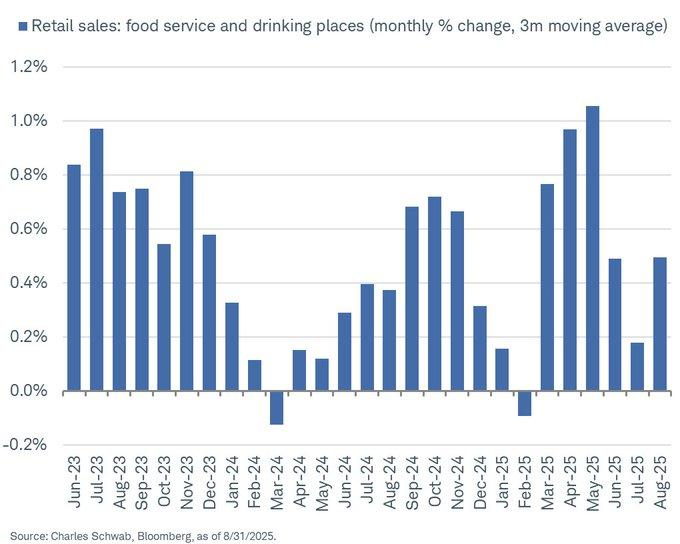
We at Zaye Capital Markets report that retail sales of food services and drinking establishments increased by 1.0% on a 3-month moving average during August 2025, year-over-year growth extending to 6.5%. That strength is reflective of persistent consumer appetite, especially in discretionary products sectors, even despite wider indications of economic cooling. It is reflective of households’ continued appetite for spending on experiences despite deterioration in the labor market. Such forces are significant in that they deviate from standard cyclical precedents, in that outlays for dining and recreation tend to slow in conjunction with unemployment’s surge.
Historical evidence shows that contractions in employment usually weigh heavily on consumer outlays, yet the current uptick may reflect pent-up demand from prior restraint or a shift in consumer preferences toward services. Adjusted for inflation, restaurant sales grew by 2.5%, reinforcing the view that spending is not merely nominal but real, reflecting sustained demand. This resilience complicates the economic outlook: while weakening job data calls for caution, robust service spending provides a buffer against sharper slowdowns, delaying the onset of a broader downturn.
From an equity standpoint, restaurant groups, hospitality, and certain consumer discretionary companies are undervalued against such spending behavior. Those businesses that enjoy good pricing power, diversified supply chains, and urban dining markets exposure stand to gain as consumers switch to services from goods. The coming retail sales releases, real wage increases, and sentiment surveys of the services industry are important for analysts to watch to see if such strength is sustainable and not just release of build-up of pent-up purchasing.
Industrial Output Slows While Divergent Global Trends Continue
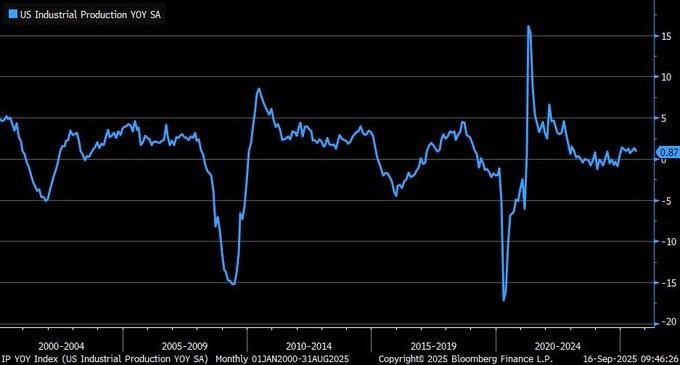
We at Zaye Capital Markets observe that US industrial production growth slowed to +0.87% year-to-date in August 2025 from a sharper 0.4% July fall, registering only a modest 0.1% month-to-month increase. The release indicates stabilization at a muted rate, reinforcing continued headwinds for manufacturing activity. Sector breakdown shows mixed results, with motor vehicle output increasing by 2.6%, yet more encompassing groups including machinery and consumer durables staying sluggish. It is the unevenness of this picture that again shows the volatility of industrial demand despite normalized supply chains by comparison to previous years.
The international context draws a more nuanced picture. Industrial output in Malaysia accelerated surprisingly in the latest report, implying that emerging markets are gaining from diversifying supply chains and shifting trade flows. For the United States, these divergent trends may be problematic: softer domestic strength may open the door for imports to take share, and exporter woes from dull foreign appetite if world growth stays patchy. These forces are relevant for trade balances and may influence the outlook for U.S. manufacturing competitiveness into 2026.
From an equity perspective, selected exporters and industrials appear undervalued, particularly those with favorable exposure to resilient niches like autos, aerospace, and value-heavy capital goods. Commodity-linked industrials and those significantly relying on world demand may lose out if divergence of views between the United States and Europe persists. Revisions to industry data later during the year 2025 may alter rates of growth by 1–2 percentage points and thus analysts should be prudent with numbers for the moment. Closely following world industrial surveys, EU/EMEA manufacturing data, and trade flow reports due later during the year will be crucial to see if the industry in the United States stabilizes or slides into a softer, longer cycle.
Upcoming Economic Events
As another pivotal period looms for world markets, investors are bracing for another raft of economic releases that may redefine outlooks for growth, inflation, and monetary policy by both sides of the Atlantic. The highlight for the day comes from the U.K. in the release of the Monetary Policy Summary from the Bank of England together with its rate vote breakdown and decision for the Official Bank Rate. Meanwhile, the focus is on the States for unemployment claims and regional manufacturing conditions. Combined, they give us some of the latest clues as to policy and markets next destinations. Here’s Zaye Capital Markets breakdown:
GBP Monetary Policy Summary, MPC Votes, and Official Bank Rate
Communication by the Bank of England will be of similar significance as the interest rate itself.
- If the Official Bank Rate is increased by more-than-expected amounts or the vote skew is more hawkishly dissensual than expected, markets may take it as a sign that policymakers are still grappling with enduring inflationary pressure. It would lift sterling, helping U.K. banks and financial stocks, yet may suppress exporters and industries sensitive to imports.
- Conversely, if the rate is reduced or the vote pattern is dovishly inclined, sterling may soften, with U.K. stocks—especially homebuilders, consumer discretionaries, and interest-rate-sensitive financial stocks—experience relief buying. The Monetary Policy Summary will be carefully analyzed for inflation trend commentary and growth risk to watch for even slight changes of tone to significantly move markets.
US Jobless Claims
Weekly claims of unemployment are the market’s cleanest, real-time indicator of the health of the U.S. labor market.
- It would be a less-than-expected reading to reinforce consumer conviction that it is resilient and spending is sustainable, driving risk appetite into cyclical stocks such as retail, travel, and autos. That said, it can complicate the Fed easing narrative by igniting inflationary wage fears to potentially flatten the yield curve as investors price in higher interest rates.
- If claims come in higher than expected, it would be a warning signal that the labor market is deteriorating more quickly than policymakers expect. That situation would be driving flows into Treasuries and defensive equity plays such as healthcare, utilities, and consumer staples as well as bolstering the dollar on safe-haven flows.
U.S. Philly Fed Manufacturing Index
The Philly Fed survey offers one of the earliest glimpses into U.S. factory activity and business sentiment.
- A stronger-than-expected result would signal that industrial momentum is firming after months of uneven output, supporting capital goods producers, machinery companies, and broader industrial equities. It would also suggest that supply chain stability and improved order books are countering global demand headwinds.
- Conversely, a weaker print would deepen concerns that U.S. manufacturing is slipping into contractionary territory, validating worries of a broader slowdown. Such an outcome could weigh on equities tied to heavy industry and energy, while sending investors back into bonds and raising the odds of more aggressive Fed easing later this year.
Stock Market Performance
Indexes Rebound Sharply off April Lows, But Steep Drawdowns Indicate Breadth Still Weak
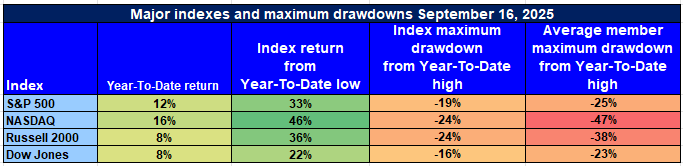
US equity indexes staged quite a remarkable recovery from the April 8 trough, but the rebound covers up for a weakened undercurrent. Year-to-date advances can be seen for all of the major indexes, yet by the downturns from annual highs and the steep losses that regular constituents have faced indicate that leadership is nonetheless restricted, volatility is ingrained, and wider involvement is distant. It is important for investors to be mindful of the difference between headline strength and the substance below the surface.
S&P 500: Good Gains, But Limited Market Leadership
YTD: +12% | +33% below April low | -19% off YTD high | Ave. member: -25%
The S&P 500 has posted a respectable 12% return for the year to date, with a vigorous 33% recovery from April lows. Initially, it appears to demonstrate strength and investor optimism in big-cap US stocks. But 19% off the index’s YTD top and by proxy, average constituent down 25% reveal another picture: the gain is concentrated in the handful of megacap names, while the wider index membership underperforms. The contradiction between the prominent index and the representative stock implies that although the benchmark appears robust, underlying representation is shallow, making the advance subject to external stress or changes in leadership.
NASDAQ: Technology-Led Outperformance Conceals Underlying Weak
YTD: +16% | +46% below April low | -24% below YTD high | Ave. member: -47%
NASDAQ has been the clear leader, up 16% year to date and up 46% from its April trough, largely powered by strength from among the high-growth tech leaders. But beneath the surge is much vulnerability: the index has already fallen 24% from its all-time peak this year, and the average member of NASDAQ has suffered eye-popping drawdowns of nearly 47%. It highlights the twin truth of the tech-heavy index—headline numbers appear healthy, yet for all except the few-leading-growth-stocks investors, returns have been significantly weaker. Member-level loss sizes highlight the increased riskiness of the growth trade, wherein volatility is eternal, not temporary.
Russell 2000: Small-Caps Rise But Lack Spark to Impress Confidence
YTD: +8% | +36% off April low | -24% off YTD high | Avg. member: -38% Small-cap stocks staged a sudden 36% rebound from April lows, signaling speculative interest in riskier, economically sensitive names. But with the year-to-date gain of the Russell 2000 at only 8%, skepticism of that rebound is widespread. The 24% drop from the year’s high and stunning average member losses of 38% signal ongoing stress at the smaller firms that have neither balance sheet strength nor price muscle. Small-caps are always an EUS sentiment indicator, and these readings suggest investors remain bearish on US growth even in spite of the Fed’s latest policy flip.
Dow Jones: Defensive Tilt Offers Relative Stability
YTD: +8% | -22% below April low | -16% below YTD high | Avg. member: -23% The Dow Jones has managed to combine steady gains with more modest volatility, rising 8% in 2025 and 22% from April lows. Its composition—weighted toward industrial, healthcare, and defensive value names—has offered a measure of stability. With a smaller drawdown of 16% from its high and average member losses of 23%, the Dow reflects a comparatively safer haven within U.S. equities. Yet even here, member-level weakness persists, showing that no index has been immune to the stresses shaping global markets this year.
At Zaye Capital Markets, we interpret these developments as proof that the rally from April, though remarkable, is still not diversely supported. The divergence between headline index strength and the dramatic average constituent declines necessitates ongoing selectiveness. Companies with healthy balance sheets, defense-like streams of earnings, and consistent free cash generation are favored, while those that are severely geared or speculatively inclined are cautioned against. The breadth indicators need to strengthen before the current rally can be characterized as sustainable and durable, and only then can volatility cease to be an ingrained component of market conditions.
Strongest Sector of All within these Indices
S&P 500 sector tracker (on 9/16/2025) by Zaye Capital Markets
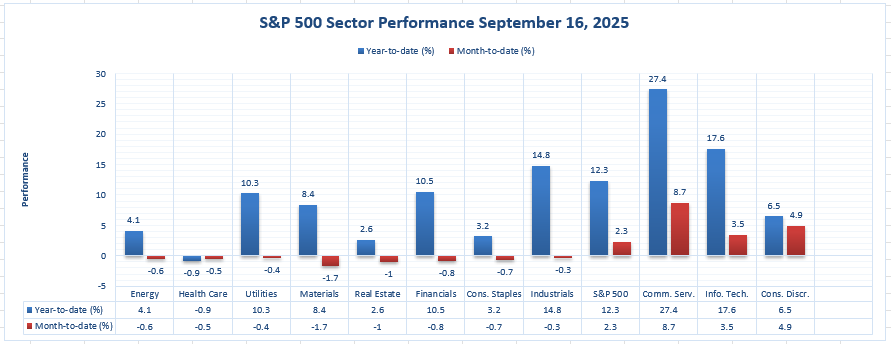
Leadership is narrow. Year-To-Date, Communication Services is the clear leader at +27.4%, followed by Information Technology at +17.6% and Industrials at +14.8%. The S&P 500 is +12.3% YTD. Month-to-date, strength is also concentrated: Communication Services again is at the top at +8.7%, while Consumer Discretionary is at +4.9% and Information Technology is at +3.5%; the S&P 500 is +2.3% MTD. Nearly all other sectors are down MTD, again highlighting sensitive breadth despite headline advancements.
Sector leaderboard (YTD | MTD):
- Communications Services: +27.4% | +8.7% ← strongest of all the
- Information Technology: +17.6% | +3.5%
- Industrials: +14.8% | −0.3%
- Financials: +10.5% | −0.8%
- Utilities: +10.3% | −0.4%
- Materials: +8.4% | −1.7%
- Consumer Discretionary: +6.5% | +4.9%
- Energy: +4.1% | −0.6%
- Consumer Staples: +3.2% | −0.7%
- Real Estate: +2.6% | −1.0%
- Health Care: −0.9% | −0.5%
Zaye Capital Market takeaways:
- Strongest sector: Communication Services (+27.4% YTD; +8.7% MTD) — leadership is established for both time frames.
- Momentum cohort: Information Technology (+17.6% YTD; +3.5% MTD) and Consumer Discretionary (+6.5% YTD; +4.9% MTD).
- Lagging/defensive tone: Across-the-board MTD selling in Utilities (−0.4%), Financials (−0.8%), Consumer Staples (−0.7%), Real Estate (−1.0%), Materials (−1.7%), Energy (−0.6%), and Health Care (−0.5%) signal limited participation. We monitor whether leadership expands outside of these top groups before proclaiming.
Earnings
Yesterday’s Earnings: September 17, 2025
General Mills, Inc.
- General Mills delivered its fiscal Q1 2026 earnings yesterday, posting adjusted EPS of $0.86 per share, topping estimates of roughly $0.81. Revenue came in at $4.52 billion, slightly ahead of expectations but down about 6.8% year-over-year, reflecting headwinds in core categories. North America Retail, the company’s largest segment, fell nearly 13% as organic volumes weakened. By contrast, its North America Pet unit grew 6%, supported by recent acquisitions, and International operations added another 6% lift, helped by currency tailwinds. Gross margins slipped by roughly 90–120 basis points as higher input costs weighed on profitability. Importantly, management reaffirmed full-year guidance, projecting adjusted earnings to decline 10–15% and organic sales to range between –1% and +1%. For investors, the key takeaway is that while the company continues to generate steady earnings beats, volume softness in its core retail portfolio raises concerns about longer-term growth momentum if inflationary and labor cost pressures persist.
Today’s Earnings: September 18, 2025
- FedEx Corporation
FedEx is expected to release results today with consensus pointing to EPS of $3.68 per share on revenue of about $21.7 billion. Investors will be focused on global shipping volumes and how management guides on fuel and freight costs amid softer international trade activity. Margin control and cost efficiency programs remain critical to sustaining profitability in a slowing macro backdrop.
- Lennar Corporation
Homebuilder Lennar is anticipated to post EPS of roughly $2.10 on revenue near $8.97 billion. Key factors include home closings, order growth, and commentary on buyer demand given current mortgage rates. With housing starts recently under pressure, investors will look closely at backlog trends and regional order strength to gauge resilience in the residential market.
- Darden Restaurants, Inc.
Darden, the operator of brands such as Olive Garden, is expected to report EPS of around $2.00 on sales near $3.04 billion. Analysts will be watching same-store sales growth, customer traffic, and operating margins as food and labor costs remain elevated. The company’s ability to pass costs onto consumers without eroding demand will be a key driver of sentiment.
- FactSet Research Systems Inc.
FactSet is set to announce results with EPS projected at $4.13 and revenue estimated at about $593 million. Attention will be on subscription renewals, client acquisition trends, and operating expenses tied to technology investment. With the financial services sector adapting to volatile conditions, FactSet’s guidance on recurring revenues and new product adoption will determine whether it can sustain its premium valuation.
Stock Market Preview – September 18, 2025, Thursday
US equity markets traded tentatively after the Federal Reserve’s quarter-point cut in interest rates, as investors weighed bullish sentiment toward easing financial conditions against fears of labor market sluggishness and lingering inflation. Financials and chosen industrials rallied, yet technology and growth stocks continued to come under pressure due to regulatory pressures and trade-linked risks. The divergence is creating a market landscape of narrowly-based leadership and continued volatility-based trading.
Stock Prices
Geopolitical Trends and Economic Trends
Markets remain focused on the Fed’s cautious tone. Policymakers signaled data-dependent flexibility, with labor indicators and inflation pressures keeping the path for further cuts uncertain. Meanwhile, U.S. trade and regulatory tensions continue to ripple through semiconductor and AI-linked names, adding pressure to growth stocks. Globally, commodity-linked markets face supply uncertainty, and geopolitical risks tied to tariffs and international negotiations remain front-of-mind for investors.
Latest Stock News
- Nvidia ($NVDA) dropped after it was revealed that China is urging local firms to suspend purchasing AI chipsets, moving the stock below key support.
- American Express ($AXP) rallied on firm sector strength, with emphasis on strength of fundamentals.
- Meta (META) also released new AI-based smart glasses despite initial teething problems to impact sentiment.
- Alphabet ($GOOGL) through its Waymo arm said that it will collaborate with Lyft ($LYFT) to take robotaxis to Nashville next year 2026, shifting the limelight to self-driving autos.
- Reddit ($RDDT) is said to be negotiating an AI-content licensing agreement with Alphabet ($GOOGL) that puts the site’s significance into perspective as a crucial data point in the LLM war.
- Palantir ($PLTR) is poised to sign off a $920 million U.K. contract during the visit of President Trump, augmenting its government contract pipeline.
- AMD (AMD) CEO noted that the sector is in year two of a decade-long buildout period of AI, making the stock into a secular growth vehicle.
- IonQ ($IONQ) surged after it agreed to pen an MoU with the US Department of Energy to advance quantum technology in space, and the stock soared five times higher with the news.
The Magnificent Seven and the S&P 500
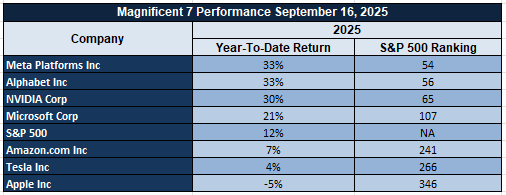
The “Magnificent Seven”—Apple, Microsoft, Nvidia, Amazon, Meta, Alphabet, and Tesla—are showing signs of fatigue. Collectively, the group is averaging drawdowns of over 18% from recent highs, with Tesla and Meta leading the pullback. This valuation reset highlights that AI-driven growth narratives have stretched ahead of fundamentals. The S&P 500 is struggling to gain traction without their leadership, with sectors like energy and industrials offering some support but lacking the weight to carry the market alone. Sustained upside will likely require renewed strength in these core megacap drivers.
Major Index Performance as of early Thursday , September 18, 2025
- Nasdaq Composite: trading at ~22,261.33, off by approximately 0.3%.
- S&P 500: around 6,600.35, down about 0.1%.
- Russell 2000: modest gain of ~0.2%.
- Dow Jones Industrial Average: stood at ~46,018.32, up ~0.6%.
At Zaye Capital Markets, we are looking for Big Tech’s weakness to fade as trade and regulation risks calm, and looking to see if small caps can maintain their recent strength. Sector rotation seems to be enroute—defensives and value are receiving some respite—but we are willing to remain cautious until confirmation from coming data that supports a more favorable higher path.
Gold Price – September 18, 2025
Gold is trading at $3,654–$3,660 per ounce, just below its recent all-time high near $3,707/oz, as markets absorb a combination of political news, central bank activity, and mixed economic data. The story is being informed by statements from powerful voices urging sharper monetary easing—such as Navarro’s call for today and next month’s 50-basis-point reduction each—versus the Fed’s own more cautious tack following its 25-point cut earlier this week. These mixed signals are important for bullion: if the Fed steps up cuts, declining real yields diminish the opportunity cost of gold holdings, spurring additional demand, while uncertainty or hawkish apprehension could hold upside gains. Meanwhile, uncertainty surrounding Trump’s statements spanning from Fed autonomy to declaring Antifa a terrorist entity, to returning to the United Nations as the war in Gaza and Ukraine heats up, and prominent meetings overseas all inject additional geopolitics uncertainty, the ultimate timeless safe-haven motivator. Add to that coming releases from the UK’s monetary policy report and votes, and the US unemployment claims and Philly Fed survey, and the environment is primed for increased volatility that can move gold sharply depending upon whether the releases affirm weakness rather than strength. Yesterday’s economic indicators revealed continued labor market weakness and patchy manufacturing activity, intensifying fears of a weakening economy despite inflation running above target. This combination supports a dovish bias to policy expectations, bolstering gold’s argument as a hedge to weaker growth and lingering inflation. Yet higher Treasury yields and the stronger dollar, spurred by traders adjusting positions into those very same releases, have limited gold’s near-term upside, with prices fluctuating near all-time highs yet to breach higher. From Zaye Capital Markets, gold is seen as tactically supported in this context: dovish pressure on the Fed, heightened geopolitical tensions, and weakening growth all maintain safe-haven demand firm. Volatility is nonetheless seen to persistent, as stronger-than-anticipated data from today’s releases has the potential to stabilise yields, strengthen the dollar, and transitorily test the mettle of the strength of the bullion’s rout, even if the longer-term context continues to argue for continued allocations to gold.
Oil Prices – September 18, 2025
Brent crude is trading at $67.80–$68 per barrel, while WTI is at $63.90–$64.00, after signaling at the beginning of the week a market torn between bullish supply clues and dovish demand forecasts. Initially, prices received support from a precipitous 9.3 million-barrel loss of US crude stocks, much larger than forecast, suggesting tightening supply and diminished net imports. But that was offset by higher distillate builds and softer refinery utilization, which admittedly only served to call into question downstream product appetite. Broader macro conditions enter the picture as well: the Federal Reserve’s 25-bps cut has spurred talk of softer financial conditions to come, although only its dovish guidance caps the upside. Trump-aligned commentary—Navarro’s exhortations for sharper, swifter cuts, say, and Trump’s own diplomatic signaling at home and abroad—enters the picture as well, because hopes of swifter easing tend to translate into weaker dollars and stronger oil, while recurrent inflation and global uncertainty inject volatility. Yesterday’s data thus left sentiment mixed: crude draws indicated real supply tightness, yet doubts over product refinery utilization and macro growth kept prices from taking out tops. Later, today’s US unemployment claims, Philly Fed manufacturing survey, and policy releases from the Bank of England will serve as important catalysts. Weak US labour or manufacturing data may fan fears of weaker growth and reduced oil demand, depressing prices, while robust data may boost consumption expectations and maintain higher crude anchors. Meanwhile, the outlook from the OPEC and IEA is warning: supply is due to grow from OPEC+, non-OPEC sources, and the IEA expects builds through the second half of 2025, implying surplus risk unless demand picks up substantively. That places the balance precarious such that every bullish stimulus—be it from tighter US supply data, geopolitical risk surrounding the Middle East, or easing by the Fed—can spur upward swings, yet every weakness in global economic data or supply surge puts upside in its check. From Zaye Capital Markets’ viewpoint, oil is within a volatile price corridor: capped by supply draws and geopolitical risk yet limited by lukewarm demand, dovish central banks, and ever-present supply surplus risk.
Bitcoin Prices – September 18, 2025
Bitcoin is trading at $116,400–$116,600 per coin, holding near multi-month tops as investorsprocess political commentary and regulatory news ahead of key economic data. The backdrop is that of added uncertainty: appeals by Trump-aligned corners such as Navarro for larger and faster rates cuts have sown expectations that monetary policy is going to relax more forcefully than the Fed’s dovish signaling suggests, something that historically lifts non-yielding assets such as bitcoin by reducing the opportunity cost of holding them. Meanwhile, Trump’s wider political agenda—from returning to the United Nations following Gaza and Ukraine tensions, to pressuring through his government for Antifa to be classified as a terrorist organization—brings into focus geopolitics that advance safe-haven cases for alternative assets. On the regulatory side, the plan by the UK to exempt crypto companies from chosen integrity requirements, the SEC’s approval of generic listing criteria for digital asset ETPs, and Bahrain’s attempt to pass regulations ensuring safer and clearer trading are all being interpreted as constructive moves that could expand institutional adoption. While India tops the world crypto adoption index and the UK regulator loosens its framework, the sentiment is growing that the regulatory environment is favorable, something that is giving legitimacy and reinforcement to buying demand for bitcoin at current higher levels. Yesterday’s economic releases provided additional tailwinds by signaling labour market fragility and mixed US factory conditions, stoking interest in continued easing of monetary policy and enduring Bitcoin appetite as inflationary pressure and policy risk hedge. Above-target inflation and easing growth indicators constitute the perfect environment for Bitcoin to be seen as a speculative growth proxy and store of value. However, today’s releases – US unemployment claims, Philly Fed Manufacturing Index, and the Bank of England’s monetary policy statement – will be pivotal for near-term direction. Weak readings would presumably stimulate safe-haven flows into Bitcoin, taking it higher as investors price in softer economic touchdown and more forceful easing, while stronger-than-expected data may boost the dollar, tighten liquidity expectations, and cap Bitcoin’s upside. Zaye Capital Markets believes that the current environment remains conducive to digital assets, but cautions that rising volatility needs to be prepared for as Bitcoin’s trajectory is strongly tied to macro data and the fluctuating political-regulatory landscape.
ETH Prices – September 18, 2025
Ethereum is trading in the $4,640–$4,650 range and is up modestly by 2.5–3% over the past 24 hours as sentiment gains strength in the wider crypto complex. The narrative for that price development is a push-and-pull between institutional flows and selling pressure from whales. While, on the one hand, Ethereum ETFs have seen continued steady interest, with almost $360 million of flows seen recently—an incredible number that in some instances even bypassed flows into Bitcoin ETFs—highlighting increased institutional adoption of ETH as not only a secondary to Bitcoin asset, but rather as a fundamental holding correlated to smart contract activity, decentralized finance, and the growing tokenization ecosystem. On the flipside, blockchain data reveals large holders selling almost 90,000 ETH (valued at almost $500 million) over the past two days. That volume of selling has churned out volatility in pockets around the $4,500 level, underscoring that while long-term interest is gaining strength, selling into strength by large holders and profit-taking can take steam out of the trend and top off near-term advances. On the macro side, the path of ETH is kept firmly tied to the same forces that influence gold, Bitcoin, and risk assets more generally. The weaker-than-expected US labor and manufacturer data yesterday firm up hopes of dovish Federal Reserve policy, which depresses real yields and boosts alternative and risk assets like Ethereum. That environment, plus exogenous regulatory changes—such as increased accommodation in core markets and ETF launches—once again builds structural support. But sales by large investors remind us that volatility is still the namesake of the ETH universe, as large sell-offs can beget swift correction even in up markets. Ideally, tomorrow’s unemployment claims and Philly Fed Manufacturing release may influence sentiment: underwhelming numbers would probably gain flows to ETH as investors wager toward easier liquidity, while stronger readings could affirm dollar strength, curb ETF flows, and return ETH to critical support at $4,400. Here at Zaye Capital Markets, we believe Ethereum is poised for continued institutional adoption, yet short-term trading will be a delicate balance of large investor activity, macroeconomic releases, and investor sentiment toward its role as the decentralized economy’s foundation.
