Where Are Markets Todays?
European and U.S. equity futures are opening modestly higher, pointing to a cautious, stabilizing start rather than a full risk-on move. U.S. futures are edging up after last week’s sharp swings, while European futures are tracking that tone with small gains of their own. The common thread across both regions is hesitation: investors are willing to re-engage after Friday’s rebound, but positioning remains light as markets wait for confirmation from upcoming economic data and earnings.
One key reason futures are higher is relief after extreme volatility, particularly in the U.S. tech sector. Last week’s sell-off, led by software stocks, pushed several indices toward key support levels and triggered a wave of de-risking. Friday’s powerful rebound—highlighted by the Dow Jones Industrial Average closing above the 50,000 level for the first time—helped restore short-term confidence. The recovery in risk assets such as Bitcoin, which rebounded back above $70,000 after a sharp drawdown, reinforced the view that forced selling had largely run its course, allowing futures to stabilize heading into the new week.
A second driver is anticipation of delayed but critical macro data, which is keeping gains contained. Investors are positioning ahead of the postponed January jobs report and the upcoming inflation release later in the week. Recent private payroll figures showed very limited job growth, increasing sensitivity around official labor data. As a result, futures are positive but restrained, reflecting a market that wants clarity on whether growth is slowing enough to support easier policy expectations or whether inflation and labor strength could reintroduce downside risk.
European futures are also benefiting from spillover stabilization from U.S. markets, but sentiment remains fragile. Ongoing geopolitical uncertainty and Europe’s exposure to global trade and energy dynamics continue to cap enthusiasm. In both regions, the message from futures pricing is consistent: markets are attempting to rebuild balance after last week’s turbulence, but a sustained move higher will likely require renewed participation from technology stocks and supportive confirmation from economic data.
Major Index Performance as of Monday, 9 Feb 2026
- Nasdaq Composite: Trading at 23,031.21, supported by selective rebounds but still weighed down by mega-cap technology.
- S&P 500: Trading at 6,932.30, reflecting narrow leadership and sensitivity to incoming macro data.
- Russell 2000: Trading at 2,670.34, outperforming as capital rotates into smaller, economically sensitive stocks.
- Dow Jones Industrial Average: Trading above 50,200, holding above the 50,000 level as defensives and industrials provide relative stability.
The Magnificent Seven and the S&P 500
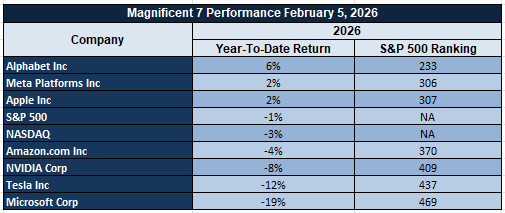
The S&P 500 continues to face pressure from weakness in its largest technology constituents. These stocks are being repriced as investors reassess valuations, earnings durability, and the pace of AI-driven demand normalization. Given their outsized role in prior gains, sustained underperformance from this group continues to cap broader index upside and reinforce the importance of sector diversification.
Drivers Behind the Market Move – Monday, February 9, 2026
As U.S. and European markets open the new week, investor sentiment is being shaped by a combination of heightened geopolitical messaging, anticipation ahead of key delayed economic data, and ongoing post-volatility repositioning. With today’s economic calendar notably quiet, markets are responding less to hard data and more to policy signals, geopolitical risk, and forward-looking expectations tied to the rest of the week.
1. Escalating Geopolitical and Trade Policy Signals
A heavy flow of executive actions and public remarks has elevated geopolitical risk across global markets. Recent measures targeting countries doing business with Iran—explicitly including tariff mechanisms—alongside duty modifications related to Russia under national emergency authorities have reinforced uncertainty around global trade, energy flows, and supply chains. While parallel messaging around progress in Ukraine talks and upcoming diplomatic meetings has reduced the probability of immediate escalation, markets continue to price in higher headline risk. This environment is supporting defensive positioning and safe-haven demand, while keeping cyclical and trade-sensitive sectors under pressure in both U.S. and European equities.
2. Markets Position Ahead of Delayed but High-Impact Economic Data
With no major economic releases scheduled for today, investor focus has shifted firmly toward data due later in the week, particularly the delayed January jobs report and upcoming inflation readings. Recent private payroll figures showing very modest job growth have increased sensitivity around official labor data, encouraging a cautious stance rather than aggressive risk-taking. As a result, U.S. and European markets are trading in anticipation mode, with modestly higher futures reflecting stabilization rather than conviction, as participants wait for clarity on growth momentum and policy implications.
3. Post-Volatility Rebalancing Continues After Tech-Led Sell-Off
Following last week’s sharp sell-off—led by technology and software stocks—and subsequent rebound, markets are still digesting a rapid reset in positioning. The late-week recovery helped stabilize sentiment, but leadership remains narrow and uneven, particularly within growth-heavy segments. In Europe, this has translated into selective strength rather than broad participation, while in the U.S., recent gains are being treated as consolidation rather than a confirmed trend reversal. With macro clarity absent today, investors are prioritizing balance-sheet strength and risk management, keeping overall market moves restrained.
In summary, the convergence of elevated geopolitical risk, anticipation ahead of key economic data later this week, and continued post-volatility repositioning is driving cautious but stable market behavior. Until fresh data or clearer policy signals emerge, both U.S. and European markets are likely to remain range-bound and highly sensitive to headlines.
Digesting Economic Data
The Trump Tweets and Its Implications
The latest stream of policy announcements and public remarks reflects an administration operating at high intensity across trade, security, and domestic economic priorities. Executive orders targeting countries doing business with Iran—paired with explicit tariff mechanisms—alongside duty modifications related to Russia under national emergency authorities signal a renewed willingness to use trade and economic pressure as tools of foreign policy. For markets, this reinforces an environment of elevated geopolitical risk, particularly around energy flows, global supply chains, and cross-border capital movement. At the same time, repeated messaging around progress in Ukraine talks and upcoming meetings with key regional partners introduces a counterbalance, keeping investors caught between escalation risk and de-escalation hope.
On the trade and economic front, the United States–India joint statement stands out as a constructive development. References to interim trade frameworks, energy cooperation, and strategic purchases point toward a selective reshaping of global trade relationships rather than broad disengagement. This contrasts with the more confrontational tone toward Iran and Russia and suggests a bifurcated strategy: pressure on adversarial regimes while deepening ties with strategic partners. Markets tend to price this as increased volatility rather than a one-directional outcome, with sector-specific implications depending on exposure to energy, defense, agriculture, and global manufacturing.
Domestically, proclamations aimed at affordable beef, expanded commercial fishing access, prescription drug cost savings through TRUMPRX.GOV, and public safety initiatives reinforce a narrative focused on cost relief and domestic supply. Claims of inflation victory and the signing of congressional legislation further support this messaging. However, markets generally treat such statements with caution, focusing less on rhetoric and more on measurable outcomes in inflation data, consumer behavior, and fiscal impact. The ongoing emphasis on voter ID, DEI limitations upheld by court decisions, and high-volume media engagement adds a layer of political noise that can amplify short-term sentiment swings without necessarily altering fundamentals.
Overall, the cumulative effect of these communications is a higher-than-normal policy signal frequency, which tends to increase market sensitivity to headlines. Investors are likely to remain defensive and selective, favoring assets and sectors that benefit from geopolitical hedging, domestic spending priorities, or strategic realignment, while avoiding broad risk exposure until policy direction becomes clearer. The key implication is not a single market outcome, but sustained volatility driven by the intersection of trade policy, geopolitical negotiations, and domestic economic messaging.
Cooling Near-Term Inflation, Long-Term Price Fears Still Anchor Market Caution
According to the latest University of Michigan consumer survey, households’ one-year inflation expectations have come in at 3.5%, easing from 4.0% in January 2026. From our perspective, this data point is perfectly in line with the broader “Digesting Economic Data” theme, where improving forward-looking inflation expectations reinforce the view that the economy is digesting the effects of the monetary tightening cycle and that the restrictive monetary settings are starting to bear fruit. This is especially the case as near-term inflation pressures dissipate, which in our view will see the markets increasingly price in a more dovish stance from the Federal Reserve, especially if growth and labor data also begin to normalize.
However, the same survey also revealed that five- to ten-year inflation expectations rose to 3.4% from 3.3%, which is still well above the pre-pandemic period. From our perspective, the near-term inflation concerns will likely provide comfort to households, while the long-term concerns will still linger, especially when considering the interplay of factors such as fiscal discipline, credibility, and structural cost pressures. From the perspective of the markets, the interplay of these factors will likely see expectations for rate cuts in the near term while also keeping long-dated government bond yields elevated, which will in turn affect the way equities are priced in the financial sector.
From our perspective, we see opportunities for value in the financial sector, especially in the rate-sensitive asset managers such as BlackRock, which are trading at depressed levels to the earnings resilience that they display while also benefiting from the positive effect that elevated long-dated government bond yields will have on fee income and asset allocation. Analysts will need to pay attention to movements in the yield curve, inflation expectation surveys, and the broader data releases to gauge the interplay of these factors and determine whether the easing in short-term inflation concerns is enough to overcome the long-term concerns that still linger.
Consumer Sentiment Ticks Higher, But Caution Persists Beneath the Surface 
The University of Michigan’s preliminary Consumer Sentiment Index for February 2026 rose to 57.3 from 56.4 in the prior reading, marking the third consecutive monthly increase and the highest reading in six months. This increase is largely the result of the 5.2% increase in the current conditions component to 58.3, which suggests that households are becoming more comfortable with the current economic reality. In the context of Digesting Economic Data, the continued improvement in the Consumer Sentiment Index is an encouraging sign for the near-term economic outlook. Yet, the reading still has a long way to go before it reaches the historical norm near the 100 level.
Despite the positive reading in the current conditions component, the expectations component fell slightly to 56.6, which suggests that households are still less optimistic about the near-term economic outlook. This divergence in the data is consistent with the idea that households are still apprehensive about the medium- to long-term economic outlook. This apprehensiveness is likely the result of concerns about price stability, policy uncertainty, and global risk factors. From the perspective of the markets, the positive reading in the current conditions component is likely to be positive for short-term stability in retail and the broader equity markets, but the negative reading in the expectations component will likely temper enthusiasm about the near-term upside in the economy. In the context of the broader economic landscape, we believe that there is relative value in consumer-related equities that are more levered to the near-term economic outlook, particularly Home Depot, which is more levered to the housing market and the balance sheet of the consumer. Analysts will want to track the near-term trends in retail sales, wage growth, and consumer confidence among the higher-income demographic. If the expectations component continues to lag the current conditions component, then the upside in the discretionary economy will be limited.
Quits Rate Holds Steady, Signaling Labor Balance Without Reigniting Wage Pressure
The latest available labor statistics indicate that the quits rate remains unchanged at 2.0% in December 2025, indicating a stable pace of quits as the labor market continues to normalize. In the context of Digesting Economic Data, the quits rate is a strong indicator of worker sentiment—when workers are confident, quits increase; conversely, when workers are less confident, quits stabilize or decline. The unchanged quits rate is a strong indication that the labor market is returning to normal after reaching highs near 3.0% during the pandemic, suggesting that fewer workers are chasing wages and more are focused on job security.
The underlying reasons for this stability are important in terms of inflation dynamics. A stable quits rate is a strong indication of lower job-hopping, which in turn reduces upward pressures on wages, thereby curbing second-round effects of inflation. This is in line with recent developments in inflation statistics, which are moderating, supporting the view that policy should be stable rather than reacting to rapid changes in economic conditions. From a market perspective, this is a strong indication of continued economic growth without overheating—the job market remains strong, but the balance of power between employers and employees is no longer shifting in a manner that would require a significant policy response from the Federal Reserve.
In this environment, we believe that large-scale staffing and workforce services companies such as Manpower Group are undervalued based on normalized levels of hiring demand, which are likely to persist in a stable employment environment. Analysts should be watching the quits rate in future releases, along with job openings, wage growth, and productivity statistics to confirm that the normalization in the labor market is continuing. A rising quits rate Is a strong indication that wages are becoming less secure, while a falling quits rate may indicate that the broader economy is cooling—both of which will require changes to valuation multiples in the labor market.
Tech Job Cuts Surge, Exposing Corporate Caution Beneath AI Efficiency Gains 
A surge in job cuts was seen in January 2026, as technology sector job cuts more than doubled to 22,291, a figure higher than any other sector since mid-2023. At a macroeconomic level, total job cuts came in at 108,435, making it a dismal January for labor cuts since 2009. In our framework of Digesting Economic Data, this represents a shift in corporate behavior as they prioritize balance sheet and cost considerations over growth and expansion strategies. When we drill down further, it is also important to recognize that technology sector job cuts are likely related to restructuring and automation and artificial intelligence strategies, where productivity is being improved through fewer workers.
However, it is also important to recognize that hiring plans have collapsed, indicating a cautionary move to protect balance sheets and costs rather than a productivity upgrade cycle. From a market perspective, this is a relevant observation as this historically leads to pressure on valuations, particularly growth-oriented sectors, despite a strong innovation story. While this would be a positive for maintaining stability within monetary policy at the Federal Reserve, it also represents a risk to corporate earnings.
In this context, we believe there is value to be found within diversified enterprise software providers such as Oracle, where the company is undervalued to their recurring revenue base and is a mission-critical component to corporations rationalizing costs. Analysts should be watching to understand if job cuts continue to rise and hiring plans continue to decline as this would be a further indication of a recession risk, or if job cuts stabilize and hiring plans continue to decline as this would be a sign that restructuring is front-loaded and not cyclical.
Job Openings Fall to Cycle Lows, Signaling Cooling Labor Demand Without Collapse 
Job openings have declined further, reaching a cycle low of 6.5 million in December 2025, while the openings-to-unemployed ratio has declined to 0.87, down significantly from levels seen during the peak in labor market tightness, which were above 2.0. Under our Digesting Economic Data framework, these data suggest that the demand for labor continues to normalize, not deteriorate, as the number of unemployed workers remains near 7.5 million, and hiring decisions become even more selective.
If we look beneath the surface, these changes in the openings-to-unemployed ratio have significant implications for inflation and growth, particularly in an inflation environment that continues to show disinflationary pressures. While a lower openings-to-unemployed ratio means lower wage pressures, which support disinflation, the openings-to-unemployed ratio remains slightly above its pre-2020 average, suggesting a cooling, not stalling, economy. From a market perspective, these data suggest a stable, not accelerating, growth environment, with growth continuing, albeit at a pace that prevents overheating while keeping recession risks contained. In this environment, it becomes even easier to argue for a more flexible monetary policy approach by the Federal Reserve, particularly if additional data continue to support these trends.
In this environment, we see opportunities in interest-rate-sensitive real estate investment trusts April 8, 2025 such as Realty Income, which, in our view, are undervalued in a stable, slower-growth environment. While analysts should continue to focus on future job openings data, wage growth trends, and changes in the duration of unemployment, a continued decline in job openings and rising unemployment would suggest a negative storyline, while stabilization in these trends would support our soft-landing scenario.
Upcoming Economic Events
Quiet Market Session Today, Focus Turns to Data Releases Throughout the Week
The economic calendar for today is relatively quiet, with no major data releases scheduled throughout the day that could significantly impact market direction. Without fresh data releases, market participants are expected to trade cautiously, and market direction will largely depend on market positioning, technical levels, and sentiment driven by recent data releases.
While the market may have a quiet day today, it does not mean that market participants will not face risks. In the absence of fresh data releases, market participants may become more volatile and responsive to unscheduled news releases, especially in interest-rate-sensitive markets. Market volatility may return quickly once market participants start positioning themselves in anticipation of scheduled data releases.
The focus of market participants will now shift to scheduled data releases throughout the week, which are expected to bring fresh information on inflation, consumer sentiment, and demand trends. These releases are also expected to bring further confirmation of whether recent trends are continuing or reversing. Investors are advised to keep a sharp eye throughout the week, as fresh data releases are expected to bring direction and fresh perspectives to market participants.
Stock Market Performance
Indexes Recover from April Lows, But Drawdowns Reveal Uneven Market Strength
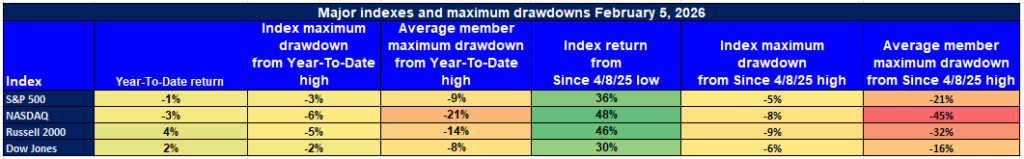
Market indexes have registered impressive gains since the lows of April 8, 2025. However, the figures show that the stock market’s performance has been uneven in the recent past. The indexes have registered impressive gains since the lows of April 8, 2025, but the year-to-date performance and maximum drawdowns show the unevenness of the stock market’s performance in the recent past. From our perspective at Zaye Capital Markets, the stock market’s performance has been uneven in the recent past.
Here’s how the stock market’s performance has been In the recent past from the figures in the chart:
S&P 500: Headline Stability, But Member Stress Persists
YTD: -1% | +36% since 4/8/25 low | -3% from YTD high | Avg. member max drawdown YTD: -9%
The S&P 500 stock index has registered impressive gains in the recent past since the lows of April 8, 2025. The S&P 500 stock index has registered impressive gains in the recent past since the lows of April 8, 2025, but the year-to-date performance and maximum drawdowns show the unevenness of the stock market’s performance in the recent past.
NASDAQ: Strong Recovery, Severe Underlying Volatility
YTD: -3% | +48% since 4/8/25 low | -6% from YTD high | Avg. member max drawdown YTD: -21%
The NASDAQ has experienced the strongest bounce, up 48% from its April lows, despite being down 3% year to date. However, its average member has experienced a maximum 21% decline, reflecting the volatility and unevenness of the bounce among growth stocks.
Russell 2000: Small Caps Show Relative YTD Strength, But Wide Damage
YTD: +4% | +46% since 4/8/25 low | -5% from YTD high | Avg. member max drawdown YTD: -14%
The Russell 2000 has experienced the strongest bounce, up 4% year to date and 46% from its April lows. However, its average member has experienced a maximum 14% decline, reflecting the volatility and unevenness of the bounce among growth stocks.
Dow Jones: Modest YTD Gain with Lower Volatility Profile
YTD: +2% | +30% since 4/8/25 low | -2% from YTD high | Avg. member max drawdown YTD: -8%
The Dow Jones has experienced a modest bounce, up 2% year to date and 30% from its April lows. However, its average member has only experienced a 2% decline from its year-to-date highs and an average member max drawdown of 8%. The Dow Jones has experienced the lowest volatility among the major indexes, reflecting its relatively defensive profile.
We continue to view the current market environment as selective, and our analysis suggests investors should remain disciplined and focused on balance sheets and breadth before becoming overly bullish on the sustainability of the current market bounce, despite its strong magnitude from its April lows.
The Strongest Sector in All These Indices
Energy Leads the Pack, Maintaining Clear Year-to-Date Leadership
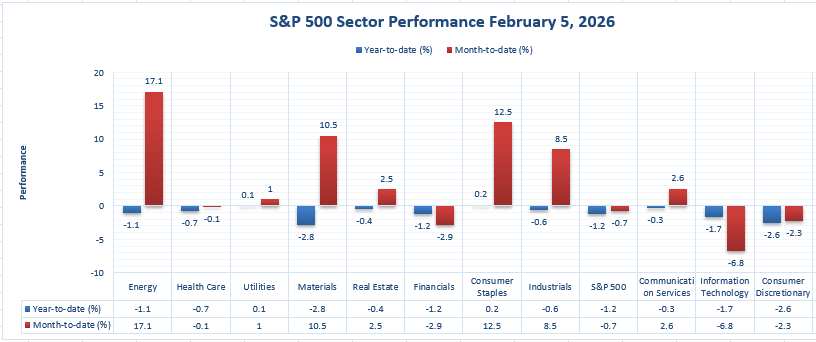
If we were to analyze the data provided in the above chart, we would find that the strongest sector in the market is the energy sector. It is the highest-gaining sector in the market year-to-date, with a gain of 17.1%, making it the highest-gaining sector in the market year-to-date. Even though the energy sector declined -1.1% on 2/5/2026, the energy sector still maintains its clear year-to-date leadership position.
What makes the year-to-date performance of the energy sector even more impressive is the fact that the energy sector leads the rest of the market significantly in terms of year-to-date performance. The closest sector in the market year-to-date is the consumer staples sector, which has gained 12.5%, followed by the materials sector with a year-to-date gain of 10.5%, and the industrials sector with a year-to-date gain of 8.5%. The overall S&P 500 index is down -0.7% year-to-date.
As analysts at Zaye Capital Markets, we believe that the above data indicates that the current market leadership is narrow, with the energy sector being the clear winner in the market year-to-date. Analysts should also analyze whether the energy sector would continue its winning streak year-to-date or if the market leadership would shift to other sectors that have performed well in the market in the short term, such as the consumer staples or materials sectors.
EARNINGS
Earnings – Results From Yesterday (February 6, 2026)
- Cboe Global Markets, Inc. reported a standout quarter, with Q4 2025 net revenue of $671.1 million, up 28% year over year, marking a record. Diluted EPS reached $2.97, up 60% year over year, while adjusted diluted EPS came in at $3.06, up 46% year over year, also record levels. Full-year 2025 results reinforced this strength, with net revenue of $2.4 billion, diluted EPS of $10.42, and adjusted diluted EPS of $10.67, reflecting sustained demand across derivatives and volatility-linked products.
- Toyota Motor Corp. delivered a more mixed picture. For Q3 FY2026, group profit declined to ¥1.25 trillion, down 43% year over year, despite solid operating momentum. Over the nine months through December 2025, profit totaled ¥3.03 trillion, down 26% year over year, while sales rose nearly 7% year over year to ¥38 trillion. The results highlight ongoing margin pressure even as top-line demand remains intact.
- Piper Sandler Companies posted strong investment banking performance, reporting Q4 2025 adjusted net revenues of $635 million, up 27% year over year. Operating income reached $172 million, translating to a 27.2% operating margin, while net income totaled $123 million. Diluted EPS of $6.88 exceeded expectations. For full-year 2025, net revenues were $1.9 billion, operating income $411 million, and adjusted diluted EPS $17.74, underscoring sustained advisory strength.
- Philip Morris International Inc. reported Q4 2025 net revenues of $10.36 billion, up 6.8% year over year reported and 3.7% on an organic basis. Adjusted operating income rose 5.8% year over year to $3.72 billion, while adjusted diluted EPS increased 9.7% year over year to $1.70, beating expectations. Full-year 2025 results showed net revenues above $40 billion, including approximately $17 billion from smoke-free products, with reported diluted EPS of $7.26 and adjusted diluted EPS of $7.54.
- Societe Generale closed out yesterday’s earnings with Q4 2025 revenues of €6.73 billion, up 1.6% year over year, and net income of €1.42 billion, up 36% year over year. EPS was approximately €1.61, beating estimates, while the cost of risk stood at 29 basis points. Full-year 2025 results were equally strong, with revenues of €27.3 billion, group net income of €6.0 billion, a cost-to-income ratio of 63.6%, and ROTE of 10.2%, reflecting improved profitability and balance-sheet discipline.
Earnings – Due Today (February 9, 2026)
- Upwork Inc. is set to report results that will offer insight into demand trends within the freelance and digital labor market. Investors will be focused on revenue growth, client activity levels, and any changes in guidance that signal whether businesses are maintaining flexible hiring strategies or pulling back amid economic uncertainty.
- Apollo Global Management, Inc. (New) reports today with attention centered on fee-related earnings, asset inflows, and expense discipline. Market participants will assess whether growth in assets under management can offset pressure on performance-related income, which remains sensitive to broader market conditions.
- Mitsubishi Estate Co., Ltd. will provide a read on global property and development trends, with investors watching rental income stability, occupancy levels, and capital allocation decisions. Commentary around financing conditions and project pipelines will be key in assessing resilience within the real estate space.
- Loews Corporation rounds out the day, with focus on operating performance across its diversified holdings, balance-sheet strength, and capital return priorities. Investors will look for clarity on earnings durability across insurance and industrial segments as macro conditions remain mixed.
From our perspective at Zaye Capital Markets, the combination of yesterday’s confirmed earnings strength in financial and market-linked businesses and today’s upcoming reports across services, asset management, real estate, and diversified holdings will help define whether earnings momentum is narrowing further or beginning to broaden.
Stock Market Overview – Monday, 9 Feb 2026
U.S. equity markets started the week on firmer footing, though conviction remains measured as investors position ahead of key economic data due later this week. After a volatile January marked by narrow leadership and pressure on large-cap technology, index levels have stabilized but participation remains selective. From our perspective at Zaye Capital Markets, the market is showing early signs of repair rather than a confirmed trend reversal, keeping risk discipline front and center.
Stock Prices
Economic Indicators and Geopolitical Developments
With no major economic releases scheduled for today, markets are trading in anticipation mode. Attention is firmly on inflation expectations, consumer sentiment, and labor-market data due later this week, which could materially influence interest-rate expectations. Geopolitical uncertainty and policy ambiguity continue to weigh on confidence, while elevated bond yields relative to recent history keep valuation pressure on growth stocks.
Latest Stock News
Key corporate and regulatory developments are shaping near-term market narratives:
- Amazon confirmed its cloud business added 3.9 gigawatts of power capacity over the past year, including 1.2 gigawatts in the fourth quarter, with expectations to double total capacity again by the end of 2027, underscoring that power availability is becoming the main constraint in the largest data-center buildout in modern history.
- The food and drug regulator signaled swift action against companies mass-marketing illegal copycat drugs, increasing regulatory risk for the compounded-drug ecosystem. Following discussions with regulators, one major consumer health platform confirmed it will stop offering compounded semaglutide products.
- Nvidia’s leadership noted that GPUs sold six years ago are rising in price and that it may take seven years to fully size true AI demand, suggesting depreciation fears are fading just as hyperscaler capital spending and GPU demand re-accelerate.
- Apple reaffirmed it is “all in” on AI, embedding Apple Intelligence across its products and leveraging a 2.5-billion-device ecosystem as a distribution advantage, with a more personalized Siri launching this year.
- Alphabet has overtaken Nvidia as the market’s favorite candidate to finish the year as the world’s most valuable company.
Top Performers of 2026 (Year-to-Date)
- $SNDK +152%
- $BE +65%
- $WDC +64%
- $CRML +59%
- $ENPH +55%
- $TWST +55%
- $APLD +43%
- $ASTS +40%
- $NXT +39%
- $MU +38%
- $INTC +37%
- $NTLA +37%
- $LRCX +35%
- $RDW +32%
- $ASML +32%
The Magnificent Seven and the S&P 500

The S&P 500 continues to face pressure from weakness in its largest technology constituents. These stocks are being repriced as investors reassess valuations, earnings durability, and the pace of AI-driven demand normalization. Given their outsized role in prior gains, sustained underperformance from this group continues to cap broader index upside and reinforce the importance of sector diversification.
Major Index Performance as of Monday, 9 Feb 2026
- Nasdaq Composite: Trading at 23,031.21, supported by selective rebounds but still weighed down by mega-cap technology.
- S&P 500: Trading at 6,932.30, reflecting narrow leadership and sensitivity to incoming macro data.
- Russell 2000: Trading at 2,670.34, outperforming as capital rotates into smaller, economically sensitive stocks.
- Dow Jones Industrial Average: Trading above 50,200, holding above the 50,000 level as defensives and industrials provide relative stability.
At Zaye Capital Markets, we continue to frame this as a selective risk-on environment. Index stability is improving, but leadership remains concentrated and vulnerable to macro surprises. Investors should prioritize quality, earnings visibility, and risk management while monitoring breadth and upcoming economic releases for confirmation of a more durable market recovery.
Gold Price: Why Geopolitics and Quiet Data Are Keeping Gold Prices Firm Near $5,000
Spot gold is currently trading around the $5,000 per ounce area, holding near recent highs as markets digest an escalation in geopolitical signals alongside a quiet economic calendar. Recent executive actions and statements focused on Iran-related trade measures, tariff mechanisms, arms transfer strategy, Russia-linked duty changes, and Middle East diplomacy have increased global policy uncertainty. These developments raise the probability of trade disruption, sanctions spillovers, and regional instability, all of which historically support demand for gold as a defensive asset. With no major economic data scheduled for today, there is little to challenge existing positioning, allowing geopolitical risk premiums to remain embedded in pricing. In this environment, gold’s ecosystem is being driven less by short-term data surprises and more by capital preservation flows, hedging activity, and cross-asset rebalancing as investors seek insulation from political and security-related shocks.
Yesterday’s economic data further reinforced this tone. Indicators showing cooling near-term inflation expectations alongside persistent longer-term concerns have supported the view that real interest rates may remain constrained even if policy stays cautious. This backdrop limits the opportunity cost of holding non-yielding assets like gold while keeping demand elevated among institutions focused on diversification and downside protection. With labor market indicators normalizing and no fresh data today to alter rate expectations, gold continues to benefit from a combination of geopolitical uncertainty, muted real yield pressure, and steady safe-haven demand. As long as political headlines remain active and macro data fail to reintroduce aggressive tightening expectations, gold prices are likely to remain well supported around current levels rather than experience a sharp retracement.
Oil Prices: Why Geopolitics, OPEC Signals, and Quiet Data Are Steering Oil Prices Today
Crude oil prices are trading in a narrow but volatile range, with Brent crude near $67–68 per barrel and WTI crude around $63–64 per barrel as of today. Price action reflects a tug-of-war between geopolitical risk premiums and softer demand expectations. Recent executive actions and statements targeting Iran, Russia-related duties, and broader national security priorities have kept geopolitical risk firmly in play, preventing a deeper sell-off in oil. At the same time, easing fears of immediate supply disruption—following signals that diplomatic channels remain active—have capped upside momentum. Commentary circulating among market-focused analysts highlights that oil is no longer reacting to single headlines, but rather repricing around sustained geopolitical uncertainty without a clear supply shock. Meanwhile, guidance from major energy bodies continues to shape sentiment: both OPEC and the International Energy Agency project demand growth into 2026, but also acknowledge ample supply and rising non-OPEC production, reinforcing a market structure where rallies are met with selling pressure rather than follow-through.
Yesterday’s economic data added another layer of restraint to oil prices. Cooling short-term inflation expectations and signs of moderating economic momentum have weighed on near-term demand assumptions, particularly for industrial and transport fuel usage. This has reinforced the idea that global growth is steady but not accelerating, limiting bullish conviction in crude. Importantly, today’s economic calendar is quiet, leaving oil prices driven primarily by positioning, geopolitical developments, and macro expectations rather than fresh data. In the absence of new releases, traders are unlikely to aggressively reprice demand outlooks, keeping crude anchored near current levels. However, upcoming inflation and labor data later this week remain critical: stronger-than-expected data could revive demand optimism and support oil prices, while weaker data would likely pressure crude as growth expectations soften. For now, oil remains caught between persistent geopolitical support and structural demand caution, resulting in range-bound but reactive price behavior.
Bitcoin Prices: Why Bitcoin Is Stabilizing Near $71,000 Amid Geopolitical Risk and Macro Fear
Bitcoin is currently trading around $70,800, stabilizing after a sharp sell-off that briefly pushed prices below the $65,000 level before a rebound took hold. The recent price action reflects a textbook risk-off liquidation phase rather than a breakdown in long-term adoption dynamics. Heightened geopolitical developments—ranging from new executive actions targeting Iran-linked trade and tariff mechanisms, to duty modifications tied to Russia and broader national security strategies—have driven global investors into defensive positioning across equities, tech, and digital assets. In this environment, Bitcoin has behaved less like a crisis hedge and more like a high-beta macro asset, amplifying moves seen in broader risk markets. Derivatives activity and large options expiries accelerated downside momentum, while volume spikes suggest forced positioning rather than organic selling. Importantly, on-chain indicators and whale activity show larger holders accumulating into weakness, reinforcing that the current price zone is being treated as a stabilization range rather than a capitulation floor.
Yesterday’s economic data added to this fragile but stabilizing sentiment. Cooling near-term inflation expectations alongside persistent longer-term uncertainty reduced confidence in aggressive risk-taking, reinforcing de-risking flows across crypto markets. This combination has kept Bitcoin range-bound, with market psychology split between short-term caution and longer-term accumulation narratives. With no major economic data scheduled for today, Bitcoin’s ecosystem is being driven by liquidity conditions, geopolitical headlines, and macro positioning rather than fresh fundamental inputs. As a result, volatility remains elevated, but price action is showing early signs of balance as selling pressure fades and buyers defend key levels. Until broader equity volatility subsides or macro clarity improves, Bitcoin is likely to continue trading in a wide consolidation range, reflecting uncertainty rather than structural weakness.
ETH Prices: Why Ethereum Is Holding Near $2,100 as Whales Accumulate and ETFs Stay Cautious
Ethereum is currently trading around the $2,050–$2,100 range, consolidating after recent volatility that mirrored broader risk-off moves across crypto and global markets. Price action over the past several sessions shows ETH stabilizing rather than extending losses, supported by notable whale activity. On-chain data from the past week indicate large holders withdrawing significant amounts of ETH from centralized exchanges, including a single transfer of over 60,000 ETH, reducing readily available sell-side supply. This behavior typically signals strategic accumulation rather than short-term speculation and suggests that larger participants are positioning for medium- to long-term exposure at current levels. At the same time, exchange reserves for Ethereum have continued to trend lower, reinforcing supply-side tightening that can support price stability during periods of weak retail participation.
However, institutional flows present a more balanced picture. Spot Ethereum ETF activity over the past week has remained mixed, with periods of net outflows reflecting cautious institutional positioning amid macro uncertainty and elevated volatility. These outflows have limited upside momentum, preventing ETH from staging a stronger rebound despite supportive on-chain signals. Yesterday’s economic data—highlighting softer near-term inflation expectations but ongoing uncertainty around growth—reinforced defensive sentiment across risk assets, keeping leveraged participation subdued. With no major economic data scheduled today, Ethereum’s price is being driven primarily by positioning, liquidity conditions, and large-holder behavior rather than fresh macro catalysts. As a result, the ETH ecosystem is currently defined by a balance between whale-led accumulation and institutional hesitation, pointing to consolidation rather than a decisive breakout or breakdown in the near term.
