Where Are Markets Today?
Stock futures are rising slightly this morning in both the US and Europe as investors await the release of the delayed January non-farm payroll report from the US Bureau of Labor Statistics. S&P 500 and NASDAQ 100 stock index futures have risen 0.2%, while Dow Jones futures have risen by 85 points. The moderate gain in US and European stock index futures this morning reflects a sense of cautious optimism as investors digest a volatile macroeconomic environment marked by conflicting consumer spending reports and uncertain inflation prospects. Meanwhile, in Europe, STOXX 600, DAX, and FTSE 100 index futures are rising slightly as autos and luxury stocks rebound from a flat close on Tuesday. Investors are approaching the jobs report with caution as the data is expected to reveal minimal job growth of 55,000 in January, up from 50,000 in December, and an unemployment rate of 4.4%, according to Dow Jones’ consensus estimate.
One of the primary reasons for this slight futures strength can be attributed to the anticipation surrounding the US labor report, which was due to be released but has been impacted by the recent government shutdown. This has assumed greater significance given its potential to either assuage or heighten fears about a stagnating economy or provide some breathing room for the Fed to keep interest rates steady. An unfavorable reading could heighten calls for rate easing measures, while a favorable reading could diminish expectations for rate cuts. Complicating matters further is the question of accuracy, given the potential for revisions by BLS that could dramatically alter perceptions about labor trends during Q4 2025 and Q1 2026. In an interview to CNBC, Krishna Guha from Evercore ISI commented on the weakened relationship between job growth and economic expansion due to potential long-run effects from AI adoption on white-collar labor markets.
There are signs of cautious confidence emanating from the European markets despite the global data risk. Yesterday’s trading session for European markets was neutral, but there were positive trends for auto stocks and luxury goods. This suggests that investors are looking to play value stocks until there is greater clarity about US policy and labor market trends. Even though BP stocks were impacted by the company’s halt to its share buybacks, which impacted the energy sector broadly, this was balanced by positive trends for auto stocks and luxury goods. This morning’s futures are a result of sector-wide push and pull factors but indicate resilience given favorable inflation trends in various European countries and positive surprises for regional economic data.
However, we think that the synchronized move between US and European futures is less a function of strong convictions and more a function of risk calibration. Traders are simply taking positions to remain flexible before a potentially important week for rate markets, inflation data, and the broader equity trend. As the CPI report is released on Friday, inflation pressures still remain within the services and rents data. The slow and grinding upward march of the futures suggests that markets are currently selective in their optimism, but the sentiment could shift quickly based on surprises within the labor data releases, Fed speak, and revisions to prior data. Traders seeking guidance should remain vigilant throughout the week, particularly as the delayed data drop compresses into fewer sessions.
Major Index Performance as of Wednesday, 11 Feb 2026
- The S&P 500 is trading at 6,969.98. This is down slightly on the session as narrow leadership and weakness in technology continue to weigh on overall participation.
- The NASDAQ Composite is trading at 25,251.45. This is down 0.56% on the session as enthusiasm for AI stocks continues to dissipate.
- The Dow Jones Industrial Average is trading at 50,336.99. This is up modestly on the session as industrials and defensive sectors continue to perform well.
- The Russell 2000 is trading at 2,681.11. This is relatively resilient as rate sensitivity continues to affect smaller caps.
The Magnificent Seven and the S&P 500

The Magnificent Seven stocks, consisting of Alphabet, Amazon, Apple, Meta Platforms, Microsoft, Nvidia, and Tesla, continue to face headwinds as investors reassess valuations and capital expenditures. As investors rotate into non-tech and defensive sectors, the Magnificent Seven have lagged the overall market. This has contributed to the weakness in the S&P 500 and NASDAQ Composite indices. These stocks still have significant weightings in the indices but are contributing to the overall weakness in the indices. This is because their underperformance is contributing to the overall weakness in the indices.
Drivers Behind the Market Move – Wednesday, 11 Feb 2026
The US and European markets are trading cautiously today as investors weigh delayed labor market data, changing fiscal policy expectations, and revived geopolitical and energy market narratives. The risk appetite, already impacted by softer US consumer data, has become vulnerable, as investors position ahead of key releases and political developments that can reset expectations on growth, inflation, and monetary policy.
1. Delayed US Jobs Data and Policy Expectations
The major market driver today is the anticipation of delayed US jobs data, including Non-Farm Payrolls, Average Hourly Earnings, and the Unemployment Rate. The markets have already factored in minimal jobs growth along with an increase in the unemployment rate, following flat retail sales yesterday. The combined impact of softer US jobs growth has revived the possibility of a deceleration in economic activity, thus fueling expectations of future monetary policy easing. In Europe, the markets are trading cautiously as the US jobs data remain the main market driver for global rate and currency markets.
2. Fiscal, Energy, and Tax Policy from the White House
President Trump’s latest policy announcements are also affecting market sentiment. The signing of the Congressional Bill S.269, the “no tax on tips,” “no tax on overtime,” and the increase of tax credits are all being viewed as consumption-oriented policies. However, the administration’s push to roll back the 2009 greenhouse gas emission standard and the focus on “clean coal” as a viable energy solution are changing the market’s view of the US energy production landscape. Energy producers are benefiting from these announcements. However, the impact of looser US environmental policies is causing the European markets to take a defensive posture as the possibility of more competition from the US increases.
3. Geopolitical Risk and Defensive Positioning
Geopolitical events are adding another dimension of uncertainty to the market. The administration is considering deploying a second US aircraft carrier to the Middle East. In addition, the administration is planning troop training missions in Nigeria. All of these events are adding to the demand for gold and bonds. The uncertainty is weighing on the market. However, the administration’s focus on US domestic security issues, such as the building of the border wall and immigration policy, is creating uncertainty that is causing investors to take a defensive posture.
We believe that the current market movements are a function of the intersection of labor market uncertainty, the administration’s active fiscal policy changes, and the rise of geopolitical risks. Until the US employment data is clearer, the US and European markets will continue to move sideways and will remain sensitive to market movements.
Digesting Economic Data
The TRUMP Tweets and Their Implications
The latest round of President Trump’s domestic policy announcements indicates a renewed effort to solidify a populist approach to economic policy, at least in the run-up to the next fiscal policy cycle. The signing of Congressional Bill S.269, as well as a vocal push from the White House to support voter ID laws and citizenship requirements, is creating a backdrop for increasing policy battles at the state level. While these decisions are clearly political in nature, they also suggest a desire to simplify benefits access as well as potentially limit access to economic programs, which could have a significant impact on household spending patterns as well as potentially further solidify labor trends among lower-income groups. The continued push for “no tax on tips,” “no tax on overtime,” and “no tax on Social Security” payments continues to resonate with middle- and working-class voters, and it is increasingly being interpreted by traders as a potential long-term indicator for a more consumption-friendly fiscal policy.
In terms of the energy markets, Trump’s reintroduction of the ‘clean coal’ initiative and subsequent plans to dial back the 2009 greenhouse gas emission finding represent a dramatic shift in market expectations. Investors are already beginning to adjust their expectations regarding fossil fuel production and infrastructure investment within the United States. In addition, as caps on these greenhouse gas emissions are likely to be raised, as Trump has signaled, expect to see investment dollars flowing back into these US-based companies. This could ultimately lead to a number of price realignments within these markets, especially if these changes are perceived to be aimed at disrupting OPEC’s production strategies. In addition, Trump’s threat to deploy a second aircraft carrier to the Middle East represents a new layer of geopolitical risk to these markets. In terms of immigration, housing, and tax policies, these are being woven together to represent a cohesive strategy to reset the US economy. Trump’s commitment to completing the border wall “under budget and ahead of schedule,” coupled with assertions that there have been zero instances of illegal border crossings during nine consecutive months, and subsequent increases to deportation rhetoric represent an attempt to align these shifts with an overarching desire to support American-made vehicles and housing. In addition, the press secretary’s assertions regarding mortgage conditions reaching a four-year high represent a cohesive attempt to address the economic fears of middle-class mortgage holders. This could ultimately lead to a number of real estate market shifts, especially as investors begin to anticipate these trends. In addition, Trump’s tax push to raise standard deductions and child tax credits positions the US to be more competitive with regards to cash flow-based stimuli strategies.
Lastly, the cultural and diplomatic approach of the administration continues to be extremely active. From defending the President against Epstein scandal charges to removing the Pride flag from the Stonewall Monument, the White House continues to make bold moves that are likely to energize their political base while creating significant backlash from institutional media outlets and activist groups. At the same time, announcements such as deploying troops to Nigeria to receive training, meeting with the President of Azerbaijan, and rushing to prevent a lapse in DHS funding highlight a White House that is eager to reassert American influence while shoring up domestic security infrastructure. As a result, what this means for investors is to remain prepared for volatile news events that can create short-term price swings in everything from defense contractors to energy producers to food manufacturers to even niche sectors like precious metals or agriculture imports, depending on which geopolitical lever is pulled next.
Credit Card Delinquencies Hit Cycle High, Exposing Consumer Stress Fault Lines
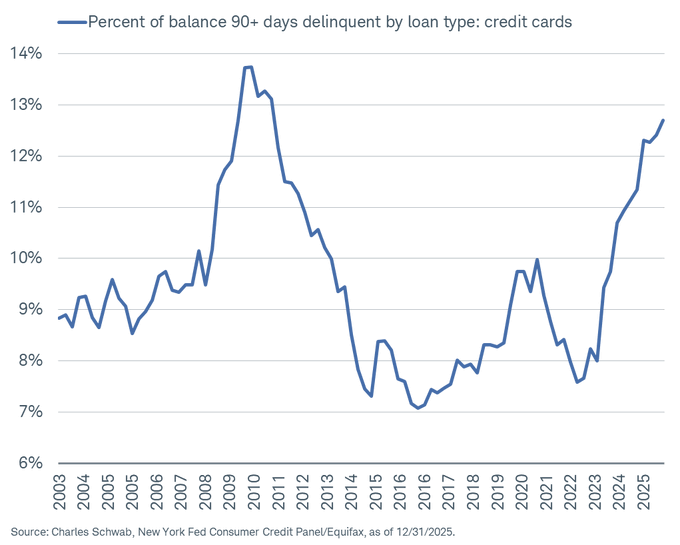
Recent data on consumer credit has indicated that the rate of serious delinquencies on credit card debt, defined as balances over 90 days past due, has risen to 12.7% in the final quarter of 2025. This is the same as the cycle highs we saw in the early 2010s as the economy adjusted to the financial crisis. This trend has risen sharply from the lows of 9% we saw in 2024. The speed of the move is important as it indicates that consumer balance sheets are feeling the effects of the economy, though the rate of debt expansion has only grown modestly.
The primary cause of the problem is the fact that borrowing costs remain high. Credit card interest rates, on average, remain above 20%, and the fact that everyday expenses remain high continues to crimp discretionary spending. As total debt has only grown by about 1%, or to about 18.8 trillion, early-stage delinquencies have also begun to rise in multiple categories of loans. This has historically presaged slower consumer spending as the balance sheet gets repaired. This trend has implications for the revenue of consumer-facing companies as we move forward.
As an investment, American Express appears to us to be undervalued on the basis of their long-term ability to generate earnings. The fact that they have an upscale customer base and stringent underwriting standards makes them more attractive than the mass-market lenders. Analysts will want to keep an eye on the rate of net charge-offs, the rate at which reserves are being built, and the rate at which cardmember spend is changing as an indicator of whether or not the problem of delinquencies is contained.
Small Business Capex Plans Slide Further, Suggesting a Tentative Domestic Growth Pulse
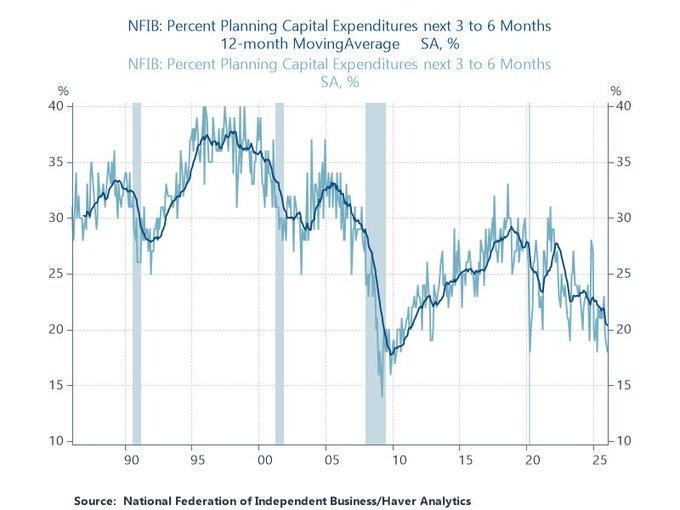
Small business capital expenditure plans have been declining continuously. As per the latest data from small business surveys, capital expenditure plans have declined to 18% in January 2026, the lowest since April 2025. This is a steady decline in capital expenditure plans by small businesses, even as the overall market remains focused on large-scale investment themes. The decline in capital expenditure plans by small businesses should be viewed as a tentative indicator of slower domestic economic growth.
From an economic perspective, small business capital expenditure plans are an early indicator of slower equipment demand, hiring trends, and overall regional economic growth. Small businesses are naturally more sensitive to interest rate movements and cash flows. As such, high interest rates are continuing to deter capital expenditure plans. As an aside, a slower capital expenditure plan by small businesses tends to impact overall order trends for industrial suppliers and temper the overall pace of domestic economic growth, even as large corporations continue to invest aggressively.
From our perspective, United Rentals appears undervalued relative to their relative earnings potential. As a supplier of rental equipment, United Rentals benefits from slower capital expenditure trends by firms and their preference for renting equipment on a short-term basis. As such, we encourage analysts to pay close attention to small business capital expenditure trends and overall small business confidence trends as well as overall trends in equipment utilization and rental demand trends to gauge the overall impact of slower capital expenditure by firms on overall rental trends.
December Retail Sales Flat, Control Group Down, Discretionary Demand Weakened
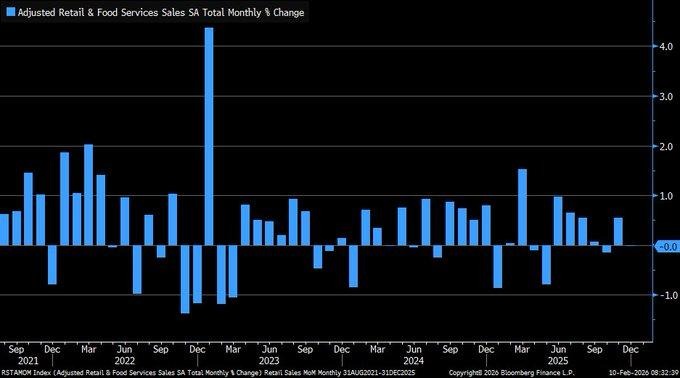
Retail sales for December came in flat at +0.0% month-over-month, down from the expected +0.4% and a previous +0.6% in the prior month. The details also showed weaker results, with sales excluding autos also coming in flat at +0.0% compared to the previous month’s +0.4% (revised from +0.5%). Most importantly, the control group, which gives us a better idea of real-world spending power, came in down -0.1% compared to the previous month’s +0.2% (revised from +0.4%).
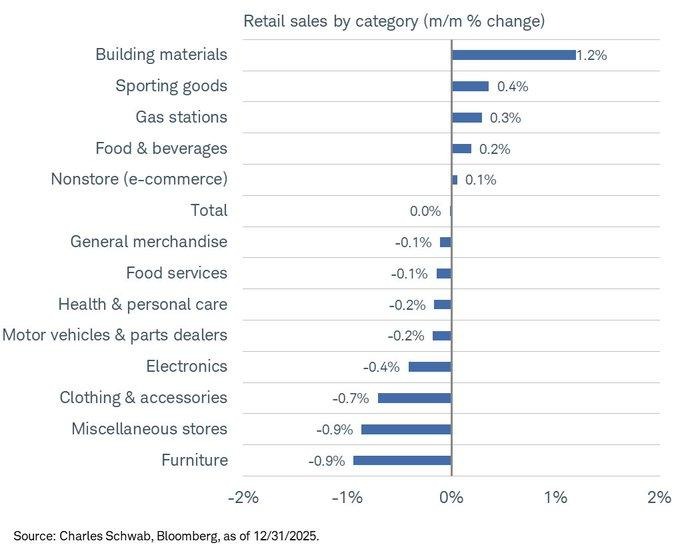
The sector breakdown shows us where the pressure is being felt. Building materials came in strong at +1.2% (same as the previous month’s +1.2%), followed by sporting goods at +0.4% (down from the previous month’s +0.9%), and e-commerce at +0.1% (up from the previous month’s 0.0%). However, motor vehicle and parts came in down -0.2% (down from the previous month’s +1.2%), followed by electronics down -0.4% (down from the previous month’s +0.2%), clothing down -0.7% (down from the previous month’s +0.5%), and furniture down -0.9% (down from the previous month’s -0.1%). This is the typical “selective spending” phenomenon, where people still spend on the essentials but cut back on the discretionary items first, which in turn puts pressure on discretionary earnings and increases the bar for price and promotion activity.
In such a scenario, we believe Walmart is a stock that is undervalued compared to its defensive demand profile and its ability to gain market share in the event of a trade-down in the market. Analysts should pay attention to traffic vs. ticket size, price gap investment commentary, and forward guidance on stress indicators for the consumer. If the control group continues to come in negative in the coming months, it could be a sign that the earnings surprise is skewed towards the defense winners and away from the discretionary losers.
Household Well-Being Drops, a Warning of Weak Confidence Going into 2026
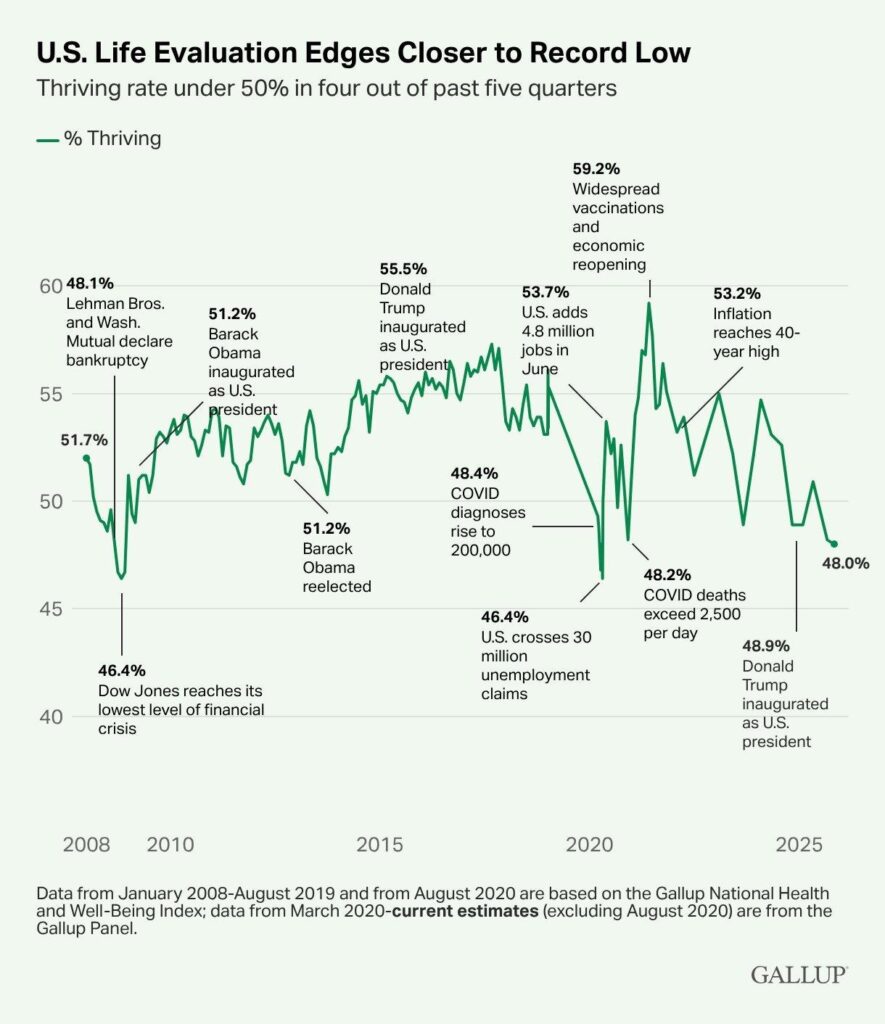
The latest data on national well-being shows that only 48% of adults were “thriving” in the last quarter of 2025. This means that they rated their current and future life high. This is the weakest reading outside of two stress periods in the last two decades. This shows a sharp decline in household well-being and optimism heading into 2026. This is important because it measures not only the current financial condition of the household but also their future confidence.
From a business perspective, a decline in well-being metrics translates to increasing household caution. This means that when the number of people who feel confident about their current and future state declines, their spending also declines. This does not immediately mean that the economy will contract, but it does mean that the growth in spending will be lower. This also means that the pressure on the earnings of companies will increase. This is because the people who spend the most money will be the ones who feel the least confident about their future. A decline in household confidence has historically preceded a period when revenue growth becomes difficult to maintain without promotions and cost cuts.
Based on the above analysis, Procter & Gamble is a company that is undervalued in relation to its defensive earnings and demand. This is because when households become less confident and start to spend money, they tend to buy the essentials. This means that companies with strong brands and the ability to maintain high prices will benefit. What analysts need to be concerned about is the trend in volumes and the ability of the company to maintain its prices.
Equity inflows are rising while high-yield credit is seeing outflows
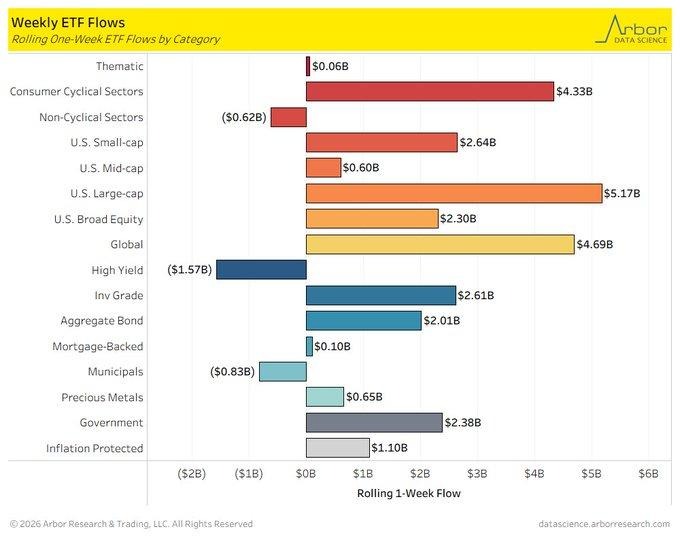
According to recent fund flow data, equities are seeing a strong preference among investors, with large-cap stocks being the top inflows category, followed by global equities and consumer cyclical sectors. Conversely, high-yield credit saw the largest outflows, while the fixed income space as a whole remains positive. The contrast is a clear indication that investors are taking a selective approach to risk as they are comfortable investing in equities due to their high perceived earnings durability but are becoming increasingly nervous about high-yield credit despite stable credit spreads.
This is an important credit market dynamic as equities are seeing inflows while high-yield credit is seeing outflows. The relationship between high-yield credit and equities is weakening significantly, with a decline in correlation from +0.84 over a 90-day window to +0.48 over a 30-day window. Historically, this type of decoupling is a good sign that credit investors are becoming more nervous about downside risks than equity investors are. The fact that credit is seeing outflows while equities are seeing inflows is a good sign that credit investors are becoming more nervous about balance sheet stresses and late-cycle risks that have not yet been discounted by equities.
In this backdrop, Microsoft is a stock that appears undervalued compared to its earnings and balance sheet characteristics and is a stock that will continue to see inflows even as credit conditions become more difficult due to its position as a large-cap leader with high cash flow durability and minimal need for external financing sources.
Rising Unemployment Fears Signal Cautious Consumer Behavior Ahead
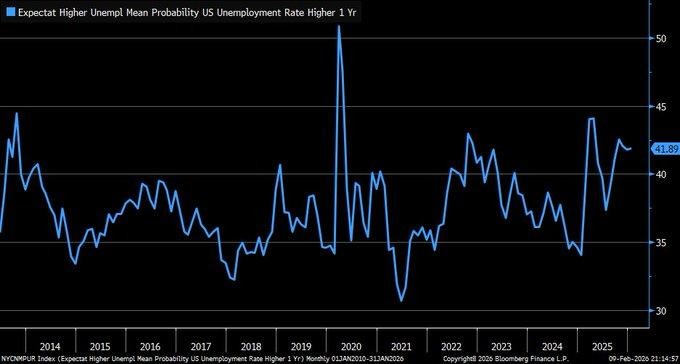
As per recent consumer expectation figures, an average of nearly 42% of households are expecting unemployment to be higher in the coming year. This increase in unemployment fears is an indication that households are becoming increasingly cautious about their economic situation. This figure has remained high despite recent employment figures not reflecting a sharp increase in unemployment.
In economic terms, when unemployment fears rise, households tend to become cautious about their expenditure. This cautious approach usually results in lower discretionary spending. It also results in lower savings. This phenomenon usually happens when households are not confident about their employment situation. This phenomenon usually acts as a restraint on economic growth. This restraint usually happens because households are expecting a higher unemployment rate in the coming year. This phenomenon usually happens gradually. This phenomenon usually happens because of a lack of awareness about its impact on the stock market.
In the current scenario, Costco Wholesale appears to be undervalued. This is because the company enjoys a strong demand position. It also enjoys strong earnings visibility. This is because when unemployment fears rise, households tend to consolidate their expenditure on those retailers that offer strong value. This phenomenon usually happens because households tend to become cautious about their expenditure when unemployment fears rise. This phenomenon usually happens because households are expecting a higher unemployment rate in the coming year. Analysts need to keep a close eye on membership renewal rates.
Upcoming Economic Events
Average Hourly Earnings m/m, Non-Farm Employment Change, Unemployment Rate
As financial markets continue further into February, focus is building on a significant set of U.S. labor statistics due to be released later this week. The trio of average hourly earnings, non-farm employment change, and the unemployment rate will have a significant bearing on investor sentiment with regards to future inflation dynamics, consumer resilience, and Fed policy decisions. Although inflation statistics have shown early signs of a slowdown over recent months, labor market uncertainty remains at an all-time high, and markets are currently at a juncture where every move is crucial.
Average Hourly Earnings m/m
Wage inflation is a crucial factor that is closely watched by investors with regards to inflation dynamics.
- A stronger than expected reading for average hourly earnings will cement investors’ expectations that labor costs are continuing to grow at a rate that is not consistent with 2% inflation targets. This will have a significant impact on Treasury yields as investors will expect interest rates to be raised for a longer period than previously anticipated.
- Equally, a weaker than expected reading for average hourly earnings will suggest that labor costs are not a factor that will trouble the Fed as it formulates interest rate decisions for later this year. Growth stocks will also benefit from a weaker than expected reading for average hourly earnings.
Non-Farm Employment Change
The payrolls figure still represents the broadest indicator of labor demand in the US economy.
- If the jobs figure comes in higher than expected, particularly in the service and manufacturing industries, it would be seen to further validate the notion that the economy remains healthy despite the high interest rates. While such a strong jobs number could give the stock market a temporary lift, it could also delay any potential rate cuts as policymakers would be concerned about the acceleration in the labor market.
- Alternatively, if the non-farm employment change comes in weaker than expected, it could be seen as an early sign that the business community is starting to slow down the hiring pace in anticipation of weaker economic growth in the coming quarters. This could cause the bond market to rally further, while the stock market could see the leaders in the market rotate to the defensives such as the healthcare, staples, and utilities sectors.
Unemployment Rate
The unemployment rate completes the picture with respect to the labor market, reflecting the broader participation rate in the US economy.
- If the unemployment rate falls further than expected, it would be seen to further validate the notion that the US labor market remains tight, which in turn could accelerate wage growth and complicate the inflation picture. This could further delay any potential rate cuts and limit the upside in the stock market.
- Alternatively, if the unemployment rate rises, it would be seen to validate the notion that the economic slowdown is finally starting to impact the labor market, which is one of the factors the Federal Reserve has been looking for to change its stance on monetary policy. This could cause the bond market to rally further, while the stock market could see some near-term volatility, particularly in the discretionary and financial stocks that are sensitive to the income levels in the US economy.
At Zaye Capital Markets, we believe that the labor data release is one of the most important of the Q1 2026 schedule. Not only does it dictate the inflation path and the Fed’s reaction function, but it also determines the longevity of current corporate earnings models. As such, investors need to prepare themselves for the volatility that is likely to ensue, especially if the three metrics produce mixed results. If the three metrics produce the same results, then the Fed would likely take a dovish stance. On the other hand, if job creation continues to thrive and wage growth accelerates, rate cuts would likely be priced in, and current valuations would be put to the test.
Stock Market Performance
Indexes Bounce Back from April 2025 Troughs, but Internal Member Level Drawbacks Continue to Weigh Heavily
While U.S. stock indexes have rebounded strongly off their April 8, 2025, troughs, their year-to-date performances in 2026 show a lackluster advance with large internal drawdowns continuing to affect average constituent level performances. While indexes continue to advance, underlying participation remains low, and average member level drawdowns continue to highlight underlying weaknesses that cannot be ignored.
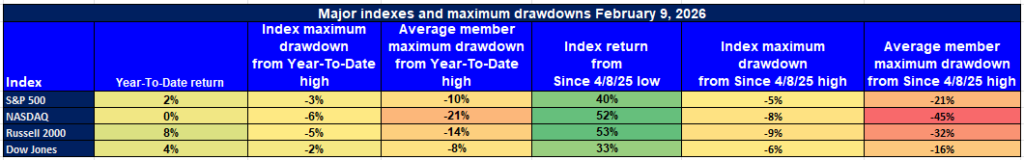
Below is our latest update on major index performances, strictly based on current figures as of February 9, 2026:
S&P 500: Index Advances with Substantial Internal Volatility
YTD: +2% | +40% off April low | -3% off YTD high | Avg. member: -10%
The S&P 500 index has registered a strong advance in 2026, rising by 2%. It has also gained 40% off its April 2025 trough. However, average constituents have fallen by -10% off their peaks, while the index itself has fallen by -3%.
NASDAQ: Index Advances with Substantial Internal Losses
YTD: 0% | +52% off April low | -6% off YTD high | Avg. member: -21%
The NASDAQ index has registered a lackluster advance in 2026, with a flat 0% return year to date. However, it has gained 52% off its April low. The -6% drawdown off its recent peaks might not seem serious, but average member losses of -21% are a cause for concern.
Russell 2000: Small Cap Strength on Paper, Stress Underneath
YTD: +8% | +53% off April low | -5% from YTD high | Avg. member: -14%
The Russell 2000 Index is currently leading all major stock market indexes with an 8% YTD return and a 53% gain since the April low. However, the -5% drop since the YTD high and -14% average member drawdown indicate that small caps are still extremely susceptible to changes in liquidity and general market sentiment.
Dow Jones: Modest Return, Lower Volatility Profile
YTD: +4% | +33% off April low | -2% from YTD high | Avg. member: -8%
The Dow Jones Index has gained 4% YTD and risen 33% since last year’s low. Its modest -2% drawdown since the YTD high and lower average member loss of -8% are a result of the index’s sector composition. While the Dow Jones Index is not currently leading the market, its higher quality return profile so far in 2026 is an encouraging signal.
As always, at Zaye Capital Markets, we are focused on the importance of participation breadth in determining the sustainability of current stock market rallies. Index strength still depends on narrow participation, while average member losses indicate the true undercurrent of risk aversion in the market.
The Strongest Sector in All These Indices
Energy Leads 2026 with Double-Digit Gains, Reinforcing Sector Rotation Themes
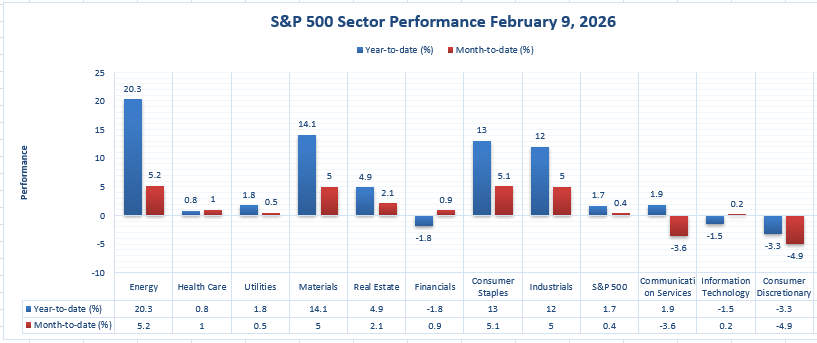
As of February 9, 2026, the Energy sector is the performance leader in the S&P 500, beating out the rest of the pack in both year-to-date and month-to-date performance. Not only is the sector the leader, but it is also doing so with consistency, a rare phenomenon in the current macro environment where sector rotation is happening at an unprecedented pace.
What’s notable is the consistency in the performance; it’s not just a blip on the radar screen for the sector, and it’s not just a one-week wonder. The sector’s year-to-date performance of +20.3% is clearly in front of the rest of the pack, including the Material sector at +14.1% and the Consumer Staples sector at +13.0%. Even in the month-to-date performance, the sector continues to push higher, rising 5.2% in February to a level that’s very similar to the top-performing month-to-date stocks, including the Industrials sector at +5.0% and the Consumer Staples sector at +5.1%.
Several factors are contributing to the strong performance in the sector, including the high oil prices and the strong balance sheet position of the large-cap energy companies. Another contributing factor is the ongoing demand for real asset exposure in the face of inflation risk and global events. From our perspective at Zaye Capital Markets, the ability to generate cash, pay dividends, and maintain a strong capital management strategy is clearly attracting investors to the sector, both institutional and individual investors. While volatility is always a part of the sector, we continue to believe the sector is the technically and fundamentally strongest sector in the market in 2026 to date.
Earnings
Yesterday’s Earnings Recap – February 10, 2026
- Cloudflare, Inc. reported Q4 2025 revenues of $614.5 million, an increase of 33.6% year-over-year, while its GAAP gross profit was $452.6 million and gross margin was 73.6%. The non-GAAP gross profit was $460.2 million and gross margin was 74.9%. The non-GAAP income from operations was $89.6 million and operating margin was 14.6%. Adjusted EPS was $0.28, while GAAP net loss was $12.1 million. The company reported full-year 2025 revenues of $2.17 billion, an increase of 29.8%. The company reported increased demand for its cloud security services.
- Ford Motor Company reported Q4 automotive revenues of $42.4 billion and total revenues of $45.9 billion, a decrease of 5% year-over-year. Adjusted EBIT was $1.0 billion, while adjusted EPS was $0.13. Net losses came in at $11.1 billion due to charges and special items related to its Electric Vehicle business. The company reported full-year 2025 revenues of $187.3 billion, an increase of 1%. Adjusted EBIT was $6.8 billion, while net loss was $8.2 billion.
- Ecolab Inc. reported Q4 revenues of $4.2 billion, an increase of 5% year-over-year. Organic revenue grew by approximately 3%. Reported diluted EPS increased to $1.98, an increase of 19%. Adjusted diluted EPS was $2.08, an increase of 15%. Operating margins increased to 17.0% reported and 18.5% organic. The company reported full-year revenues of $16.08 billion, profit of $2.08 billion, and diluted EPS of $7.28.
- S&P Global Inc. reported Q4 revenue of $3.916 billion, an increase of 9% year over year. The company reported an adjusted net income of $1.299 billion and an adjusted EPS of $4.30. Both were 14% higher than the prior year. Adjusted operating profit was reported to be $1.852 billion, resulting in a 47.3% margin. For the full year 2025, the company reported a revenue of $15.336 billion, an increase of 8%. GAAP net income was reported to be $4.471 billion, and adjusted net income was reported to be $5.441 billion.
- The Coca-Cola Company reported Q4 net revenues of $11.82 billion, an increase of 2% year over year. Organic revenue increased 5%. The company reported an EPS of $0.53, an increase of 4%. Comparable EPS increased to $0.58, an increase of 6%. Unit case volume increased 1%, showing steady demand. Revenues were reported to be $47.9 billion for the full year 2025, an increase of 2%. Reported EPS increased to $3.04, and comparable EPS increased to $3.00.
- Barclays Plc reported a profit before tax of £1.9 billion in Q4, an increase from £1.7 billion. Total income was reported to be approximately £7.1 billion, showing a 2% increase in revenue. Profit before tax increased to £9.1 billion in the full year 2025, an increase of 12% from 2024. Total income was reported to be £29.14 billion, with an earnings per share of 43.8p and a return on tangible equity of 11.3%.
Today’s Earnings Preview – February 11, 2026
- Earnings of TotalEnergies SE are expected to show the impact of the latest volatility in energy prices on upstream margins and downstream refining profitability. Focus will be on free cash flow, dividend payability, and capital allocation discipline due to changing global supply dynamics.
- Shopify Inc. Class A will provide insight into conditions within digital commerce via merchant growth, payment volume trends, and subscription revenue growth. Focus will be on small business resilience, international growth, and operating leverage within a more cautious consumer environment.
- T-Mobile US Inc. is due to report earnings which will highlight postpaid subscriber additions, churn rates, and network monetization. Focus will be on pricing discipline, customer retention, and profitability of 5G investments.
- EssilorLuxottica S.A. earnings will provide insight into premium discretionary spending trends, especially within eyewear and optical retail. Focus will be on volume growth, regional demand resilience, and margin resilience within developed markets.
- AppLovin Corp. Class A will be evaluated on mobile advertising revenue growth, platform monetization trends, and user engagement. Guidance will be a key driver to assess overall digital advertising trends within 2026.
- McDonald’s Corp. earnings are due to highlight same-store sales growth trends, customer traffic, and pricing power. Focus will be on value promotion trends and inflation within consumer behavior trends.
- Cisco Systems Inc. will provide insight into enterprise networking trends, security revenue growth, and backlog trends. Focus will be on guidance as a driver for enterprise IT spending trends.
At Zaye Capital Markets, we view today’s earnings slate as a critical test for consumer resilience, enterprise investment appetite, and margin sustainability. Guidance and demand trends will be more important than earnings as markets assess whether growth momentum is expanding or continuing to narrow.
Stock Market Overview – Wednesday, 11 Feb 2026
The U.S. stock markets opened on Wednesday with a mixed tone, driven by a combination of weaker macroeconomic reports, weakening consumer demand indicators, and a continued rotation away from traditional technology leadership. Following a recent surge in smaller-cap stock groups, the major stock indices have opened with a somewhat cautious tone as investors continue to digest weaker retail sales reports and overall profit momentum indicators. At Zaye Capital Markets, we continue to monitor how retail investors and credit markets are impacting sector leadership and index concentration as we approach mid-February.
Stock Prices
Economic Indicators and Geopolitical Developments
The stock markets continue to reflect investors’ concerns as anxiety mounts over weaker consumer spending reports released in December, as well as concerns about unemployment. Interestingly, both the S&P 500 and Nasdaq indices have retreated somewhat following weaker retail sales reports coupled with increasing labor market concerns. As a result, many investors have begun to reduce their exposure to technology stocks, which have been among the strongest performing sectors during recent months. Moreover, recent patterns in money flows suggest that investors continue to favor equities, while high-yield debt is seeing outflows, even as these stock indices remain at key levels. The U.S. yield curve has also fallen as investors increasingly price in a greater probability of rate cuts later in the year in response to weaker economic reports. Geopolitical risks, including currency fluctuations, continue to create uncertainty for U.S. stock markets as well.
Latest Stock News
TSM reported a January revenue figure of $12.7B, a 37% YoY increase, well ahead of its full-year growth rate projection of about 30%. The company also announced a $30B capital injection plan and a $1.9B bond issue to fund expansion, further emphasizing a strong demand environment for advanced node chip technology.
NBIS (Nebius) is acquiring Tavily for $275M to incorporate real-time search infrastructure into its AI stack. This represents a shift from infrastructure to full AI agent tooling, as it now owns both the reasoning layer (Token Factory) and the grounding layer (Tavily).
Tesla drivers in Oregon are eligible to get up to 50% insurance discounts through Lemonade using FSD (Supervised). This incentivizes the use of autonomous driving capabilities with expansion plans in progress.
HOOD reported its first sequential decline in assets under custody since September 2023. Its AUC fell below $87B.
NET reported its strongest RPO growth in over three years, up 48% YoY. This confirms Cloudflare’s role as a control layer AI infrastructure provider. It now joins other AI platforms that are scaling agent access layers.
AMZN announced a 5% stake in eVTOL company Beta. It also received FCC approval to launch 4,500 satellites to provide broadband services through Project Kuiper. Its sum-of-the-parts analysis indicates that its current market cap of $2.2T undervalues its underlying businesses. A price target of $250 could be reasonable.
PLTR extended its partnership with Airbus through a $1B deal over 10 years on Skywise. Its AIP architecture will be integrated into global airlines. This represents a fundamental step toward AI monetization.
Growth Stock Momentum
Growth stocks experienced a strong day on Tuesday. AI stocks, crypto infrastructure stocks, and next-generation stocks saw significant growth. The biggest winners were:
- APP +18%
- WULF +17%
- ALAB +15%
- CIFR +15%
- RBLX +11%
- IREN +11%
- CRDO +11%
- SHOP +10%
- QS +10%
- CRML +9%
- PL +8%
- EOSE +8%
- NBIS +8%
- UUUU +8%
- CRWV +8%
- RBRK +7%
- PLTR +6%
- ONDS +6%
This breakout is a confirmation of investors’ appetite for early-cycle AI platforms, tokenized infrastructure, and real-asset exposure. The momentum is concentrated in stocks related to agent tooling, next-gen compute, and applied autonomy.
The Magnificent Seven and the S&P 500
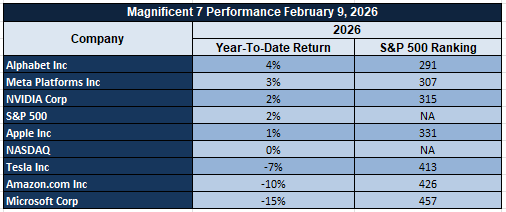
The Magnificent Seven stocks, consisting of Alphabet, Amazon, Apple, Meta Platforms, Microsoft, Nvidia, and Tesla, continue to face headwinds as investors reassess valuations and capital expenditures. As investors rotate into non-tech and defensive sectors, the Magnificent Seven have lagged the overall market. This has contributed to the weakness in the S&P 500 and NASDAQ Composite indices. These stocks still have significant weightings in the indices but are contributing to the overall weakness in the indices. This is because their underperformance is contributing to the overall weakness in the indices.
Major Index Performance as of Wednesday, 11 Feb 2026
- The S&P 500 is trading at 6,969.98. This is down slightly on the session as narrow leadership and weakness in technology continue to weigh on overall participation.
- The NASDAQ Composite is trading at 25,251.45. This is down 0.56% on the session as enthusiasm for AI stocks continues to dissipate.
- The Dow Jones Industrial Average is trading at 50,336.99. This is up modestly on the session as industrials and defensive sectors continue to perform well.
- The Russell 2000 is trading at 2,681.11. This is relatively resilient as rate sensitivity continues to affect smaller caps.
We continue to maintain that this is a selective risk-on market. The rotation into technology and high volatility stocks continues to be driven by tech volatility. Consumer sentiment is cautious as investors remain nervous about earnings guidance.
Gold Price: What’s Driving Gold Prices Above $5,000 Amid Policy Shifts and Labor Market Uncertainty?
Currently, spot gold prices are ranging between $5,025 and $5,060 an ounce as it continues to hold above the psychological price level of $5,000 an ounce. At Zaye Capital Markets, we believe the recent surge in the price of gold is due to the convergence of two major factors: the recent fiscal and regulatory announcements made by the White House, as well as the expectations of the critical labor data releases due later today. The recent fiscal policies rolled out by the administration, including the formal reversal of the 2009 Greenhouse Gas Finding, the border wall pledge, as well as the recent tax reform package targeting middle-income Americans, have created political tension in the discussion of the environment and the economy. The recent geopolitical events, including the consideration of deploying troops to Nigeria, the rising tensions in the Middle East, as well as the recent debate over the funding of the DHS budget, have all served to reinforce the value of gold as a risk hedge against geopolitical risk. Furthermore, the upcoming releases of Average Hourly Earnings, Non-Farm Payrolls, as well as the Unemployment Rate, serve as a hedge against the possibility of disappointing labor data releases later today, which could be interpreted as a reason for the Fed to ease earlier than expected.
The weaker-than-expected retail sales and consumer sentiment data from yesterday have already been priced in the markets, thereby confirming that the weakening of demand is starting to filter through the overall economy. The yield on the 10-year Treasury is pulling back, and gold is rising further on the back of the compression of real yields and the weakening of the labor market. The overall tone of the economic data releases, coupled with the administration’s push to reduce energy costs and middle-class taxes, is further reinforcing the notion that the overall policy response is geared toward providing stimulus to the economy. We have a favorable setup for gold, with weaker economic data ruling out any rate hikes, geopolitical tensions supporting gold on the safe-haven front, and the overall policy response providing stimulus to the economy. We at Zaye Capital Markets believe that we are witnessing a structural move in the gold price, where gold is no longer rising on the back of fear-based cycles but is instead rising on the back of a broader macroeconomic regime that is characterized by soft labor markets, unanchored policy trajectories, and the overall need for stability in hard assets. Unless we witness a strong upside surprise in the labor markets or the dollar rises significantly, we expect gold to remain firm above the $5,000 mark as a strategic play for risk-conscious investors through the early part of Q2 2026.
Oil Prices: Why Are Oil Prices Holding Near $65 as Military Tensions and Jobs Data Shape Demand Forecasts?
As we write this report on Wednesday, February 11, 2026, Brent crude oil is holding steady at $69.03 per barrel, while WTI oil is holding near $64.19. As we observe at Zaye Capital Markets, investor appetite in the oil market is once again put to the test as a function of rising global oil stockpiles and escalating policy tensions in global economies. Recent comments from the White House, such as confirming a second U.S. aircraft carrier deployment to the Middle East, clean coal as an answer to domestic energy costs, and even military training in Nigeria, have contributed to market jitters about supply risks in oil shipping lanes such as the Strait of Hormuz. At the same time, yesterday’s soft U.S. retail sales and persistently high unemployment expectations have taken a toll on demand forecasts, which have put pressure on oil-linked shares. Although such economic data may be an overall negative force in shaping demand forecasts, it is a positive indicator of a higher likelihood of a rate cut by the U.S. Federal Reserve, which would be beneficial to oil prices as a function of real interest rate suppression. And then there is the IEA’s latest upward revision to global oil demand forecasts for 2026, which has kept oil prices holding near $65 as a function of supply risks and demand pressures.
Looking forward, the upcoming release of labor market figures for Average Hourly Earnings, Non-Farm Payrolls, and the Unemployment Rate will likely be what sets off the next leg for oil markets. A miss on payroll figures or slowing wage growth will simply reinforce the Fed’s recent tone and support the macro case for easier financial conditions. In turn, this should support commodity markets. On the flip side, a beat on payroll or wage growth could re-boost demand forecasts and potentially break oil out of its recent consolidation. In terms of structural factors driving oil markets, the OPEC+ production restraint and unplanned production outages in Nigeria and Libya are providing a slow-burning support to oil prices. This has been augmented by recent White House initiatives to promote American-made energy and scaled back environmental regulations. We are currently referencing these factors as a three-pillar framework for oil price discovery: geopolitical volatility, policy-linked stimulus, and labor market trends. In short, until one of these factors breaks—either through a shift in demand or a shift in supply—oil markets are likely to be range-bound but highly reactive to any given data release.
Bitcoin Prices: Why Bitcoin Falls Below $68K as Market Players Weigh Data Risks and Geopolitics Policy
Bitcoin is trading at $67,370, based on Coinbase exchange data as of February 11, 2026, as it extends its correction, which has seen it fall by over $20,000 from January highs. This development confirms the technical analyst’s long-standing view of the asset having a weak structure with low conviction and increased selling pressure, particularly after the volatile washout experienced in early February. The recent trading behavior of the asset indicates further weakness as it fails to hold above key psychological levels such as $70,000 and even above support levels. At Zaye Capital Markets, we believe this is not an indication of a structural issue, as it might seem, but rather a natural cooling process of the consolidation cycle, which is largely influenced by macro factors. Market players are awaiting today’s release of United States labor market statistics, which will include Non-Farm Payrolls and Unemployment Rate, which will set the tone for other assets as well as Bitcoin. A positive release will likely result in a temporary relief rally, considering it will be an indication of economic growth; however, any negative surprises will likely add to the bearish momentum, considering technical indicators are already depressed.
Meanwhile, the aggressive economic policies and defense strategies emanating from President Trump’s administration are adding layers to the short-term catalysts available to Bitcoin. For instance, the “no tax on overtime” promise, auto-loan interest deduction support, and the pursuit to increase standard deductions may be beneficial to the middle class, but they are not providing the much-needed catalyst to enter the cryptocurrency space. On the global scene, the increasing military rhetoric from the Trump administration, including the potential deployment of a second carrier to the Middle East and involvement in Nigeria, is causing investors to seek safer havens such as gold. The much-needed regulatory environment to guide investors on the cryptocurrency space is conspicuous by its absence in the administration’s busy policy agenda this week. The disappointing retail sales figures reported yesterday are adding to the overall defensive sentiment, causing investors to move out of high-volatility assets such as cryptocurrency. Unless today’s economic figures provide a surprise, Bitcoin may continue to consolidate not in terms of explosive growth but in terms of expectation paralysis.
ETH Prices: Why Is Ethereum Sliding Near $2,000 Despite Whale Buying and ETF Flows?
Ethereum (ETH) is currently trading around $2,000 per coin, reflecting a significant pullback from recent highs around $2,400. This move has solidified the recent near 14% weekly decline. The recent decline in Ethereum can be attributed to outflows from major spot Ethereum ETFs as well as the overall market decline. Despite recent inflows into Ethereum products—around $57 million in new capital into Fidelity and Grayscale Ethereum products last week—this trend is overshadowed by the recent trend of outflows from Ethereum products, totaling over $3.3 billion in recent months. Market participants are interpreting this as a hesitant rebound, where every bullish indicator is being met with even greater bearish signals. According to on-chain data, retail investors have stepped back from the market, leaving the price action to the dominant players. Despite the recent decline in Ethereum, whale wallets have accumulated over 520,000 ETH between February 4th and 8th, indicating strategic buying around current levels. These players are positioning for a potential rebound in the cryptocurrency market as they expect that macro conditions—especially a softer inflation read—will swing the market back in their favor.
This price zone now serves as a key test for the future direction of Ethereum. The softer labor data and inflationary pressures from yesterday’s data are causing a significant rebalancing across the institutional asset base, with many investors fleeing high beta assets like ETH for safe havens. The aggressive push by President Trump for rolling back climate change policies and supporting the energy sector could potentially benefit Ethereum miners within the US, particularly with clean coal and deregulated energy prices being prioritized. This would ease the strain on validators for the ETH network. In the near term, however, price action is dominated by ETF flows and macro data. Wage growth and jobs data released today could cause another leg lower for the price if the data surprises to the upside, as it would cause traders to price in a more hawkish Fed stance. If the data disappoints, however, it could cause a rebound for crypto prices. At Zaye Capital Markets, we view the price action for Ethereum currently as being caught within a liquidity squeeze, where whale accumulation, ETF flows, and macro data create a volatile triangle that could cause significant breakouts or breakdowns depending on the data released throughout the week.
