Market Today
European and US futures are trading lower on Thursday, indicating uncertainty in all markets around the world. Dow futures are currently down by 22 points or 0.04%, while S&P 500 and Nasdaq 100 futures are slightly lower by -0.06% and -0.2%, respectively. European futures are also trading lower by similar percentages on all major indexes. This uncertainty is being driven by Wednesday’s volatile trading session on Wall Street, where the Dow Jones Industrial Average fell by more than 66 points. Despite yesterday’s positive jobs numbers for January, which showed 130,000 jobs created and unemployment falling to 4.3%, futures traders are taking a cautious approach ahead of Friday’s inflation numbers that could rewrite interest rate expectations.
The jobs numbers gave traders some relief yesterday by proving that the labor market is alive and kicking and that the threat of a jobs freeze is not yet here. However, this also had the negative impact of taking some of the steam out of interest rate cut expectations since inflation is still high and might not come down anytime soon. If inflation is still high, the Fed might not see the need to cut interest rates anytime soon since it would not address inflation anyway. Wednesday night saw Cisco shares fall by more than 7% in extended trading hours after the company gave weak forward-looking numbers, while McDonald’s shares fell despite beating analysts’ expectations with its latest earnings numbers.
In Europe, the same themes are continuing to weigh on sentiment. Export-oriented companies, as well as industrial companies that are tied to global demand, are under pressure as investors continue to think through the implications of fewer rate cuts in the U.S., an important trading partner. Energy is again a concern, with corporate commentary across major companies in Europe taking on a somewhat defensive tone over the last few sessions. As such, European futures are again mirroring the U.S. markets’ hesitation, especially with the release of the U.S. Consumer Price Index (CPI) looming large on Friday. If the CPI shows inflation pressures easing, perhaps that will reset the expectation of rate cuts. However, if that is not the case, perhaps we will continue to see markets stuck in this state of strength with no clear direction. The upcoming release of the U.S. Consumer Price Index and jobless claims is certainly an important data point, especially with the Federal Reserve’s dual mandate of price stability and full employment. As Tom Lee, co-founder of Fundstrat Global Advisors, told CNBC, the upcoming release of the CPI on Friday is now the “hinge” for confidence. Strong jobs data is certainly helpful, but if inflation is not brought under control, the Fed’s hands will be forced. At Zaye Capital Markets, we believe today’s cautious action in the futures is indicative of the growing tug of war between growth and inflation. Until the upcoming release of the inflation data on Friday, we will likely continue to see European and U.S. futures trading with a somewhat defensive tone, caught between solid economic growth and the increasing grip of rate policy uncertainty.
Major Index Performance as of Thursday, 12 Feb 2026
- S&P 500: Trading at 6,941.45, flat, with narrow leadership and tech fragility.
- Nasdaq Composite: Trading at 23,066.47, down ~0.6%, as AI momentum cools.
- Dow Jones Industrial Average: Trading at 50,121.40, up 0.2%, as defensives and infrastructure boost.
- Russell 2000: Trading at 2,668.47, holding firm as small-caps find footing in cyclical rotation.
The Magnificent Seven and the S&P 500

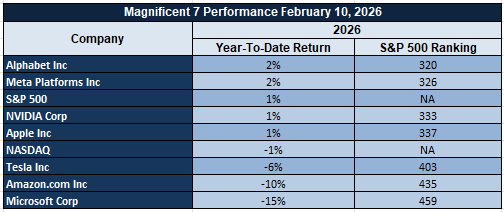
The “Magnificent Seven,” which comprises Apple, Microsoft, Nvidia, Amazon, Meta Platforms, Alphabet, and Tesla, is still under pressure. Until this week, these seven stocks have declined by 15-18% from recent highs, with Tesla and Meta Platforms leading the pack due to margin pressure and revenue concerns. Microsoft and Alphabet have faced overhangs related to valuation, whereas Amazon’s rise in infrastructure investments has led to new capital expenditure concerns. Nvidia and Apple have seen rotation due to moderation in demand. Until now, these seven stocks were driving most of the moves in the S&P 500, and now they are putting pressure on breadth. Until there is an improvement in breadth with new leadership or earnings momentum from other sectors, upside potential is limited.
Drivers Behind the Market Move – Wednesday, February 12, 2026
The U.S. and European markets have a lot to process following a fresh batch of economic data, policy changes, and energy-related directives from global leaders. As investors try to make sense of the current situation, it is a delicate balance of factors, ranging from robust employment data to recalibrated monetary policy expectations, as well as geopolitical events influencing energy and inflation markets.
1. Strong U.S. Jobs Data Shakes Rate Cut Hopes
The recent U.S. nonfarm payroll report for January saw a surprising gain of 130,000 jobs, defying economists’ expectations. The U.S. unemployment rate fell to 4.3%. This report has alleviated concerns of a weakening labor market but has added a layer of complexity for the Federal Reserve, which is now faced with a stronger-than-expected performance of the U.S. economy. This has forced investors to reevaluate rate cut expectations, causing yields to increase and equity markets to reevaluate valuations, especially for rate-sensitive sectors like technology and consumer discretionary. While this is a positive for risk assets, it is a negative for the Fed’s policy flexibility.
2. Trump’s Coal-Driven Energy Pivot Adds Inflation Risk
The new executive order from President Trump to the Defense Department to focus on coal-based electricity contracts and the subsequent allocation of funds from the Energy Department for upgrades to coal plants have sparked renewed debate on the cost of energy in the United States. The Trump Administration described the new policy on coal as a national security and grid reliability initiative called “mission assurance” for the military and emergency services. The shift in focus to a more expensive form of energy may impact baseline inflation expectations. The impact of energy prices on the overall cost of goods and services will have a significant impact on the stock market. The shift in focus to a more expensive form of energy will have a significant impact on the stock market. The shift in focus to a more expensive form of energy may impact baseline inflation expectations. The shift in focus to a more expensive form of energy will have a significant impact on the stock market.
3. Inflation Data Looms Large Ahead of CPI Release
The focus of the stock market is on the Consumer Price Index (CPI) data scheduled for release on Friday. The data will either confirm the assumption of the Fed and others that the rate of inflation is slowing down or will reinforce the assumption of the Fed and others that the rate of inflation is not slowing down. The weekly jobless claims data released today and the U.K. GDP data scheduled for release in the coming days are important data points in determining the course of action for the Fed and the Bank of England. If the data on inflation is higher than expected, the stock market may see another leg up in yields and a rotation out of high growth assets. If the data on inflation is lower than expected, it will provide support to the renewed optimism in the stock market and the assumption of the Fed and others of easing in the middle of the year.
In conclusion, the stock market is in a cautious and bifurcated phase due to the impact of the strong labor data from the United States, the new risks of higher inflation from the new energy policy of the Trump Administration, and the upcoming data on inflation. The stock market is extremely sensitive to data points that will clarify the assumption of the Fed and others on the course of action in the coming days.
Digesting Economic Data
The TRUMP Tweets and Their Market Implications
The latest round of presidential decrees and statements indicates a more and more intensifying energy and defense strategy with significant market and economic consequences. The executive order requiring the Defense Department to place a high priority on long-term energy contracts from coal plants represents a significant shift in U.S. energy and defense policies, rekindling the importance of coal within the national security umbrella. The administration is using the rhetoric of grid reliability to mandate these long-term energy contracts from coal plants, arguing these contracts will ensure “mission assurance” within the U.S. Defense Department. The allocation of funds from the Energy Department to modernize coal plants and the alignment of Pentagon procurement strategies represent more than just rhetoric; it is a pivot in resource allocation. From a market perspective, these statements and actions represent a potential upside risk to the U.S. energy and utilities sectors while representing a possible inflationary risk associated with more expensive and less efficient energy sources.
From an economic perspective, the President’s recent comments on the January jobs report, coupled with the administration’s rhetoric on a 4.3% unemployment rate and a robust jobs market within the private sector, adds a degree of political legitimacy to the recent jobs numbers. However, the President’s statement that “we should pay lower interest rates on borrowing” injects a degree of political pressure on the Federal Reserve ahead of the inflation data release. The combination of the jobs celebration and the rate-cut pressure represents a delicate dance between the administration and the Federal Reserve. The question now becomes whether the administration will rely on a populist narrative to advocate for a rate cut even at the expense of inflation data. This is a signal to the bond market to begin to adjust for a possible pivot to a more dovish monetary policy, especially if economic data reveals a moderation in wage and consumer spending data.
On an international front, the president’s message on Iran diplomacy has two-fold implications. The president’s message, in which he told Israeli Prime Minister Netanyahu that nuclear talks “should continue,” while simultaneously stating that “if diplomacy fails, there will be consequences,” is a tightrope walk by the White House. The message, in conjunction with the announcements related to defense and energy, can be interpreted as suggesting that geopolitical risk premiums, particularly in oil, are set to persist. Oil prices can be supported as investors assess not only the present supply and demand situation, but also the risk of conflict in regions like the Middle East, which have significant geopolitical risks. A failure in these negotiations can lead to a push-up in oil, gold, and defense stocks.
Finally, the overall message, which has ranged from nominations in the Senate to crime rates and historical commemorations, points to a White House focused on ensuring institutional and legacy-based communications. The overall tone of the recent rhetoric, however, including the controversy surrounding comments made by the president, which were later clarified by the press office, has been questionable. Markets operate on predictability, and these instances of political controversy can cause short-term volatility. Investors would be wise to keep an eye out for follow-through actions that support or contradict these messages, particularly in areas like fiscal stimulus, industrial policy, and defense spending pipelines.
Household Jobs Surge Signals Broader Labor Strength Beyond Payroll Prints
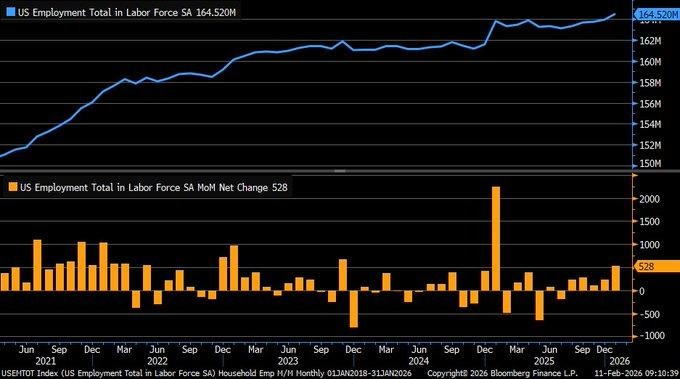
The household employment survey for January revealed a significant upside surprise, adding 528,000 jobs compared with 232,000 in December, which pushed the total labor force up to 164.52 million on a seasonally adjusted basis. This is in contrast with the 130,000 increase in the payroll survey, resulting in a 296,000 job gap. It is believed that the gap is due to stronger self-employment and contract work, which is not included in the payroll survey. Moreover, the unemployment rate dipped to 4.3%, which is a positive sign for the labor market, indicating stronger labor activity despite the survey disruptions due to bad weather conditions.
From a broader viewpoint, the stronger household employment survey indicates rising income generation and improved labor market resilience. Stronger labor market activity is typically a positive sign for the overall macroeconomic situation. Analysts need to focus on the question of whether the stronger payroll is a positive sign for sustained income growth or reflects more part-time work, which is less stable in nature. Analysts need to focus on the labor force participation rate, average hourly earnings, and hiring trends for small businesses to assess the stability of the labor market.
Considering the overall situation, we find Home Depot Inc. (HD) undervalued compared with its potential for household formation, renovation, and stability in consumer employment. Analysts need to focus on the overall retail trends, credit card delinquency rates, and home turnover indicators for the overall situation.
Payroll Revisions Confirm Jobless Growth as Productivity Outpaces Hiring
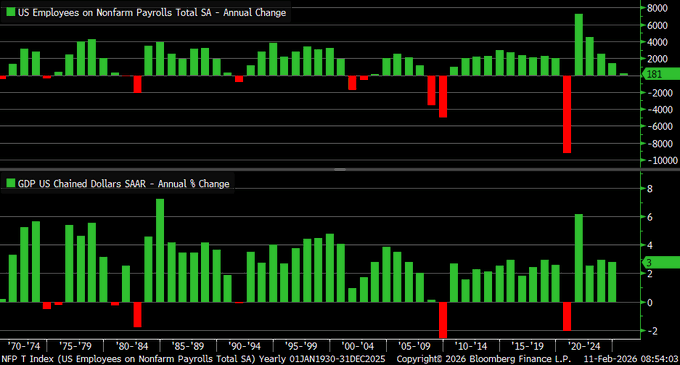
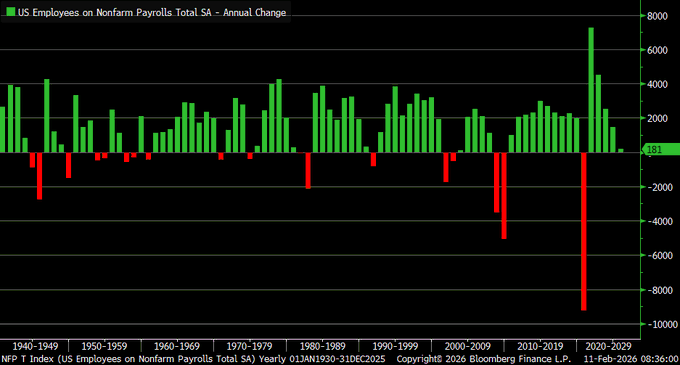
The latest revision in labor data revealed a sharp decline in 2025 non-farm payroll additions to 181,000 from 584,000, which represents the weakest positive annual rate in more than two decades. Although job additions have slowed significantly from 2.5 million jobs added in 2023, real GDP has grown by 2.3% year to date. We view this as a continuation of productivity-led economic expansion, where advances in automation technology, digital infrastructure, and artificial intelligence enable companies to drive top-line growth without proportionate additions to payroll. The payroll revision, which shaved off 403,000 jobs based on tax records, underscores how initial job additions significantly overstated labor market momentum.
We view this as a structural trend rather than a cyclical issue. Companies seem to be laser-focused on cost discipline and capital efficiency, driving output growth while restraining payroll additions. The 4.3% unemployment rate underscores a tightening labor market, but hiring additions remain muted. As such, we will be monitoring capital expenditure trends, corporate profit margins, and unit labor costs to gauge whether productivity-led expansion is a sustainable trend or simply an attempt to drive moderation in demand. Another important factor to watch would be inflation stability, as muted hiring additions combined with steady output would drive wage inflation pressure.
Against this backdrop, we view Microsoft Corp. (MSFT) as an undervalued name due to its structural exposure to productivity-led expansion in the enterprise software space. As companies strive to drive output without proportionate additions to payroll, demand for digital solutions would continue to improve. As such, we recommend that analysts focus on enterprise software bookings, cloud revenue growth, and operating margin expansion to gauge whether productivity-led investment is driving expansion in the software space.
Employment-Population Ratio Edges Higher, Signals Participation Stabilization
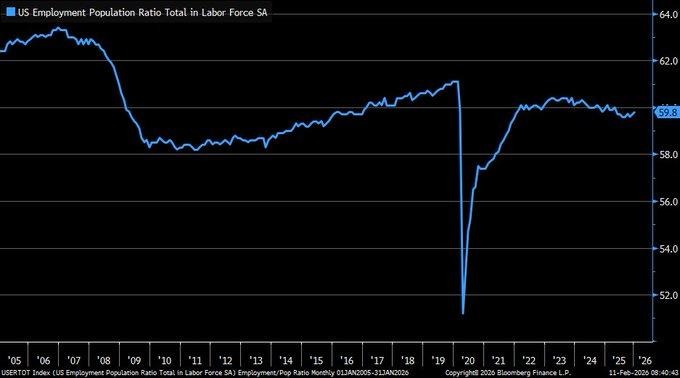
The employment-population ratio rose to 59.8% in January from 59.7%. This modest improvement is significant. This measure contrasts with the unemployment rate as it tracks the percentage of the working-age population that is actually working. This provides a better indication of participation trends. Despite payroll growth of 353,000 in January, the employment-population ratio is still far from the levels seen before the 2008 crisis, around 63%. This reflects the long-run effects of demographic changes, aging workforce characteristics, as well as participation barriers like childcare costs and health issues. This modest increase in the employment-population ratio signals a stabilization trend in participation levels.
From a macroeconomic perspective, a rising employment-population ratio is a good indicator of income distribution sustainability. Nevertheless, the structural limit to rising above 60% suggests that the economy may be operating close to full capacity based on labor levels. This could have implications for potential output growth unless compensated by productivity growth. Therefore, it is essential to observe trends in participation rates among prime-age workers to assess if the economy is benefiting from cyclical payroll growth or if it is being hindered by demographic headwinds.
Therefore, we rate Walmart Inc. (WMT) as undervalued considering its exposure to broad-based payroll growth trends as well as income sustainability across lower- to middle-class households. As participation levels increase, even by a small percentage, aggregate spending power expands across broad categories of retail spending. Analysts need to monitor same-store sales growth trends to assess if payroll growth is being translated into retail spending growth.
Home Insurance Premiums Surge, Exposing Climate Risk Pricing Shock
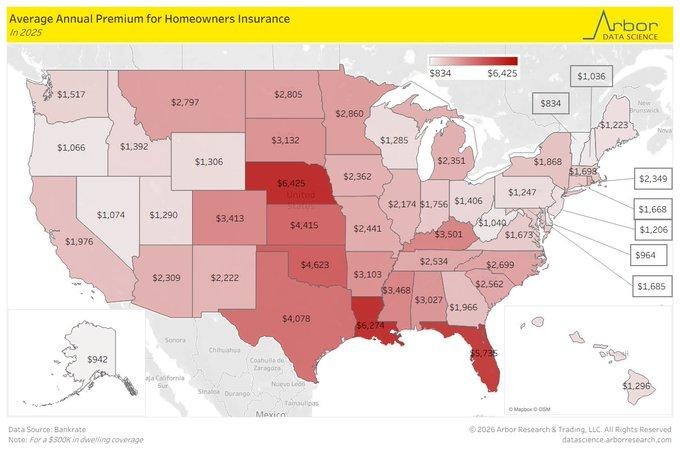
Homeowners insurance premiums have surged sharply in high-risk states, with Nebraska averaging $6,425 annually, followed by Louisiana at $6,274 and Florida at $5,735. These elevated costs reflect persistent severe weather exposure, rising catastrophe claims, and structural repricing of risk across the property insurance market. National averages have climbed more than 20% since 2023, signaling that insurers are recalibrating underwriting models to reflect more frequent extreme events. For households, this represents a direct erosion of disposable income, particularly in middle-income regions heavily exposed to climate volatility.
The broader economic implication is twofold. First, higher insurance premiums effectively act as a localized tax on homeownership, tightening affordability even if mortgage rates stabilize. Second, insurers facing elevated claims and rising repair costs—driven by inflation in materials and labor—are restricting coverage or exiting high-risk regions. We are closely monitoring combined loss ratios, reinsurance pricing trends, and regional housing turnover data to assess spillover risks into property markets. Persistent premium inflation could dampen housing demand and compress residential construction activity in vulnerable geographies.
Within this landscape, we consider Allstate Corp. (ALL) undervalued relative to its pricing power and disciplined underwriting adjustments. As insurers reprice risk and exit unprofitable segments, firms with strong capital buffers and diversified geographic exposure can improve margin stability. Analysts should evaluate rate approval momentum, catastrophe reserve adequacy, and reinsurance cost trends to determine whether pricing normalization translates into sustainable earnings recovery.
Retail Control Group Slips, Signaling Core Consumer Fatigue
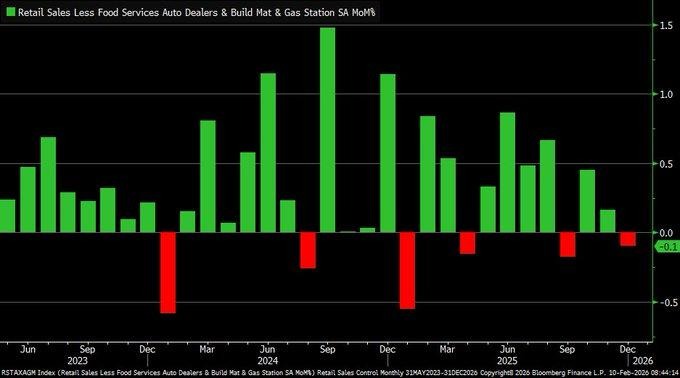
Retail control group sales for December fell 0.1%. The core retail control group does not include autos, gasoline, or building materials. As such, it is a better indicator of discretionary spending that feeds into the GDP. The fourth-quarter trend has been declining considerably: 0.5% in October, nearly zero in November, and now negative in December. The risk of personal consumption, which comprises 70% of overall economic output, increasing at a rate less than initially anticipated is now elevated.
Macro-level risks: The persistent weakness in core retail categories is pressuring overall GDP growth and corporate revenue forecasts. As discretionary spending slows, it is the precursor to other macro-level issues. The key is to monitor the trend in real disposable income, consumer credit utilization rates, and services inflation to determine whether the slowdown is just noise or the beginning of the consumer reset.
In this environment, Walmart Inc. (WMT) is considered undervalued given its defensive position and trade-down risk. As the consumer resets spending habits, value retailers tend to benefit from the shift as consumers trade down from the competition. As the consumer continues to reset spending habits, value retailers will benefit from the shift in spending. Analysts should focus on comparable store sales growth, private brand penetration, inventory turnover efficiency, and forward-looking margins to validate the resiliency of the consumer. Defensive consumer staples may outperform the overall retail sector if discretionary spending continues to slow.
Restaurant Sales Momentum Fades, Hinting at Discretionary Pullback

The three-month moving average of monthly growth in food service and drinking place sales decelerated to below 0.2% in December, suggesting a significant deceleration in the rate of growth in dining out. Although year-over-year sales remain in positive territory at 4.7%, the deceleration in monthly growth suggests that consumer spending is becoming more selective. Since restaurant spending is firmly positioned within discretionary spending, this category often provides early signals on consumer spending trends. With retail sales flat in December, the deceleration in restaurant spending suggests that consumers are recalibrating spending trends instead of expanding spending.
From a macro transmission perspective, decelerating restaurant spending may suggest a gradual rotation towards at-home consumption patterns, especially as elevated borrowing costs and ongoing living costs continue to pressure household incomes. This could have implications for inflation in the services sector but could also weigh on employment growth in the services sector. As such, we are monitoring transaction frequency data, grocery sales growth, as well as trends in real incomes to assess if this is a temporary seasonal adjustment to consumer spending trends.
In this regard, we continue to view Walmart Inc. (WMT) as undervalued given its exposure to grocery volume growth as well as trade down consumer spending trends. As households adjust their spending from dining out to home-based consumption patterns, large-scale retailers with pricing leverage as well as operational efficiency in their respective value chains are well positioned to gain from this trend. Analysts need to focus on food category same-store sales growth as well as margin trends to assess if this trend is indeed gaining momentum.
Upcoming Economic Events
GBP GDP m/m, Preliminary GDP q/q, USA Unemployment Claims
As we approach the next trading window, we are expecting a vital growth and labor market update from the United Kingdom and the United States. The United Kingdom’s monthly and quarterly gross domestic product data will provide much-needed clarity on the nation’s economic growth. Meanwhile, the United States’ unemployment claims data will provide valuable insight into the stability of the nation’s labor market. We find this data to be particularly relevant because the stability and growth are currently at odds with each other.
GBP GDP m/m
The monthly gross domestic product data will provide the first indication of the nation’s growth acceleration and deceleration.
- If the actual gross domestic product reading is higher than the forecasted reading, this would be an extremely positive sign for the United Kingdom’s economy, indicating stronger than expected growth in the nation’s businesses and consumer sector. In this case, the British pound would be expected to appreciate against the United States’ currency, and government bond yields would increase due to the reduced need to ease monetary policy. The nation’s cyclical sectors would be expected to perform well, particularly the financial sector, tourism sector, and retail sector.
- If the gross domestic product reading is lower than the forecasted reading, this would be an extremely bearish sign for the United Kingdom’s economy, and the British pound would be expected to depreciate against the United States’ currency. The nation’s equity market would be expected to move into defensive plays such as the utilities sector and the consumer staples sector. We would be focusing on the services sector because this sector accounts for the largest portion of the nation’s gross domestic product and would provide the clearest picture of the nation’s domestic demand.
Preliminary GDP q/q
Quarterly GDP will offer a broader structural view on the overall direction of the economy.
- A better-than-expected GDP print will be a positive sign that the overall economy is expanding in all sectors. This will likely have a positive impact on risk assets worldwide, boosting equities and pushing bond yields slightly higher. This will be a positive sign that higher interest rates have not yet impacted the overall economy.
- A worse-than-expected GDP print will likely have the opposite effect. There will be a higher probability of a recession. Bonds will likely rally on the increased expectations of monetary policy easing. Equities will likely be pressured. Analysts will have to look at the trends in business spending and consumer spending to gauge the overall economy.
USA Unemployment Claims
Weekly unemployment claims remain one of the most sensitive labor market indicators to turning points.
- A better-than-expected print will be a positive sign that the labor market is continuing to strengthen. This will be a positive sign that the overall consumer spending is stable. Equities will likely be positively affected in cyclical sectors, but bond yields will likely rise if the strong labor market delays rate cuts.
- A worse-than-expected print will likely be a sign that the labor market is starting to turn. This will likely have a positive impact on bond markets and a negative impact on equities in economically sensitive sectors. We will be looking at the four-week average trend to gauge the overall labor market.
Stock Market Performance
Indexes Recover from April Lows, But Breadth and Drawdowns Tell a Deeper Story
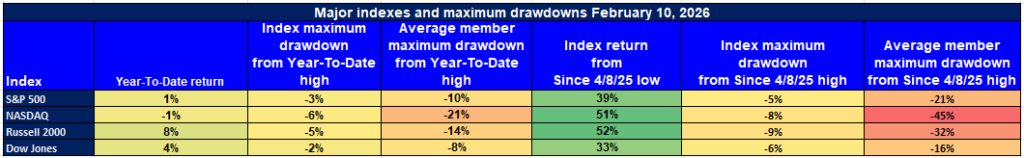
At Zaye Capital Markets, we continue to observe that the performance of the major indexes is masking the underlying volatility and lack of participation. While the indexes have experienced impressive rallies from the low set on April 8th, 2025, the year-to-date performance is unremarkable. More concerning is the average drawdown of the members of the indexes. The disparity between the performance of the indexes themselves and the members of the indexes is a key feature of the current market structure.
S&P 500: Positive YTD, Moderate Structural Pressure
YTD: +1% | -3% from YTD high | Avg. member: -10%
+39% since 4/8/25 low | -5% max drawdown since low | Avg. member: -21%
Year-to-date, the S&P 500 is up 1% with only a 3% pullback from its year-to-date high. However, the average member of the index is down 10% from its respective high. Since the low set on April 8th, the S&P 500 has gained 39% with the average member experiencing a 21% maximum drawdown.
NASDAQ: Strong Recovery, But Deep Internal Damage
YTD: -1% | -6% from YTD high | Avg. member: -21%
+51% since 4/8/25 low | -8% max drawdown since low | Avg. member: -45%
The NASDAQ is down 1% year-to-date with a 6% decline from its year-to-date high. The average member of the NASDAQ is down 21% from its respective high. Since the low set on April 8th, the NASDAQ has gained 51% with the average member experiencing a 45% maximum drawdown.
Russell 2000: Small-Cap Resilience with High Risk
+8% YTD | -5% below YTD high | Average member: -14%
+52% since 4/8/25 low | -9% max drawdown since low | Average member: -32%
The Russell 2000 is leading the YTD charge with an 8% gain so far this year but is now only 5% below its YTD high. The average small-cap stock is now 14% below its YTD high. Since the low on April 8th of last year, the Russell 2000 has risen 52%. However, the average member of the index has seen a maximum drawdown of 32%.
Dow Jones: Stability with Controlled Drawdowns
+4% YTD | -2% below YTD high | Average member: -8%
+33% since 4/8/25 low | -6% max drawdown since low | Average member: -16%
The Dow Jones Industrial Average has risen 4% so far this year with the index now only 2% below its YTD high. This is an indication of relative stability in the market. The average member of the Dow Jones is now only 8% below its YTD high. Since the low on April 8th of last year, the Dow Jones has risen 33%. The average member of the index has seen a maximum drawdown of 16%.
At Zaye Capital Markets, we interpret the data as a market where headline resilience coexists with fragile breadth. Index recoveries have been powerful, yet constituent-level volatility remains elevated. We continue to prioritize balance sheet strength, earnings visibility, and risk-adjusted positioning while monitoring breadth confirmation before increasing cyclical exposure.
The Strongest Sector in All These Indices
Energy Leads 2026 with 20.2% YTD Gain, Dominating Sector Leadership
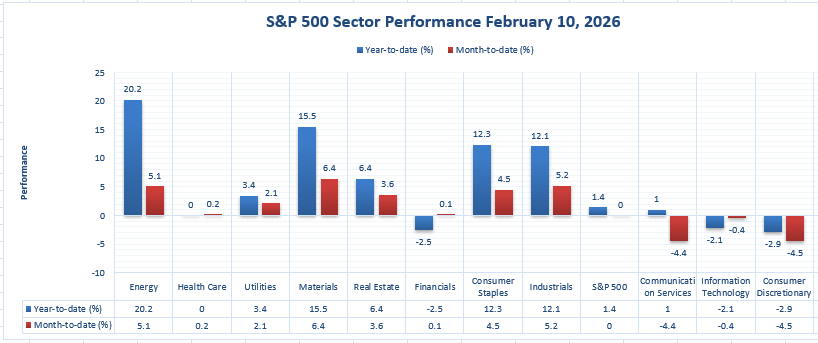
The latest data reveals that the Energy sector is currently the strongest sector in the S&P 500. It has achieved a year-to-date gain of 20.2%. In addition to this, it has achieved a 5.1% month-to-date gain. No other sector in the S&P 500 can claim to have achieved such remarkable year-to-date growth as well as month-to-date growth. In contrast to this, the S&P 500 index as a whole has achieved a year-to-date gain of just 1.4%. In terms of month-to-date growth, it has achieved just 0.0%.
The gap between the Energy sector and the next strongest sectors is quite significant. The Materials sector is the next strongest sector in the S&P 500. It has achieved a year-to-date gain of 15.5%. In terms of month-to-date growth, it leads all sectors with a gain of 6.4%. The Consumer Staples sector has achieved a year-to-date gain of 12.3%. In terms of month-to-date growth, it has achieved a gain of 4.5%. The Industrials sector has achieved a year-to-date gain of 12.1%. In terms of month-to-date growth, it has achieved a gain of 5.2%. However, even the strongest sectors have achieved growth that is much smaller in comparison to the year-to-date growth of the Energy sector. In comparison to the year-to-date growth of the Energy sector, the year-to-date growth of the Financials sector is -2.5%. In comparison to the year-to-date growth of the Energy sector, the year-to-date growth of the Information Technology sector is -2.1%. In comparison to the year-to-date growth of the Energy sector, the year-to-date growth of the Consumer Discretionary sector is -2.9%.
The outperformance of the Energy sector is quite significant. From the perspective of Zaye Capital Markets, it appears to represent a decisive sector rotation into sectors that have a presence in the real economy. With year-to-date growth of over 20%, the Energy sector is not merely participating in the rally; it is defining it.
Earnings
Earnings – February 11, 2026 (Yesterday)
- TotalEnergies SE reported full-year 2025 revenue of approximately $201 billion (down ~6% YoY) with adjusted net income of $15.6 billion (down 15% YoY) and IFRS net income of $13.1 billion (down 17% YoY), reflecting lower oil prices. Cash flow remained near $27.8–$28 billion (down ~7% YoY) and ROACE reached 12.6%. In Q4 2025, revenue was $45.93 billion (down ~2.5% YoY but beat estimates significantly) with adjusted EPS around $1.73. Production growth and LNG/power increases helped offset price declines.
- Shopify, Inc. Class A posted Q4 2025 revenue of $3.67 billion (up ~31% YoY, beat estimates). Adjusted EPS ranged between 48 cents and ~57 cents depending on margin treatment. Full-year momentum remains strong with expectations for low-30% revenue growth in Q1 2026 and a $2 billion buyback announced, though margin concerns influenced reaction.
- T-Mobile US, Inc. delivered Q4 2025 revenue of $24.33 billion (up ~11% YoY), net income of $2.1 billion, and adjusted EPS of $2.14, beating estimates. Postpaid net additions reached 2.4 million. Full-year 2025 service revenues totaled $71.3 billion (up 8% YoY) with diluted EPS of $9.72.
- EssilorLuxottica SA generated full-year revenue of €28.5 billion (up 11.2% YoY) and record free cash flow of €2.8 billion. Q4 revenue growth surged 18.4% YoY, driven by strong demand for AI-powered eyewear, with over 7 million pairs sold in 2025.
- AppLovin Corp. Class A produced Q4 revenue of $1.66 billion (up 66% YoY), net income of $1.1 billion, adjusted EBITDA of $1.4 billion, and GAAP EPS of $3.24. Full-year revenue reached $5.48 billion (up 70% YoY) with $3.33 billion in net income and $2.58 billion in share buybacks.
- McDonald’s Corporation reported Q4 revenue of $7.01 billion (up 10% YoY), net income of $2.16 billion, and adjusted EPS of $3.12. Global comparable sales increased 5.7% (U.S. +6.8%). Full-year revenue was ~$26.9 billion with diluted EPS of $11.95 and systemwide sales over $139 billion (up 7%).
- Cisco Systems, Inc. announced fiscal Q2 revenue of $15.3 billion (up 10% YoY, record), GAAP EPS of $0.80 (up 31% YoY), and non-GAAP EPS of $1.04 (up 11% YoY). Networking revenue grew 21%. Q3 FY2026 guidance stands at $15.4–$15.6 billion.
Earnings Preview – February 12, 2026 (Today)
- Anheuser-Busch InBev SA/NV investors should focus on global volume recovery versus pricing power. Margin stability will depend on input cost control and geographic mix, particularly in emerging markets where demand elasticity is rising. Guidance on free cash flow and dividend sustainability will be critical.
- Siemens Aktiengesellschaft will provide insight into industrial automation demand, order backlog strength, and capital goods momentum. Investors should monitor order intake trends and margin progression in digital industries and smart infrastructure.
- SoftBank Group Corp. will be evaluated on portfolio valuation changes, asset disposals, and capital deployment strategy. NAV movements and exposure to technology-driven holdings will determine sentiment.
- Hermes International S.A. will signal whether ultra-premium consumer demand remains insulated. Investors will track revenue growth consistency and operating margin strength.
- Unilever PLC will be assessed for pricing discipline versus volume recovery across global staples markets, with gross margin trends central to performance.
- Brookfield Corporation will be analyzed for fee-related earnings growth, capital recycling efficiency, and deployment pace in real assets and credit.
- L’Oréal S.A. will reflect global beauty demand strength, particularly in premium segments, and operating leverage execution.
- Morningstar, Inc. will provide clarity on asset-based revenue sensitivity to market flows and subscription stability.
- Pinterest, Inc. Class A will be closely watched for user growth, advertising monetization, and forward revenue guidance.
- Rivian Automotive, Inc. Class A must demonstrate delivery growth, cost efficiency improvements, and progress toward cash flow stabilization.
- Arista Networks, Inc. will be judged on AI-driven data center networking demand, backlog strength, and revenue guidance.
- Agnico Eagle Mines Limited will highlight gold production volumes, all-in sustaining costs, and margin sensitivity to bullion prices.
Stock Market Overview – Thursday, 12 Feb 2026
The United States stock markets opened with a mixed tone as markets absorb the strong labor data released last week, as well as the better-than-expected corporate earnings and the evolving expectations surrounding the Fed’s next moves. Although the strong labor data delayed expectations of rate cuts, markets are gradually becoming more selective in allocating capital to energy, industrial, and infrastructure stocks. On the other hand, the tech giants are under pressure. At Zaye Capital Markets, we are keenly observing the markets as participation continues to narrow.
Stock Prices
Economic Indicators and Geopolitical Developments
The markets are currently influenced by a combination of factors, including the persistent strength in Treasury yields, positive surprises in corporate earnings, and tactical positioning ahead of the inflation data release on Friday. The Treasury markets are adjusting their expectations as the U.S. economy added 528,000 household jobs in January, reducing the unemployment rate to 4.3%. From a geopolitical perspective, the Middle Eastern tensions are supporting oil prices as Brent crude continues to trade above $84 per barrel. On another note, Amazon has been given regulatory approval by the U.S. government to launch 4,500 low-Earth orbit satellites as part of Project Kuiper, a move that will intensify competition in the broadband market.
Latest Stock News
- $PLTR is becoming a fundamental part of the AI-native enterprise software stack, and as one investor noted, “its relevance only increases in an agentic world where machines make decisions.” The problem it’s trying to solve in the long term, enterprise data operationalization, is not going anywhere.
- $HOOD was able to launch a $300M run rate prediction market business in under a year, demonstrating its ability to monetize attention and extend its reach into behavioral finance and speculative data layers, beyond its core business of trading.
- $ASML is still the dominant player in advanced chip production. Every AI chip, from $NVDA Blackwell, $AAPL M4, and $AMZN Trainium, among others, is powered by ASML’s EUV lithography. There is no secondary player in this space.
- $MSFT is trading at a 7-year valuation low, yet it is the foundation of global AI infrastructure. Either the market is pricing in margin pressures in this space, or this is a deep value entry point into the AI platform business.
- $MU has already begun HBM4 memory shipments, beating its own schedule by a quarter, directly in contradiction to bear cases around its ability to scale in the AI space.
- $AEHR has been able to win a hyperscaler order for its Sonoma AI package burn-in system, which will begin this summer, and has a much larger order anticipated in 2H 2026 and 2027.
- $ASTS has been able to deploy the largest commercial communications antenna in low Earth orbit, a key step in its 3.5x larger Block 2 satellite deployment.
- $AMZN has been given FCC approval to launch as many as 4,500 satellites in its Kuiper constellation, and a new frontier in global broadband competition is set to begin.
The Magnificent Seven and the S&P 500
The “Magnificent Seven,” which comprises Apple, Microsoft, Nvidia, Amazon, Meta Platforms, Alphabet, and Tesla, is still under pressure. Until this week, these seven stocks have declined by 15-18% from recent highs, with Tesla and Meta Platforms leading the pack due to margin pressure and revenue concerns. Microsoft and Alphabet have faced overhangs related to valuation, whereas Amazon’s rise in infrastructure investments has led to new capital expenditure concerns. Nvidia and Apple have seen rotation due to moderation in demand. Until now, these seven stocks were driving most of the moves in the S&P 500, and now they are putting pressure on breadth. Until there is an improvement in breadth with new leadership or earnings momentum from other sectors, upside potential is limited.
Major Index Performance as of Thursday, 12 Feb 2026
- S&P 500: Trading at 6,941.45, flat, with narrow leadership and tech fragility.
- Nasdaq Composite: Trading at 23,066.47, down ~0.6%, as AI momentum cools.
- Dow Jones Industrial Average: Trading at 50,121.40, up 0.2%, as defensives and infrastructure boost.
- Russell 2000: Trading at 2,668.47, holding firm as small-caps find footing in cyclical rotation.
We continue to believe that the current environment requires precision, and we are focused on positioning accordingly. With mega-cap tech stocks pressured, rate-sensitive stocks vulnerable, and geopolitics influencing markets, we are focusing on high free cash flow stocks that benefit from sector trends and possess pricing power. Breadth, revisions, and inflation on Friday will be key in defining near-term conviction.
Gold Price: Will Gold Prices Soar as Tensions over Energy Security and Iran Rise?
The gold price currently trades around $2,063/oz as the market stabilizes around recent price highs in anticipation of stronger US labor data, changing energy policy, and increasing global tensions. We at Zaye Capital Markets see today’s anticipated US unemployment claims and UK GDP figures as critical to determining short-term gold price momentum. An unexpected surge in unemployment claims and lower-than-expected UK economic expansion may result in higher gold prices as the market continues to demand safe-haven assets in an increasingly globalizing world. New executive orders signed by President Trump outline a new energy policy aimed at procuring coal contracts for military infrastructure construction. This unexpected policy shift, aimed at ensuring national energy security, is sending powerful signals to the market about the importance of resource nationalism and grid security as key elements in the US military strategy. When government policy directly supports legacy energy resources as part of ensuring continuity in military operations, the market tends to interpret this as an early sign of underlying inflationary undertones, procurement volatility, and underlying pricing shifts in the energy and industrial sector. This policy shift, combined with White House rhetoric on the need to reduce borrowing costs and stimulate domestic production, has set the tone for an increasingly protectionist energy policy, creating an ideal backdrop for gold to reprice.
Yesterday’s macro-economic numbers, which showed the increase in household jobs by 528,000 and unemployment falling to 4.3%, initially affected gold by shifting rate-cut probabilities further out. However, despite positive labor numbers, the overarching theme is shifting back to risk and disruption in the global space. The recent move by Trump on Iran diplomacy, where Trump stated that there would be “consequences if talks fail,” is increasing hedging activity as investors prepare for tension between multiple nations. Gold’s ecosystem is now underpinned by what we believe is a three-pillar structure: global energy instability, defense-driven industrial policy, and asymmetrical geopolitics. So long as nations prioritize self-resilience over openness and global diplomacy remains fragile, we believe that gold will benefit from its traditional role as an anchor for capital preservation. We continue to watch treasury yield ceilings, energy funding disbursements, and Middle Eastern diplomacy for cues on the breakout trajectory for gold.
Oil Prices: Is Oil Set to Break Out as Energy Policy and Geopolitical Risks Tighten Supply Outlook?
Currently, the price of crude oil is trading at approximately $84.22 per barrel (Brent) and $78.19 per barrel (WTI), holding steady as the energy markets continue to digest the potent combination of political intervention, economic resiliency, and supply-side risks. In the wake of the newly signed executive order by President Trump, in which the Department of Defense has been tasked with securing long-term coal power contracts, the spotlight has turned towards the emerging landscape of resource securitization and state-sponsored energy infrastructure. Although the newly signed executive order targets coal specifically, it can be viewed as part of the larger energy policy landscape in the US, which prioritizes domestic supply security over the pursuit of efficient markets. In the context of the newly signed executive order, the prioritization of coal by the US Defense Department serves as a clear indicator of the emerging landscape of cross-sector energy consumption by the state. In the context of the US government’s prioritization of domestic supply security over the efficient functioning of the US energy markets, the current landscape of Iran-US relations serves as an emerging backdrop of heightened geopolitical risks. In the context of the emerging landscape of Iran-US relations, the recent warnings issued by the US government regarding the “consequences” of failed nuclear talks serve as a clear indicator of the heightened geopolitical risks. In the context of the emerging landscape of Iran-US relations, the recent “expectation-shattering” jobs report released by the US government yesterday, in which 528,000 jobs were added at the household level with the unemployment rate falling to 4.3%, serves as a clear indicator of the structurally bullish backdrop for the price of crude oil.
The most important economic events currently include unemployment claims in the United States and GDP for the United Kingdom, which will provide directional support for oil prices in the near term. If unemployment claims rise, they could potentially place a lid on gains, but positive surprises for oil demand and supply could continue oil’s upward trend. OPEC’s latest announcements continue to support oil on the production side, emphasizing their commitment to current production levels despite current oil prices. The IEA also issued a similar alert regarding oil deficits, stating that oil demand will continue to tighten through mid-2026 due to increased imports from Asia and increased delays for oil shipments through the Red Sea. Additional support for oil’s upward trend is also coming from independent sources such as Walter Bloomberg and Zero Hedge, citing oil’s largest commercial inventory draw since October, totaling 4.7 million barrels, along with increasing oil imports for India and Japan. If current defense policies shift from executive actions to infrastructure spending, oil demand could potentially receive unexpected support from second-order effects throughout industrial supply chains. However, at Zaye Capital Markets, we believe oil’s next $5 will come from government action, not refinery utilization.
Bitcoin Prices: Will Bitcoin Recover as Rate Policy, Energy Mandates, and Inflation Concerns Collide?
Bitcoin is trading today at $66,080 after another day of losses as the macro environment continues to weigh on the asset class and traders take a cautious approach as inflation data looms. Although the recent jobs report out of the U.S. showed an increase of 528,000 jobs and an unemployment rate of 4.3%, Bitcoin did not capitalize on these positive results and instead plummeted nearly 2% and shed close to $2,000 as the asset class continues to struggle to maintain its price above critical support zones. Analysts believe that the recent drop in Bitcoin is not the result of one factor but instead a combination of various factors including tightening liquidity and diminishing trading volume. President Trump recently announced that he would be signing an executive order that would require the Department of Defense to prioritize coal as the primary source for procurement and would require the Federal Energy Regulatory Commission to develop a plan that would realign the way that America’s energy grid operates. This recent shift in fiscal policy has brought attention back to hard assets and the benefits that they provide to the economy and the American people. Although Bitcoin typically thrives in an environment that is highly geopolitical in nature, recent fiscal policy developments appear to be taking the attention and assets that would normally be allocated to Bitcoin and instead shifting that money to domestic productions and manufacturing. Additionally, President Trump’s recent push for lower interest rates despite positive jobs numbers continues to confuse the market and create an environment that is not conducive to confidence.
The unemployment claims data in the US, as well as the global CPI announcements later this week, will be important factors in determining the next course of action in Bitcoin. Crypto sentiment is also fragile, as evidenced by the recent multi-week highs in realized losses and technical indicators, which suggest that bears are in control. On-chain data is also indicating reduced liquidity and order books. Crypto ETF flows have also been stagnant. Currently, traders are looking towards the $65K zone as the last support before the price can dip further and test the $60K zone. But in the event of a weaker-than-expected unemployment report, traders might take a speculative bet on the idea that monetary policy might shift dovish again. Until then, Bitcoin is stuck in a consolidation phase, as evidenced by the various macro and sectoral headwinds. Political tensions, particularly the recent White House comments on Iran diplomacy, as well as the shift in national energy strategies, are important factors in determining the long-term prospects of Bitcoin as a hedge. But in the short term, the path ahead is crowded, and Bitcoin is stuck in a consolidation phase. At Zaye Capital Markets, we would advise investors to keep an eye on the selling pressures by miners, as well as how global central banks react to the risk of inflation and political overreach, before adjusting their risk allocation in high-volatility assets like Bitcoin.
ETH Prices: Will Ethereum Manage to Stabilize as Whale Activity and ETF Flows Indicate a Potential Turnaround?
The Ethereum price is currently trading around $1,971.19, holding above the psychological barrier of $2,000 as it corrects from a sharp fall from above $3,400 in mid-January. According to TradingView, Ethereum has entered a consolidation phase as it recently experienced heavy liquidation and volatility in late January and early February. From our analysis at Zaye Capital Markets, it seems that Ethereum is currently benefiting from whale activity as some large holders have moved large volumes of Ethereum from exchanges into storage, indicating reduced selling pressure in the near term. Moreover, Ethereum exchange-traded products have seen inflows for the first time in more than two weeks, indicating cautious buying from institutional investors who expect a medium-term turnaround. This is due to Ethereum’s continued dominance in smart contracts, layer 2 scaling, decentralized finance, as well as infrastructure in artificial intelligence and tokenized assets. Despite the sharp correction in Ethereum’s price, participation in staking remains high, and base fee burning is still suppressing circulating supply, thus indicating structural support.
From a macroeconomic perspective, the stronger-than-expected US labor data reported yesterday has delayed the expected easing in monetary policy, which has put upward pressure on speculative assets like cryptocurrency. However, today’s unemployment claims and UK GDP figures may provide further impetus to market sentiment shifts. If the cooling in the labor market continues, the anticipation of rate cuts may lead to further inflows into cryptocurrency. Additionally, the recent political landscape in energy security and grid resilience has further increased investor interest in decentralized infrastructure as an alternative to traditional, centralized infrastructure. All of these factors are continuing to underpin the Ethereum use case as a programmable financial backbone in an increasingly uncertain geopolitical landscape and an era of tightening fiscal policy. From a technical perspective, the $1,950 to $1,980 range has emerged as an important base. If this base holds and ETF flows continue to be sustained, then there is potential for Ethereum to re-rate higher to $2,200 to $2,300 in the coming weeks. From our perspective here at Zaye Capital Markets, whale wallet activity, ETF fund flows, and their sustainability, as well as layer two transaction activity and staking, are our key indicators of whether Ethereum is in a potential recovery phase.
