Where are markets today?
U.S. and European stock markets’ futures are trading near the flatline to slightly lower on Wednesday, 18th February 2026. The markets are trading cautiously after a quiet trading session on Wall Street on Tuesday. The Dow Jones Industrial Average’s futures are trading slightly lower. The S&P 500 and Nasdaq 100 futures are also trading slightly lower. The major indices on Wall Street on Tuesday gained marginally during regular trading sessions. The markets are trading flat today as investors are waiting for key market triggers. The key triggers include the Federal Reserve’s January meeting minutes and the impending personal consumption expenditure inflation data. The markets are trading flat today as investors are also recalculating the valuations of the technology sector.
One of the major reasons for the markets trading flat today is the pressure on the software and artificial intelligence-linked stocks. The technology sector is experiencing intermittent pressure. The pressure on the sector is attributed to investors’ apprehensions regarding the sustainability of capital expenditure and earnings growth in the sector. The forward earnings growth in the technology sector is still strong relative to other sectors. However, investors are looking for stronger evidence that heavy investments in artificial intelligence will result in sustainable profitability.
The second important factor is macroeconomic uncertainty with respect to inflation rates. As the PCE inflation gauge is scheduled to come out later this week, with durable goods under focus, markets are essentially in a holding pattern. Favorable economic reports will only add to the resiliency of growth but may delay policy actions, whereas unfavorable reports may revive hopes of interest rate cuts but may also undermine growth momentum. European markets are also factoring in this information in conjunction with their own inflation rates and global trade news to create this cross-Atlantic consensus.
We at Zaye Capital Markets believe that this flat futures landscape between Europe and the States is essentially a balancing act of economic data. The interplay of sector rotation, policy expectations, and valuation sensitivities is keeping markets in check and holding back any breakout in prices. Until such time that inflation rates and earnings resiliency are confirmed, both European and US futures will essentially remain in a holding pattern.
Major Index Performance as of Wednesday, 18 Feb 2026
- Nasdaq: Currently trading near 22,578.38 and experiencing mixed performance due to continued volatility in mega-cap tech.
- S&P 500: Currently trading near 6,843.22 and experiencing marginal positive performance due to selective leadership.
- Dow Jones: Currently trading near 49,533.19 and experiencing relatively stable performance due to contributions from defensives and financials.
- Russell 2000: Currently trading near 2,650 and experiencing moderate resilience.
The Magnificent Seven and the S&P 500
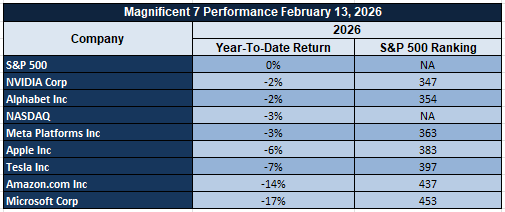
The ‘Magnificent Seven,’ consisting of Apple Inc., Microsoft Corp., Nvidia Corp., Amazon.com Inc., Meta Platforms Inc., Alphabet Inc., and Tesla Inc., are still key contributors to market performance but are being negatively impacted by increasing focus on AI capital intensity and valuation multiples. These stocks have generated the bulk of the S&P 500’s gains over the last year and are therefore having a large impact on market performance due to profit-taking on these names. The overall market may not have enough breadth from sectors such as industrials and financials and small-caps to propel the market further.
Drivers Behind the Market Move – Wednesday, 18 February 2026
The markets in the United States and Europe are trading today in a relatively measured and data-dependent fashion. The markets are taking a balanced view of the geopolitical rhetoric, inflation expectations, and sector-specific volatility. Based on the market movements and news flow from yesterday and today morning, there are three major factors that are influencing the markets in the United States and Europe.
1. Policy Anticipation and Inflation Sensitivity
The markets are in a holding pattern and waiting for the Federal Reserve’s January meeting minutes and the personal consumption expenditure inflation data that will be released later in the week. The market data that will be released today, such as GBP CPI Year Over Year and Core Durable Goods Orders and Durable Goods Orders from the United States, are influencing the markets. The markets will react positively if the durable goods data is released better than expected. The strong durable goods data will be a good indicator of capital expenditure and manufacturing activity. If the data is released better than expected, it will result in a rise in interest rates and a negative impact on equities that are sensitive to interest rates. On the other hand, if the data is released worse than expected, it will result in a negative impact on equities and expectations of rate cuts. This will limit the upside movement in equities in the United States and Europe.
2. Geopolitical Rhetoric and Energy Market Sensitivity
Recent presidential comments with respect to negotiations with Iran and upcoming “big talks,” as well as reference to past military engagements in the pursuit of nuclear capabilities, are having an effect on the risk premiums without instigating further escalation. This is having an effect on the overall European space, particularly with respect to energy pricing and security-related sectors. As such, the absence of aggressive rhetoric with respect to trade and tariffs is providing an overall cap on downside volatility, as negotiations remain an active pricing component.
3. Sector Rotation Based upon AI Valuation Reset
Technology and software stocks continue to face pressure with respect to valuation as the overall sustainability of artificial intelligence spending is being questioned. This is having an effect on the overall US growth space, as well as the broader European space as it relates to technology-exposed equities. As such, while forward earnings revisions in the technology space remain high, confirmation of capital expenditure sustainability is being required with respect to overall profit growth potential. As such, capital is being shifted into defensive, energy, and industrial sectors as opposed to overall index participation.
In the opinion of the team at Zaye Capital Markets, the overall market movement is being dictated by the overall combination of inflation anticipation, as well as the overall geopolitical environment, as opposed to an overall singular driver.
Digesting Economic Data
The TRUMP Tweets and Its Implications
Recent presidential tweets have included cultural acknowledgment and geopolitical undertones that have created a complex environment for markets. Tweets regarding the celebration of Ramadan and Lunar New Year have centered on unity, religious freedom, national pride, and community values. While not impactful on financial markets per se, these tweets have continued to emphasize a tone of domestic stability and inclusivity. To investors, this means that the probability of internal policy shifts is low and that social continuity is valued.
More impactful on financial markets have been tweets regarding Iran negotiations and international talks. While acknowledging Iran as a tough negotiator and referencing military actions targeting nuclear facilities, the geopolitical risk premium on oil and defense assets remains elevated. However, the emphasis on “big talks” and the call for Ukraine to engage in rapid negotiations balance this risk profile and suggest that the administration is engaging in diplomacy rather than confrontation. Energy markets are likely to remain sensitive to changes in Middle East rhetoric given that supply disruption risks are key considerations in oil price movements.
The criticism of the state energy agreements adds another dimension of possible policy friction. The markets take such statements as signs of possible federal intervention or regulatory scrutiny, which can impact infrastructure investments and regional energy projects. At the same time, the announcement of Japan-supported investment projects in Ohio, Texas, and Georgia reinforces the message on capital formation and flows. Large-scale projects, especially foreign-supported investments, tend to support industrial activities, manufacturing, and construction-related sectors, which can positively contribute to medium-term growth expectations.
Overall, the messaging mix appears to emphasize a policy approach centered on diplomatic negotiation, strategic firmness, and domestic economic reinforcement. For the markets, it implies a level of moderated geopolitical risks, stable but vigilant energy pricing, and continued capital expenditure visibility for infrastructure investments and foreign projects. The lack of dramatic trade or tariff escalation-related statements helps to temper some of the immediate downside risks; however, the geopolitics of negotiation will continue to drive market volatility for commodities, defense-related equities, and other risk-sensitive assets in the near term.
ADP Hiring Rebound Indicates Labor Market Stability
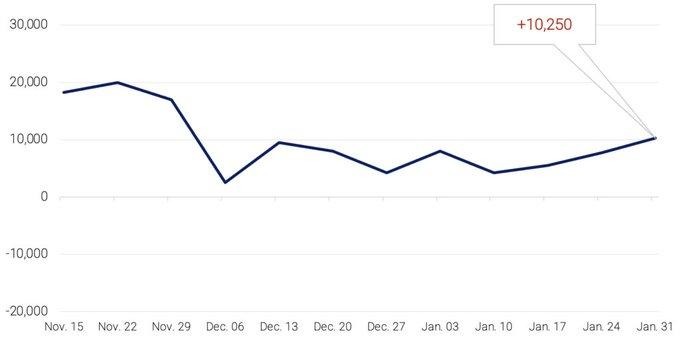
ADP’s preliminary data revealed that private companies hired an average of 10,250 jobs per week in the four-week period up to January 31, 2026, increasing from 6,500 in the preceding period and recording three consecutive weeks of increasing hiring activity. Even though the overall hiring gain of 22,000 is moderate, the sequential increase is significant and is what really matters in this situation. At Zaye Capital Markets, we believe that this is the first sign of stabilization in the labor market following the volatility in late 2025.
This is a forward indicator ahead of nonfarm employment data and has policy implications for the Fed and other central banks. Ongoing incremental hiring activity is likely to reduce the likelihood of Fed rate cuts and support stable monetary policy. However, weak sector detail suggests that companies in the leisure and professional service sectors are still cautious due to margin pressures and demand normalization. In this situation, analysts should look for consistency in wage growth, revisions in nonfarm employment data, changes in labor participation, and sector detail to see whether hiring activity expands into higher productivity sectors. The sustainability of consumer spending will also depend on whether income growth accelerates in line with employment creation.
In the wake of the positive hiring activity, we believe that Paychex Inc. is undervalued and is sensitive to employment growth, and analysts should focus on companies that provide payroll and workforce management solutions that will benefit from incremental hiring activity in the coming period. Analysts should look for companies that benefit from hiring activity and are likely to see improved earnings momentum and potential re-rating in the wake of sustained employment creation without negative policy consequences.
Empire Manufacturing Signals Cost Pressure
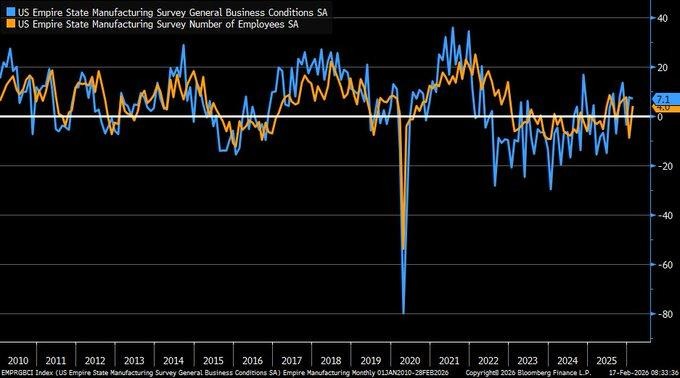
The Empire State Manufacturing Index for February 2026 came in at +7.1, beating the expected +6.2 but slowing down from January’s +7.7. Despite this, the index still indicates regional factory activity growth, albeit at a slower rate. At Zaye Capital Markets, we view this data as maintaining steady but weak momentum. Over the longer term, the index is seen oscillating around the zero line over the last decade, reinforcing the view that the current data is more about stabilization than growth acceleration.
The underlying data, however, paint a more nuanced picture. New orders fell to +5.8, while shipments fell dramatically to -1, down from +16.3. On the other hand, prices paid spiked to +49.1, showing cost pressure remaining high despite the moderation in demand. All these factors indicate manufacturers facing margin pressure, especially those without the power to pass on higher costs to their customers. Analysts should be on the lookout for future orders, inventory levels, the ability to pass on price increases, and corporate results to assess whether cost inflation is starting to take its toll on profit margins, especially in capital-intensive industries.
In this backdrop, we view Rockwell Automation Inc. (ROK) shares as undervalued. With manufacturers focusing on productivity improvements to offset the impact of higher labor and input costs, the demand for smart factory technology is likely to improve. Analysts should also be on the lookout for order growth, capital expenditure intentions in the manufacturing sector, and the ability to maintain profit margins. If input costs continue to be high, but output growth stabilizes, productivity-enhancing technologies could provide earnings support.
NAHB Index Falls to 36 as Housing Weakens
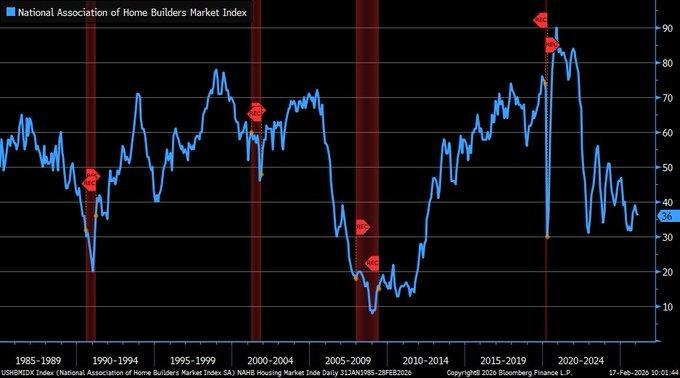
The February 2026 NAHB Housing Market Index came in at 36, a five-month low and lower than the 38 estimate and January’s reading of 37. This validates that single-family homebuilder sentiment is indeed weakening further amidst the challenges of high mortgage rates and affordability. Based on the latest data released by the NAHB, Zaye Capital Markets believes that this serves as a clear indication that single-family homebuilder sentiment is indeed weakening further amidst the challenges of high mortgage rates and affordability. The latest reading is also the lowest since September 2025. The housing market is indeed growing more sensitive to mortgage rates and affordability.
The breakdown of the Housing Market Index also shows that the future sales expectations gauge fell by a notable 3 points to 46. This is the sharpest decline among the indices that make up the Housing Market Index. The gauge for current sales conditions held steady at 41. The gauge for buyer traffic came in at a low of 23. The Housing Market Index shows that single-family homebuilders are indeed facing a two-pronged problem: high costs and buyers who are still waiting for clearer direction on mortgage rates.
Analysts are recommended to pay close attention to movements in mortgage rates, housing starts, permits, and cancellations. Based on the latest data released by the NAHB Housing Market Index, Zaye Capital Markets believes that D.R. Horton (DHI) is undervalued considering the long-term demographic demand for housing. However, analysts are recommended to expect a volatile outlook for the company’s earnings. Lennar (LEN) is also recommended to be on the radar of analysts as it may also experience margin pressure if incentives rise to stimulate sales.
Tariff Spike Coincides with Dollar Weakness
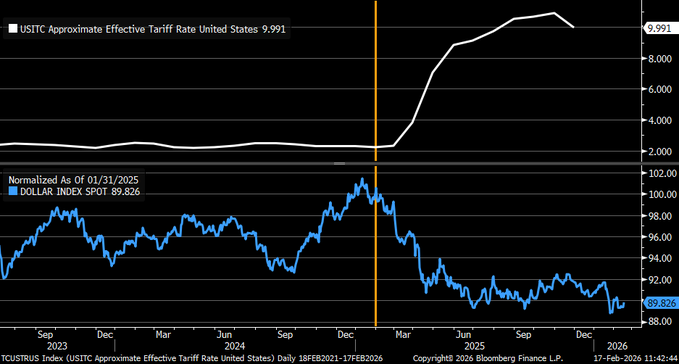
The most recent data indicates the macro environment is shifting dramatically as the effective tariff rate has increased substantially from 2% in January 2025 to 10% as of February 2026, while the normalized dollar index has fallen 10% from 100 to 89 over the same time period. The relationship between the two indicators appears to be inversely correlated. At Zaye Capital Markets, we believe the macro environment is shifting as the changes in trade policy are impacting the capital markets, inflation, and export competitiveness simultaneously. The average effective tariff rate reached 18.3% as of August 2025, the highest since 1934, generating $148 billion in revenue as of October 2025.
The question being asked about the macro environment revolves around the causality of the relationship between the dollar and the tariff rate. The dollar’s weakness can be attributed to the competitive devaluation of the dollar as the administration attempts to offset the higher tariffs through export competitiveness. The dollar’s weakness can also be attributed to the widening fiscal deficit, moderating economic growth, and narrowing interest rate differentials. The tariffs will increase the cost of imports, raising the overall level of domestic inflation. The weakness of the dollar will offset the negative impact of the higher tariffs on exports while exacerbating the overall level of domestic inflation.
Given the macro environment, we find Caterpillar Inc. (CAT) to be undervalued relative to the overall level of export competitiveness due to the weakness of the dollar. The company’s margin will continue to face risks due to the higher cost of importing parts for the company’s products.
Upcoming Economic Events
GBP CPI y/y, USA Core Durable Goods Orders m/m, USA Durable Goods Orders m/m
As we head into this significant session, inflation trends and capital expenditure patterns are set to dominate. These are not just important numbers; they have a significant impact on interest rate markets, currency pairs, bond markets, and sectoral performance in equities. From our perspective at Zaye Capital Markets, we are seeing these numbers as a forward indicator of consumer and business sentiment. These are key leading indicators to determine whether inflation is here to stay and whether capital expenditure is accelerating or decelerating.
GBP CPI y/y
If inflation in the UK is higher than anticipated, it would add to our view that inflation is a persistent force in services and wage-inflationary areas.
- If inflation is higher, it would have a positive impact on bond markets and sterling, potentially putting upward pressure on bond rates and sterling. It would also have a negative impact on rate-sensitive sectors such as housing, retail, and small-cap domestic stocks.
- On the other hand, in the event that CPI misses to the downside, this will reinforce the argument for policy easing later in the year. This is because lower inflation will mean that households will have more purchasing power, which could lead to positive sentiment in consumer stocks and/or financial stocks that are sensitive to mortgage activity.
USA Core Durable Goods Orders m/m & Durable Goods Orders m/m
Durable goods orders are important data that will give investors an idea of corporate capital expenditures and long-term business confidence.
- If durable goods orders beat expectations, especially core durable goods, this will mean that companies are investing in equipment, automation, and infrastructure, which will have positive implications for industrial stocks and technology hardware stocks, and will also lead to higher bond yields due to increased economic growth prospects. It will also mean that the chances of policy easing will diminish in the near term.
- If durable goods miss, this will mean that companies are being cautious due to cost pressures and demand concerns, which will have positive implications for utility and healthcare stocks, and lower bond yields due to lower economic growth prospects. Analysts will look at order backlogs and revisions to prior months to see whether investment activity is accelerating or merely stabilizing.
Stock Market Performance
Indexes Bounce Sharply from April Lows, Breadth Demands Confirmation
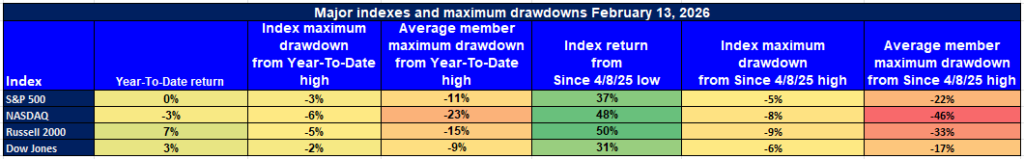
The equity markets have staged an impressive rebound since the low on April 8, 2025. However, as can be observed in the internal drawdown data, breadth has not improved meaningfully. While the indexes have rebounded substantially from their recent lows, the average decline in the members of the indexes has not improved as substantially. As can be observed in the internal drawdown data provided above, while the indexes have rebounded 37% from the recent lows, the average member of the indexes is down 11%. At Zaye Capital Markets, we believe that while the recent rally in the indexes has been impressive, its sustainability is less about the indexes rising to new rally highs than about improving breadth in the markets.
S&P 500: Strong Recovery, Narrow Internal Leadership
YTD: 0% | +37% since 4/8/25 low | -3% from YTD high | Avg. member: -11%
The S&P 500 has rebounded 37% from its recent lows. It is now up 0% year to date, 3% off its recent high. While on the surface the S&P 500 appears to have staged an impressive rebound from its recent lows, the reality is that the average member of the S&P 500 is down 11% from its recent high. This is an indication that while the S&P 500 has rebounded substantially from its recent lows, the rally has not been broadly based.
NASDAQ: Powerful Rebound, Deep Member Drawdowns
YTD: -3% | +48% since 4/8/25 low | -6% from YTD high | Avg. member: -23%
The NASDAQ has recorded the second-best percentage rebound, rising 48% from its recent trough in April. However, it is down 3% year to date and 6% from its YTD high. More importantly, the average member has declined 23% from its high, which reveals significant internal stress in growth-oriented stocks. While the performance of the major indexes reveals that investors’ interest in growth-oriented sectors is improving, the magnitude of the drawdowns of the members of the indexes reveals that the internal strength of the indexes is limited.
Russell 2000: Strongest Percentage Rebound, Ongoing Fragility
YTD: +7% | +50% since 4/8/25 low | -5% from YTD high | Avg. member: -15%
The Russell 2000 has recorded the strongest percentage rebound of the three indexes, rising 50% from its recent trough in April. It has gained 7% year to date and is 5% below its YTD high. However, the average member of the Russell 2000 is down 15% from its high. While liquidity conditions appear to be healthy, sustained improvement in the performance of the members of the index is likely to depend on improved earnings visibility, better financing conditions, and improved demand in cyclical sectors.
Dow Jones: Relative Stability with Healthier Internal Balance
YTD: +3% | +31% since 4/8/25 low | -2% from YTD high | Avg. member: -9%
The Dow Jones has recorded an impressive 31% rebound from its recent trough in April. It has gained 3% year to date and is 2% below its YTD high. While the average member of the Dow Jones has declined 9% from its high, its composition of established companies that generate cash has provided relative balance to the performance of its members. However, sustained improvement in its performance is likely to depend on earnings confirmation.
At Zaye Capital Markets, we continue to track breadth measures, average member recovery patterns, and sector-level earnings revisions. Until internal participation accelerates meaningfully, we prefer a disciplined approach based on quality factors, not index-based momentum alone.
The Strongest Sector in All These Indices
Energy Dominates 2026 Performance, Extends Clear Leadership Gap
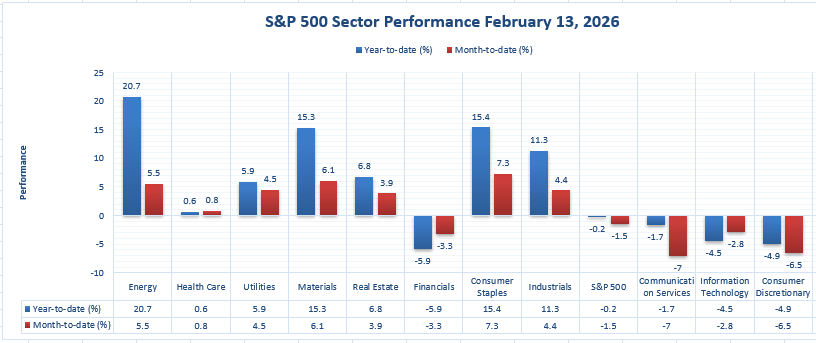
As of the most current information available, the Energy sector currently ranks as the strongest performer in the S&P 500, leading the pack in a decisive fashion on a year-to-date basis and remaining a firm positive on a month-to-date basis. The Energy sector has risen by +21.3% so far this year, or +6.1% on a month-to-date basis, making it the top performer over the longer period of time and the top performer over the shorter period of time. In a market environment in which several of the dominant sectors are down so far this year, including the S&P 500 itself at -0.1% for the year so far and -1.5% so far this month, the consistent performance of the Energy sector serves to set it apart from the rest of the field.
In terms of the actual numbers, the next closest performer so far this year is the Materials sector at +16.6%, followed by the Consumer Staples sector at +15.6%, then the Industrials sector at +12.3%. The Utilities sector at +8.7% and the Real Estate sector at +8.4% lag significantly further behind. The Financials sector at -5.9%, the Information Technology sector at -5.0%, the Consumer Discretionary sector at -5.0%, and the Communication Services sector at -2.5% all remain in the red so far this year. On a month-to-date basis, the Consumer Staples sector at +7.5% is the top performer, followed by the Utilities sector at +7.3%, then the Materials sector at +7.3%, yet the Energy sector at +6.1% still manages to keep its position firmly in the top performers. In our view at Zaye Capital Markets, the performance of the Energy sector on a dual time horizon only serves to further emphasize the dominant position of the sector in the current market structure. The +21.3% performance of the Energy sector so far this year is a decisive lead over all of the other sectors represented in the table. The fact that the sector continues to post a positive performance on a month-to-date basis in contrast to the weakness in the broader market only serves to further emphasize the point.
Earnings
Earnings – February 17, 2026 (Yesterday)
- Medtronic Plc (MDT): The company’s fiscal Q3 2026 revenue was $9.017 billion, increasing 8.7% as reported and 6.0% on an organic basis. The company’s GAAP net income was $1.143 billion, and its GAAP EPS was $0.89. Its non-GAAP EPS was $1.36, beating its guidance midpoint by $0.03. From our vantage position here at Zaye Capital Markets, we believe the real focus should be on sustaining organic growth and keeping up margins in the face of changing cost structures.
- eToro Group Ltd. Class A (ETOR): The company’s Q4 net contribution was $227 million, which made up its full-year net contribution of $868 million, increasing 10% year-over-year. Its full-year GAAP net income was $216 million, and its adjusted net income was $251 million. Its Q4 adjusted diluted EPS was $0.71. Assets under administration rose 11% in Q4, and its adjusted EBITDA was $87 million, reflecting a 38% margin. Investors should look into whether this level of engagement can sustain its resilience in terms of margins.
- Palo Alto Networks, Inc. (PANW): The company’s fiscal Q2 revenue was $2.6 billion, increasing 15% year-over-year. Its GAAP net income was $432 million, and its non-GAAP EPS was $1.03, beating its guidance. Its Next-Generation Security ARR was up 33% year-over-year to $6.3 billion, and its remaining performance obligation was up 23% year-over-year to $16.0 billion.
- Energy Transfer LP (ET): Q4 results: $25.32 billion in revenues, a year-over-year increase of 29.6%. Net income attributable to partners: $928 million. Net income per common unit: $0.25. Adjusted EBITDA: $4.18 billion. Year-over-year increase of 8%. Distributable cash flow attributable to partners: $2.04 billion. Full-year 2025 results: $16 billion in adjusted EBITDA. Record results. Year-over-year increase of 3%. Raised 2026 guidance. Durability of cash flow and capital allocation.
Earnings — February 18, 2026 (Today)
- Booking Holdings Inc. (BKNG): Investors will be looking for updates on booking volumes, average daily rates, and forward travel demand guidance. The margin path and any comments on discretionary spend will also be key.
- Moody’s Corporation (MCO): Ratings revenue trends, analytics segment growth, and any management comments on credit issuance activity will be key. Investors will also be looking for any comments on the credit cycle and credit demand.
- Analog Devices, Inc. (ADI): Investors will focus on trends in industrial and automotive end markets. The company will also be providing updates on inventory normalization and gross margin trends. Semiconductor end market recovery will also be a key topic for investors.
- Glencore plc: Production volumes of commodities, pricing sensitivity, and free cash flow will be key. Any comments on exposure to metals and energy will also be important. These will be key to assessing durability in a changing world.
Stock Market Overview – Wednesday, 18 Feb 2026
US equities are trading with cautious resilience as investors weigh the results of corporate earnings, scrutiny of artificial intelligence infrastructure spending, and macro crosscurrents. While US stocks remain near record levels, the list of market leaders has shrunk, especially in the realm of mega-cap technology stocks. At Zaye Capital Markets, we see this as a rotational market rather than a traditional risk-off environment, with capital flowing into defensive stocks, infrastructure-related stocks, and stocks with demonstrated earnings power.
Stock Prices
Economic Indicators and Geopolitical Developments
US economic indicators have continued to show moderation rather than contraction, which keeps the expectation of policy stability in the near term intact. Yields remain firm as the market digests the rate of disinflation. Geopolitically, US trade tensions and export controls continue to play an important role, especially in the realm of semiconductors. Export controls have changed the capacity allocation in the semiconductor ecosystem, which indirectly affects the shipping and pricing power dynamics.
Latest Stock News
- $AAPL | Apple is continuing to attract capital flows in the technology space as the company’s balance sheet is deemed attractive in the face of current scrutiny of artificial intelligence infrastructure spending.
- $NVDA | Nvidia continues to be an area of focus. According to an update by Evercore, the Vera Rubin project timeline has been advanced by 3-6 months. Export bans in China could free up capacity, allowing shipments to commence as early as Q2’26. SoftBank fully exited their position in Nvidia in Q4. Nvidia and Meta are expanding their partnership to deploy Nvidia’s full stack of AI solutions within Meta’s hyperscale data centers, including Blackwell, Rubin, Grace, and Spectrum-X.
- $META | Meta is directly placing Manus agents within their messaging and social platforms, further solidifying their position within distribution layers while continuing to scale their infrastructure deployment with Nvidia.
- $AMZN | Berkshire Hathaway trimmed their position in Amazon by approximately 77% in Q4, which could indicate portfolio rotation given their sensitivity to valuation.
- $NFLX / $WBD | Netflix granted Warner Bros. Discovery a 7-day window to restart negotiations with $PSKY, which could indicate changes in the streaming space.
- $FIG | Figma, in partnership with Anthropic, launched “Code to Canvas,” which allows users to convert code written with Claude directly into Figma designs.
- $ONDS | Ondas’ Sentrycs was selected by German State Police for counter drone solutions. They believe their five-year handheld C-UAS market opportunity is worth $9.8B.
- $GENM | General Mills fell following their announcement to lower profit expectations, which could indicate challenges within staple stocks.
- $GPC | Genuine Parts fell following their earnings announcement, which disappointed on a relative basis, further emphasizing stock-specific risk.
The Magnificent Seven and the S&P 500

The ‘Magnificent Seven,’ consisting of Apple Inc., Microsoft Corp., Nvidia Corp., Amazon.com Inc., Meta Platforms Inc., Alphabet Inc., and Tesla Inc., are still key contributors to market performance but are being negatively impacted by increasing focus on AI capital intensity and valuation multiples. These stocks have generated the bulk of the S&P 500’s gains over the last year and are therefore having a large impact on market performance due to profit-taking on these names. The overall market may not have enough breadth from sectors such as industrials and financials and small-caps to propel the market further.
Major Index Performance as of Wednesday, 18 Feb 2026
- Nasdaq: Currently trading near 22,578.38 and experiencing mixed performance due to continued volatility in mega-cap tech.
- S&P 500: Currently trading near 6,843.22 and experiencing marginal positive performance due to selective leadership.
- Dow Jones: Currently trading near 49,533.19 and experiencing relatively stable performance due to contributions from defensives and financials.
- Russell 2000: Currently trading near 2,650 and experiencing moderate resilience.
At Zaye Capital Markets, we maintain a selective risk-on stance. Concentration risk within mega-cap technology remains a defining feature of the market. Until breadth meaningfully expands and earnings confirmation strengthens across sectors, disciplined allocation toward quality balance sheets, recurring cash flows, and structurally supported industries remains our preferred approach.
Gold Price: How Do Inflation Data, Durable Goods Orders, and Geopolitics Impact Gold Prices Today?
The spot price of gold is currently trading around $4,940/oz on Wednesday, 18th February 2026. The price of gold has been consolidating around the psychological barrier of $5,000/oz after witnessing significant fluctuations in recent times. The price movement of gold is influenced by balancing factors such as moderate inflation rates, stable interest rates, and shifting geopolitical factors. The recent spurt of cultural and political comments made by the White House regarding international negotiations and discussions has not led to any significant geopolitical risks. However, comments regarding negotiations with Iran and other international talks have kept the geopolitical factor alive in the prices of gold. Meanwhile, today’s scheduled economic announcements such as GBP CPI YOY and US Core Durable Goods Orders Month Over Month and US Durable Goods Orders Month Over Month are critical in determining the near-term directional movement of prices. If inflation rates in the UK increase beyond expectations today, it will lead to an increase in global inflation rates, indirectly favoring gold prices. However, if US durable goods orders increase beyond expectations today, it will indicate strong economic growth in the US, which will positively impact the US dollar, leading to a negative impact on gold prices.
The economic announcements made yesterday regarding labor stabilization and moderate inflation rates have led to stable interest rates. The stable interest rates indicate that there is no need to invest in safe-haven assets such as gold in the near term. However, this does not imply that there is no fundamental support to gold prices. The moderate interest rates combined with moderate inflation rates indicate that there is no need to invest in gold in the near term. The prices of gold are currently influenced by factors such as currency values and growth rates. If durable goods orders increase beyond expectations today, it will indicate that capital expenditure in the US economy is strong, which will positively impact equity markets. However, any negative surprise in durable goods orders will lead to safe-haven demand in gold prices. The prices of gold are currently consolidating in a macro environment in which inflation rates, dollar values, and international negotiations are critical in determining prices.
Oil Prices: What Are the Current Impacts of Inflation Figures, Durable Goods Orders, and Iran Negotiations on Oil Prices?
Brent crude is trading at around $67 a barrel, and West Texas Intermediate (WTI) crude is trading around $62 a barrel as of yesterday, Wednesday, 18th February 2026. The crude oil market is experiencing a balancing act of geopolitics and other economic variables. The crude oil market dipped slightly following reports of renewed negotiations on Iran. When negotiations are on track, even without any formal agreement, there is a natural reduction in the probability of supply chain disruptions in the region. However, the crude market’s fall has been restricted by underlying expectations of supply discipline from OPEC and monitoring of global crude oil inventories. Meanwhile, other macroeconomic variables have been influencing crude oil markets. Yesterday’s labor and inflation data provided further evidence of moderation rather than contraction. This is not a strong enough indicator to stimulate the economy but also does not point to a collapse in consumption. The crude market is not falling significantly as it tries to gauge the sustainability of growth to support consumption.
The upcoming announcements that are due today and are important for the short-term direction are GBP CPI Year Over Year and US Core Durable Goods Orders and Durable Goods Orders Month Over Month. Robust announcements of durable goods orders that beat expectations will highlight the buoyancy of industrial and capital expenditure growth, thereby positively influencing fuel demand forecasts and oil prices. Conversely, disappointing announcements may exacerbate concerns of slower growth in manufacturing activity and negatively impact fuel demand forecasts and oil prices. In this environment, oil price direction is not being driven by individual events but rather the interplay of various factors such as the impact of diplomatic risk adjustment, OPEC and IEA supply and demand forecasts, and overall macroeconomic trends. The oil price direction that is currently being reflected is that of a market that is cautious and highly sensitive to changes in growth and geopolitical narratives.
Bitcoin Prices: How Do Inflation Figures, Durable Goods Orders, and Geopolitical Events Affect Bitcoin’s Current Price Trends?
The Bitcoin price is trading around $67,200 to $67,600 on Wednesday, February 18, 2026. The Bitcoin price is still under pressure following a fall to a low around the $67,000 mark during the previous week. The Bitcoin price is still consolidating around the $68,000 resistance level. The Bitcoin price is trading below key moving averages, which suggests a negative short-term outlook. The $66,000 level is considered a key support level for the Bitcoin price. The $65,000 level is also considered a potential extension of a negative move if the selling pressure on the Bitcoin price increases. The weakness in other major cryptocurrencies also suggests that the Bitcoin price is not alone in the negative move. The Bitcoin price is trading around €79,000 in European markets. The Bitcoin price is also trading down in Latin American markets. The weakness in the Bitcoin price is still moderate. The participation in European ETFs is still steady. The participation in European ETFs suggests that the interest in Bitcoin and other cryptocurrencies from institutional investors is still intact. The ongoing debate regarding spam-blocking updates to the Bitcoin protocol is still ongoing. The Bitcoin price is still unaffected by the updates. The Bitcoin price is still largely affected by macroeconomic factors.
White House communications related to cultural events have had little direct influence on crypto pricing, although comments related to negotiations with Iran and upcoming talks have had an indirect influence on overall market sentiment. As tensions ease or move into negotiation stages, the safe-haven flows into crypto assets decrease immediately, especially as equities continue to stabilize or improve. Yesterday’s economic figures, which showed continued moderation in inflation and cautious labor numbers, further support the likelihood of continued steadiness in monetary policy, removing the potential for significant upside in high-beta assets like Bitcoin. Today’s figures, which include inflation and US durable goods, have more direct influence over crypto pricing. Favorable economic figures have the potential to increase the dollar, further decreasing the need for liquidity and putting pressure on Bitcoin, while unfavorable figures may create further interest in alternative stores of value and risk-adjusted crypto assets. As such, the Bitcoin ecosystem is currently working within a macro-sensitive consolidation period, where inflation, the dollar, negotiations, and overall sentiment remain the primary drivers of near-term price action.
ETH Prices: How Are ETF Flows and Whale Movement Affecting the Direction of the Price of Ethereum Today?
The price of Ethereum is currently trading at levels slightly below $2,000 on Wednesday, 18th February 2026, as the cryptocurrency fluctuates within the range of $1,900 and $2,100 over the recent trading period. The momentum behind the cryptocurrency seems weak as the price of Ethereum is seen consolidating below major moving averages. The spot flows for Ethereum ETFs have been somewhat positive over the recent trading week as the cumulative assets managed to hold at multi-billion-dollar levels due to net inflows. However, the spot flows for the cryptocurrency did not manage to break the resistance level as the derivatives markets saw the open interest for the cryptocurrency cooling off. The exchange reserves for the cryptocurrency saw incremental flows moving towards the trading venues, which can be seen as a sign of supply pressure for the cryptocurrency. The cryptocurrency seems to be trading at a macro-sensitive level as it reacts to changes in capital flows and liquidity expectations rather than changes in the protocol.
Whale activity in the last week has also become an additional factor of influence. It has been reported that large holders have been cutting long positions in the resistance area, but in doing so, they have also maintained their large positions, effectively increasing the sell liquidity in the $2,050-$2,100 area in the near term. Yesterday’s inflation data and the continued stability in the labor markets have eased the chances of aggressive monetary easing, impacting the speculative interest in high-beta assets such as Ethereum. The economic data released today, including inflation and durable goods, could have further implications on the liquidity conditions in the Ethereum market. A stronger economic report could have positive implications for the dollar, impacting Ethereum negatively, while a weaker report could have positive implications for altcoins as investors become increasingly concerned about the economic outlook. In the current environment, the Ethereum ecosystem is being driven by ETF flow momentum, whale positioning, and macro-driven liquidity conditions, as opposed to the fundamentals of the Ethereum blockchain.
