Where Are Markets Today?
U.S. and European equity futures are declining this morning, indicating a cautious start for major global equity indexes. Dow futures declined by about 0.5%, while S&P 500 and Nasdaq 100 futures declined by about 0.4%. This follows the weakness experienced in the technology sector in the previous session. European equity futures are following a similar trend, with major futures contracts slightly in the red as investors digest the weakness experienced on Wall Street yesterday. Markets are trading lower today due to the weakness experienced in the technology sector and the sensitivity experienced ahead of inflation data releases.
The first major cause for the decline in futures today was the large negative reaction experienced by major technology stocks after their respective earnings announcements. Although technology stocks reported better-than-expected results, investors sold stocks as the results were announced due to fatigue and increasing doubt about the long-term prospects for technology stocks at current valuations. Nvidia’s large decline contributed to the weakness experienced in futures today as a result of its large weighting in major equity indexes. The weakness experienced in the technology sector was driven by increasing doubt about the level of spending by hyperscalers, as well as their margins, and the extent to which the AI trade may have run its course.
The second fundamental factor is related to macroeconomic uncertainty, specifically with regard to the inflation rate and interest rate paths. Market participants will be focusing on the release of the January producer prices, with headline and core readings both expected to come in at around 0.3%. If the data comes in hotter than expected, it will further support the narrative of rates staying higher for longer, leading to increased bond yields and pressures on equity markets, particularly growth stocks. On the other hand, a softer reading will provide near-term relief but will be viewed through the lens of slowing demand. European markets will be equally vulnerable to these fundamental drivers, as the global inflation rate picture and US monetary policy direction have a significant bearing on capital flows, currency strength, and overall risk appetite. In addition, the current geopolitical tension, as well as the rhetoric around tariffs, will also be contributing to the current defensive stance. At Zaye Capital Markets, we view the current futures positioning as a result of low market breadth and valuation sensitivity, as opposed to any systemic issues. Financials and industrials, the so-called cyclical sectors, have been relatively resilient, but overall market breadth is still limited. Until the inflation picture becomes clearer, with participation from a wider range of stocks beyond the current mega-cap names, markets will be vulnerable to the macro data releases, as well as the earnings momentum. This current day’s inflation data will be crucial in determining whether the global markets will stabilize going into the end of the month or whether the current consolidation will spill over into the new month.
Significant Index Levels as of Friday, 27 Feb 2026
- Nasdaq Composite: ~23,255, -1.4% on the day as the technology sector unwinds from its recent earnings-related moves.
- S&P 500: ~6,918, -0.8% change as a result of concentrated selling pressures affecting large-cap stocks.
- Russell 2000: ~2,641, slightly up as a gauge of small-cap value stocks showing relative resiliency.
- Dow Jones Industrial Average: ~49,241, slightly down but holding relatively better compared to other major market gauges.
The Magnificent Seven and the S&P 500
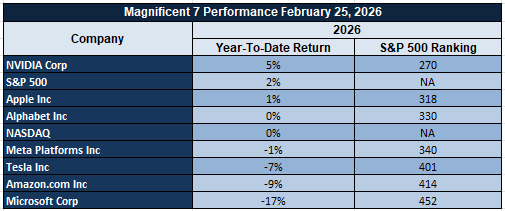
The “Magnificent Seven” – Apple, Microsoft, Nvidia, Amazon, Meta, Alphabet, and Tesla – remain the key level to watch for market direction. They’re being sold as the market no longer rewards “great” stocks, only “perfect” stocks. Dense valuations and extreme positioning make any change in market narrative cause large moves. This explains why the S&P 500 can appear to be holding up well, yet the internals can be struggling as a result of concentration risk. A small number of stocks can dominate the market moves due to their large market capitalization.
Drivers Behind the Market Move – Friday, February 27, 2026
As the U.S. and European markets face an uncertain combination of inflation risk, monetary policy signals, and tech sector repricing, market sentiment remains guarded. Both sides of the Atlantic are indicating sensitivity to key macroeconomic statistics and geopolitics over the last 24 hours. Below are the key market drivers influencing market direction today.
1. Inflation Data Risk and Rate Sensitivity
The markets are positioned cautiously prior to the release of U.S. Core PPI, Headline PPI, and German Preliminary CPI data. This data release is vital to the market as it directly affects interest rate decisions. A higher-than-expected inflation report would likely reinforce the “higher-for-longer” interest rate narrative, which would put additional downward pressure on equities, especially high-multiple growth stocks. Conversely, if inflation data disappoints, this would likely provide some relief to bond markets and equities in the short term. The European markets are also vulnerable to inflation data risk as German inflation data serves as a leading indicator for inflation in the Eurozone.
2. Technology Earnings Repricing and AI Capital Expenditure Scrutiny
The latest earnings response from mega-cap technology and AI-related companies has impacted overall market indices negatively. Although these companies’ revenues and forward growth projections are strong, investors are not responding favorably to these stocks due to concerns about valuation compression and hyperscaler capital expenditures. The overall negative sentiment from these technology stocks is impacting US market indices significantly; European markets are also moving in line with these sentiments due to their exposure to global technology demand and supply chains.
3. Policy Signaling, Tariff Strategy, and Regulatory Developments
The latest signals from the White House on continued support for tariff strategies, labor rule changes, and fiscal oversight have reinforced a narrative around policy assertiveness. Although no major policy decisions have been made recently, these ongoing communications around trade policies are impacting overall market sentiment negatively. Markets are usually not impacted by policy decisions; however, these decisions are impacting overall market sentiment negatively due to concerns about cost structures and overall global supply chains.
In conclusion, inflation anticipation, technology stocks’ negative movement, and policy signaling are impacting overall market sentiments negatively today. Markets are adopting a cautious stance as investors are waiting to see whether inflation is reducing to a level where overall interest rates stabilize to encourage broader equity participation from various industries.
Digesting Economic Data
The TRUMP Tweets and Their Implications
The latest White House comments represent a change in messaging on institutional strength, domestic enforcement, and national positioning. The comment on the First Lady’s role in chairing a meeting of the United Nations Security Council on the topics of children, technology, and education in conflict represents an attempt to reinforce diplomatic efforts while maintaining a technologically advanced image in international forums. From an investment perspective, this event does not directly influence monetary or fiscal policies but represents an aspect of geopolitics that can influence market sentiment given the sensitivity of investors to global coordination efforts. An increase in international activity can represent stability in a multinational setting or create market volatility depending on the topics being addressed.
From a domestic perspective, the judicial decisions allowing the continued expansion of the White House ballroom and declining to block the elimination of union bargaining for many federal workers reinforce institutional strength and the continuance of administration policies. The reintroduction of the joint employment rule by the labor authority represents an additional level of complexity for corporations with business models that rely on a franchise structure. The elimination of the influence of unions in federal worker compensation may limit the potential for wage inflation in these areas, but the reintroduction of the joint employment rule may create additional costs for corporations to comply with these standards.
Fiscal and enforcement-related themes also have capital allocation and spending flow implications. The recent pause in Medicaid funding for Minnesota, which deferred $259 million with total potential funding exceeding $1 billion, reflects a compliance-focused approach from the federal level. From a macroeconomic perspective, a pause in funding can have liquidity implications for healthcare providers. The USDA’s initiative to improve efficiency through a reduction in federal real estate footprint and address over $1 billion in deferred maintenance reflects a focus on operational efficiency. From an investor’s perspective, these initiatives may be viewed as part of a broader effort to improve efficiency in the federal balance sheet, which could have implications for infrastructure spending models and contractor revenues.
Finally, the ongoing defense of the administration’s tariff strategy, border control, and executive power discussions suggest a policy that maintains a balance between economic nationalism and centralization of power at the executive level. For capital markets, the ongoing presence of tariffs may be the most impactful theme, as trade costs ultimately drive inflationary pressures. While none of the recent statements directly address capital markets, we view the collective themes as maintaining a policy environment that remains supportive of a cautious approach for investors until greater clarity emerges on trade and fiscal policy.
Kansas City Manufacturing Index Rebounds; Early Demand Cycle Strengthens
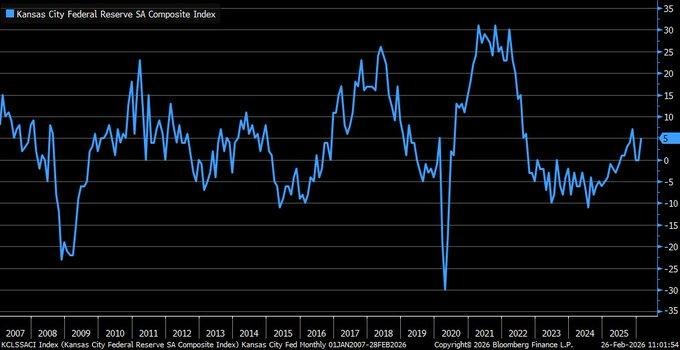
The Kansas City Manufacturing Composite Index for February rose to 5 from 0 in January, beating forecasts and signaling a shift back to expansion for the Tenth District. The strength of the rebound is noteworthy given the stabilization of previous contractions and may signal the start of the early recovery cycle for regional industrial activity. The sharp rebound in new orders to 7 from 0 may signal fresh demand rather than the clearing of backlogs. The shipments component rebounded to 11 from negative territory and supports the view of improving order books fueling regional output. The prices paid component eased slightly to 42 but may help stabilize producer margins given its deceleration.
This uptrend in new orders and shipment increases indicates that the sector is moving forward rather than being subject to volatility. Being one of the first regional surveys, the data provides forward guidance in anticipation of the overall national manufacturing data. If the trend continues with the results of other surveys and the overall purchasing managers data, it will provide further support to the narrative of a gradual recovery in the sector in line with the expectations of a soft landing. Moreover, with input prices easing, the risk of margin pressure is also alleviated, while the uptrend in output supports fixed cost absorption for companies in the capital goods and industrial equipment space.
At Zaye Capital Markets, we believe that Emerson Electric Co. (EMR) is an undervalued play in the backdrop of the improving industrial sector. Being in the space of automation systems, process optimization tools, and intelligent infrastructure solutions, the company benefits from the uptrend in the sector. Analysts should watch the national manufacturing data releases, durable goods orders, industrial production data, and capital expenditure guidance to see if the uptrend in new orders converts into a broader trend in the sector.
Software Job Postings Increase Significantly, an Indicator of an Expansion in Labor Demand due to AI
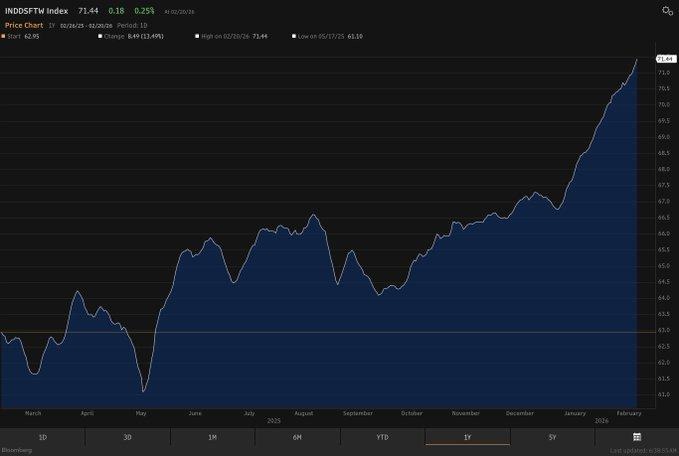
The recent software job market figures have clearly shown that job postings are making a decisive recovery, with the software job market index increasing by 13.9% to 71.44, having previously fallen as low as 61.10 in mid-2025. This is a clear indication that labor demand is reaccelerating in software engineers and technical developers, a period when job displacement due to automation was a major concern. The recent job market figures are an indication that labor demand is actually increasing due to technological adoption, contrary to the common perception that automation is a labor displacement tool. When considering this from a macroeconomic perspective, an increase in job postings in high-skilled jobs in the technological sector is a clear indication that businesses are still investing in digital transformation, data systems, and AI.
However, the structural interpretation is vital. When productivity tools decrease the cost of development, the overall volume of software creation can grow as the barriers to entry decrease and customization becomes more affordable. This can boost the overall demand for engineers, architects, and integrators. In the overall labor market picture, the resilience in the demand for software workers aligns with the low levels of unemployment in the tech sector and supports the case for the overall economy to continue growing without fueling inflationary pressures in wages. The overall strength in the demand for high-skilled workers also supports the case for overall household income stability, thereby supporting the overall resilience in consumer spending as well as the continuity in capital expenditures in the overall tech sector.
From the perspective of Zaye Capital Markets, Microsoft Corporation (MSFT) appears undervalued in the overall environment of renewed hiring momentum in the software sector. The company benefits directly from the overall environment of increased software creation as it is a cloud infrastructure provider, an enterprise software development tool provider, and an artificial intelligence integrations provider. Analysts should track the overall hiring trends in the tech sector as well as the overall demand for enterprise software and cloud services to determine if the overall hiring acceleration in the software sector continues to boost the overall revenue growth of the overall tech sector.
Initial Claims Edge Up Slightly, Reentry Rate Confirms Resilience of the Labor Market
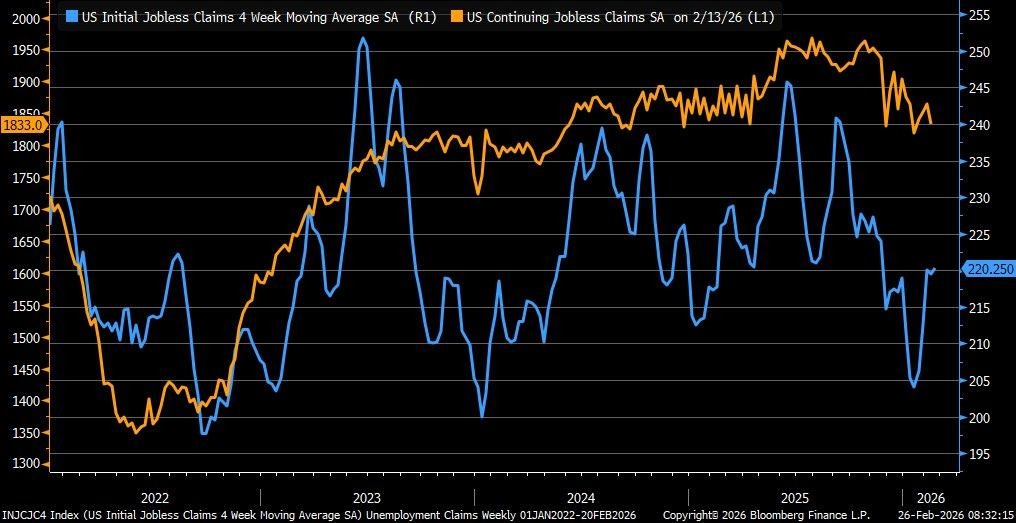
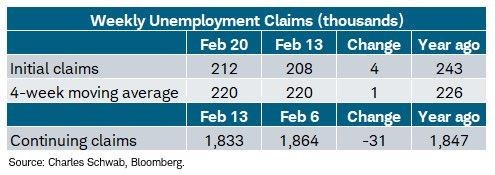
Initial claims for the week have risen slightly to 212,000, increasing by 4,000 but still below market consensus estimates. More importantly, continuing claims have fallen to 1.833 million, which suggests workers are reentering the labor market at a faster rate than before. The four-week moving average continues to hold steady around 230,000, which suggests layoffs have not accelerated significantly over this period. The steady rate of new entrants to the labor market combined with declining continuing claims suggests a labor market that is cooling but not structurally weakening. From a macroeconomic perspective, this suggests steady income growth combined with sustained consumer spending without fueling inflationary pressures in the labor market.
Regional variations also offer some interesting insights. Industrial states and financial centers have seen significant declines in claims, which suggests robust growth in manufacturing activity and financial services employment. Conversely, smaller states have seen localized increases in claims, which suggests sectoral adjustments but no underlying systemic issues. The declining trend in continuing claims from previous highs above 1.9 million also suggests underlying labor absorption capacity. When reemployment accelerates even as layoffs increase slightly, this suggests fluid labor market conditions. From a market perspective, this suggests lower recession probability but sustained pressure for policy normalization.
At Zaye Capital Markets, we have identified Home Depot, Inc. (HD) as undervalued in this environment of a stable labor market. A stable labor market suggests household income confidence, which in turn suggests spending on home improvements and discretionary home renovations. With labor stability firmly in place, retail spending in this segment could remain robust even in a slowing economy. Analysts should monitor wage growth trends, consumer confidence data, retail sales components, and housing turnover to gauge whether labor stability translates into sustained household spending momentum.
Consumer Confidence Rises, But Sentiment Gap Signals Caution
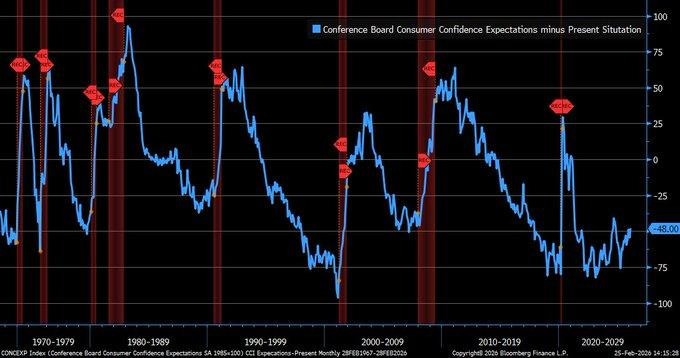
The February Consumer Confidence Index improved modestly to 91.2 from 89.0, reflecting incremental optimism. However, the internal composition reveals a more complex signal. Expectations advanced sharply to 67.8, while the Present Situation component declined to 127.6. The resulting spread of +48.0 points marks one of the widest divergences in recent cycles. Historically, when forward expectations rise significantly while current conditions soften, it often reflects hope-driven sentiment rather than realized economic strength. This divergence has previously preceded periods of economic slowdown when optimism failed to translate into durable income and spending gains.
The broader implication lies in behavioral economics. When households anticipate improvement but feel present strain, spending decisions can become uneven. Consumers may delay major purchases while maintaining essential expenditures, creating volatility in discretionary demand. The growing emphasis on forward-looking language within corporate disclosures further reinforces this pattern, suggesting businesses are projecting confidence even as near-term operating conditions remain pressured. Such divergence can support equity valuations temporarily, but without confirmation from income growth, credit expansion, and retail momentum, expectations risk resetting.
At Zaye Capital Markets, we view Walmart Inc. (WMT) as relatively undervalued in this bifurcated sentiment environment. When consumers feel cautious in the present yet optimistic about the future, value-oriented retailers with pricing power and scale typically gain share. Defensive consumer franchises tend to outperform during sentiment divergence phases, benefiting from trade-down dynamics and steady foot traffic. Analysts should monitor retail sales trends, credit card spending patterns, consumer delinquency rates, and wage growth data to determine whether expectations convert into sustained purchasing activity. If optimism fades without income acceleration, defensive consumer equities may continue to attract capital.
Home Selling Times Lengthen, Signaling Buyer Leverage Shift
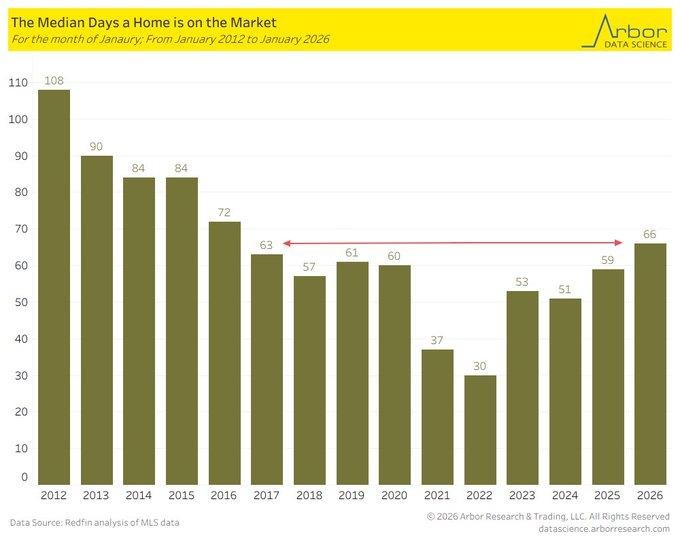
Home selling times have lengthened to a median 66 days in January. This is an increase from 59 days a year ago. This is the slowest January home selling rate since 2017. It is clear that increasing inventory levels coupled with mortgage rates remaining in the 6.5-7% range have slowed down the rate of home transactions. Longer home listing periods mean that homebuyers have become more discerning in their purchasing behavior. This is a clear indication that home prices have peaked. It is worth noting that while home demand is still strong, the rate at which homes are being sold has slowed down enough to warrant a structural shift in the market.
From a macroeconomic perspective, it is clear that a longer home selling period is a precursor to a stabilization in home prices. This is especially true for regions with mortgage rates that have been elevated for a while. A prolonged mortgage rate has a direct impact on the rate at which people can afford homes. This means that first-time homebuyers will be fewer in the current market. However, it is worth noting that some regions have continued to exhibit faster home selling rates. This is a clear indication that some regions have been able to remain insulated from the macroeconomic conditions. This is a clear indication that demographics play a role in the macroeconomic environment.
At Zaye Capital Markets, we believe that D.R. Horton, Inc. (DHI) is undervalued in this market environment. This is due to the fact that it is a leading homebuilder with a focus on entry-level homes. This means that it has a significant scale advantage that will come in handy in a slower market. It is worth noting that analysts should focus on mortgage rate trends, new home construction levels, building permits, and new home inventory levels. This will give them a better indication of whether the rate at which homes are selling is stabilizing. This is a clear indication that a slower market environment is a precursor to a more sustainable market equilibrium.
Refinancing Gains Mask Underlying Purchase Weakness
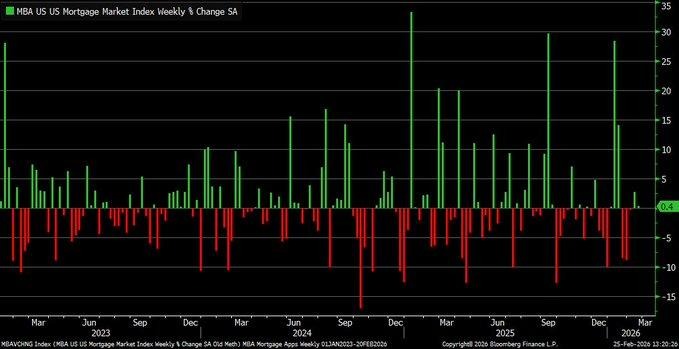
In the latest housing data release, mortgage applications rose by 0.4% week-over-week, but this growth slowed considerably from the previous 2.8%. The growth was driven by a 4.1% increase in refinancing activity as interest rates fell below 6% for the first time in several years. The interest rate decline has clearly helped to boost refinancing activity as individuals are able to reduce their monthly payments and improve their cash flows. However, purchases actually fell by 1%, which indicates that interest rates alone are not yet sufficient to boost housing transactions. This dichotomy clearly shows that affordability constraints and higher housing prices are still important factors for the housing market.
In addition, historical volatility of the mortgage index has shown that since the start of the aggressive interest rate hikes by the Fed, mortgage activity has experienced sharp contractions followed by periodic recoveries. The recent stabilization of the housing market is clearly driven by the relief of interest rates. However, the recent diminishing growth rate clearly shows that the housing market has not yet recovered. While refinancing activity will boost cash flows for individuals and improve consumption, housing activity will not improve until purchase applications start to grow.
At Zaye Capital Markets, we consider Lowe’s Companies, Inc. (LOW) to be relatively undervalued given the dichotomy of the housing market. This dichotomy clearly shows that refinancing activity will boost cash flows for individuals and improve consumption. This will be particularly important for the housing market as individuals will be more inclined to improve their homes rather than purchase new ones. Analysts should monitor purchase applications and interest rate direction to confirm whether or not housing-related consumer equities will benefit from the recent refinancing activity.
Upcoming Economic Events
German Prelim CPI m/m, USA Core PPI m/m, USA PPI m/m
The markets are about to face a crucial inflation period, and the next couple of days will be extremely sensitive. Even the slightest deviation from market expectations can lead to significant changes in the market. Currently, inflation data remains the primary market mover for monetary policy recalibrations. This week, inflation data from Europe and the United States will act as forward guidance for monetary policy. Preliminary inflation data from Germany will act as a harbinger of inflation stability in the Eurozone, while inflation data from the United States will act as forward guidance for future consumer inflation.
German Prelim CPI m/m
- A higher inflation reading from Germany compared to market expectations will mean that inflation remains high in the Eurozone’s largest economy. This will lead to higher sovereign bond yields in Europe, as the market will expect the ECB to ease monetary policy at a slower pace. It will also lead to a shift in the equity market, especially in rate-sensitive stocks. It will also lead to a positive impact on the Euro, as the yield differentials will increase.
- However, if inflation remains lower compared to market expectations, it will reinforce the disinflationary narrative, which the ECB and the Fed want to see. Lower inflation will lead to lower bond yields, which will ease monetary conditions. It will also lead to higher equity market sentiment, especially for cyclical stocks.
USA Core PPI m/m and PPI m/m
Producer price inflation in the United States is viewed as a leading indicator of cost inflation in the consumer economy.
- If the data releases are higher than market expectations, it would signal rising input costs. It would also lead to higher bond yields as the market would delay the assumption of rate cuts. It would also put pressure on equity markets, especially on stocks with high valuations in the growth space. Companies with weak pricing power are likely to face margin pressure risks.
- On the contrary, if the data releases are lower than market expectations, it would signal easing upstream cost pressures. It would lead to higher corporate margins, reduced inflation pass-through risks, and lower treasury yields. Equity markets, especially technology, housing, and consumer discretionary, are likely to benefit from better valuation support and higher earnings visibility.
At Zaye Capital Markets, we recommend paying close attention to the immediate market reactions in the bond market, dollar movements, and sectoral trends following the release of the data. A synchronized downside surprise in inflation data releases from the United States and Europe would strengthen the soft landing narrative, supporting risk assets.
Stock Market Performance
Indexes Rebound from April Lows, But Drawdowns Reveal Thin Breadth

The US stock markets have registered an impressive rally since the lows recorded on April 8, 2025. However, the markets’ year-to-date performance is not without its share of problems. At Zaye Capital Markets, we believe that the stock markets’ recent stability is not without its share of problems. We’ve created the following table strictly based on the figures:
S&P 500: Modest YTD Gain, Narrow Participation
YTD: +1% | +39% since 4/8/25 low | -3% from YTD high | Avg. member: -12%
Since the lows recorded on April 8, 2025, the S&P 500 Index has recorded a 39% gain. However, the index is only up 1% since the beginning of the year and is down 3% from its YTD high. What is more concerning is the fact that the average member stock in the index is down 12% from its YTD high and 22% since the lows recorded in April.
NASDAQ: Powerful Rebound, Deep Internal Volatility
YTD: 0% | +52% since 4/8/25 low | -6% from YTD high | Avg. member: -25%
The NASDAQ has rallied 52% from the April lows as the growth sectors have recovered strongly. However, the year-to-date returns are at 0%, with the index down 6% from the YTD high. Moreover, the average constituent has experienced a drawdown of -25% from the YTD high and -46% from the April 8th lows.
Russell 2000: Strong Recovery, Structural Pressure Remains
YTD: +7% | +51% since 4/8/25 low | -5% from YTD high | Avg. member: -18%
The small-cap space has rallied 51% from the April lows and is up 7% year-to-date. However, the average member is down -18% from the YTD high and -34% from the April 8th lows.
Dow Jones: Relative Stability with Moderate Depth
YTD: +3% | +31% since 4/8/25 low | -3% from YTD high | Avg. member: -10%
The Dow Jones has rallied 31% from the April lows and is up 3% year-to-date. Although the index is relatively stable with a drawdown of merely -3% from the YTD high, the average member is down -10% from the YTD high and -18% from the April 8th lows.
At Zaye Capital Markets, we are extremely selective in our approach. Although the indices have rallied strongly from the lows, the average constituent is down significantly from the YTD high and the April 8th lows. Sustainable markets require participation from the broader universe.
The Strongest Sector In All These Indices
Energy Leads Year-to-Date, While Utilities Dominate the Month
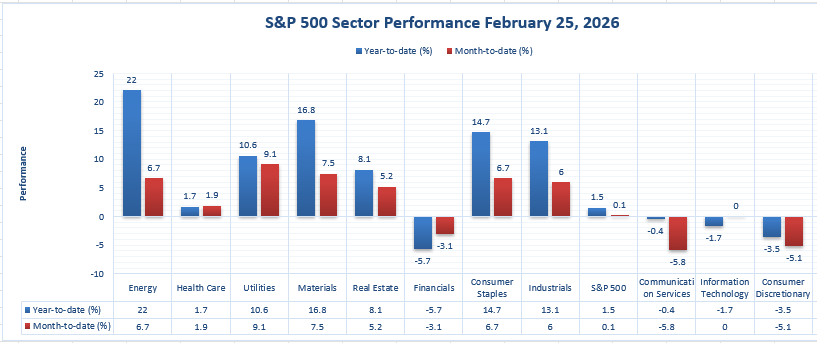
We are seeing a clear leadership separation in the sector scoreboard. When you look at year-to-date, Energy is clearly in a leadership position, with a +22.0% return contribution well ahead of Materials at +16.8%, Consumer Staples at +14.7%, and Industrials at +13.1%. This means that the strongest “all weather” leadership in the market has been in one sector, and that sector is Energy, with the highest absolute return contribution, while the overall market is only up +1.5% year-to-date.
When you look at month-to-date, however, Utilities is in a leadership position, with a +9.1% return contribution that is well ahead of Materials at +7.5%, Energy and Consumer Staples at +6.7%, and Industrials at +6.0%. This means that while Energy is clearly in a leadership position year-to-date, Utilities is in a leadership position month-to-date, capturing the freshest incremental demand in the market.
The takeaway is that “strongest” is relative and depends on the timeframe you are considering. The sector that is in a leadership position year-to-date is Energy, with a +22.0% return contribution, and Utilities is in a leadership position month-to-date, with a +9.1% return contribution. The question is whether this leadership will continue, especially considering that some of the weaker sectors are still lagging significantly, such as Financials that are down -5.7% year-to-date and -3.1% month-to-date, Communication Services that are down -0.4% year-to-date and -5.8% month-to-date, Information Technology that is down -1.7% year-to-date and 0.0% month-to-date, and Consumer Discretionary that is down -3.5% year-to-date and -5.1% month-to-date.
Earnings
Earnings Recap – 26-Feb-2026
- Dell Technologies (DELL) Revenue of $33.4 billion (+39% YoY) was reported for the fiscal Q4, with GAAP EPS of $3.37 (+57%) and a new record of $3.89 (+45%) non-GAAP EPS. Revenue of $113.5 billion (+19%) was also reported for the fiscal year, with a new record of $10.30 (+27%) non-GAAP EPS. This is due to the powerful demand for AI servers, enterprise infrastructure refresh, and cost discipline. We expect increased operating leverage as fixed costs will be spread over the increased volumes. The scale of growth represents the continued enterprise CAPEX spend driven by AI workloads and data center expansion.
- Intuit (INTU) Revenue of $4.7 billion (+17% YoY) was reported, with GAAP EPS of $2.48 and non-GAAP EPS of $4.15, beating the street. Global Business Solutions revenue growth of 18% (21% ex Mailchimp) represents continued ecosystem growth across small and mid-sized businesses. Consumer segment growth also accelerated significantly during the tax season ramp. Revenue growth of $21.0 to $21.2 billion, EPS of $22.98 to $23.18, represents a growth rate of 12% to 15%. This represents the strength of the subscription business.
- CoreWeave (CRWV) Revenue of $1.57 to $1.6 billion (+110% YoY) was reported, with revenue of $5.1 to $5.13 billion (+168%) revenue growth. Revenue backlog of $66.8 billion represents multi-year demand visibility of the AI cloud business. However, the Q4 loss of around $452 million is a result of heavy infrastructure scaling, high interest expenses, and aggressive capital allocation. Revenue growth of $12 to $13 billion represents continued hypergrowth in the upcoming year.
- MARA Holdings (MARA) revenue for the fourth quarter came in at $202.3 million, a decrease of 6% YoY, while the company posted a net loss of $1.7 billion, mainly due to a non-cash fair value adjustment of approximately $1.5 billion related to its digital assets, as well as increased depreciation and impairment charges. Revenue for the full year came in at $907.1 million, up 38%. However, the company posted a net loss of $1.3 billion. Operational metrics were positive, with energized hashrate of 66.4 EH/s, up 25%. In addition, the company mined 2,011 BTCs during the quarter, with total holdings of 53,822 BTCs. Earnings volatility is directly correlated with the volatility of the prices of digital assets.
- Opera (OPRA) revenue for the fourth quarter came in at $177.2 million, up 22%. Adjusted EBITDA came in at approximately $41.9-$42 million, or a 23-24% margin. Revenue growth is driven by innovation, advertising momentum, and cost discipline. The company provided FY2026 revenue guidance of $720-$735 million, representing revenue growth of 17-20%. In addition, the company provided adjusted EBITDA of $167-$172 million. The company announced a new share repurchase program of up to $300 million.
- TeraWulf (WULF) revenue came in at $35.84 million, slightly above the prior year but below consensus. The company posted a loss of $0.28 per share, compared with the consensus of approximately $0.13. Revenue for the full year came in at $168.5 million, with adjusted EBITDA of $(23.1) million. Cash and restricted cash stood at $3.722 billion as of the end of the year. The company’s strategic pivot towards high-performance computing and artificial intelligence hosting is the key. Profitability stabilization is still a work in progress.
Earnings Preview – 27-Feb-2026
- Swiss Re Ltd Investors would consider underwriting combined ratios, premium growth paths, and investment income sensitivity to yield changes. Capital position, reserving, and share repurchase comments would affect stability in valuations. Resilience in margins after catastrophe exposure would be a key consideration.
- Holcim Ltd Market focus will be on cement volumes, regional pricing power, sustainability of infrastructure backlog, and maintaining margins despite fluctuations in input costs. Trends related to normalization of construction demand will be relevant for forward revenue models.
- BASF SE Market focus for investors should be on chemical pricing, demand stabilization for industrial chemicals, and restructuring of costs. Segment-wise margin trends and clarity on guidance will be essential for understanding cyclical trends.
- Amadeus IT Group SA Class A Market focus for investors should be on global air booking volumes, distribution trends, expansion of recurring software revenue, and margin trends. Forward guidance on global mobility and adoption of travel technology should be relevant.
Zaye Capital Markets’ interpretation of this earnings window is a contrast between AI-driven infrastructure acceleration and traditional cyclical sectoral growth, with capital discipline and durability of cash flow being key valuation drivers.
Stock Market Overview – Friday, 27 Feb 2026
U.S. stock markets are trading lower today, with investors remaining cautious about the valuation of mega caps, their reaction to earnings, and the limited breadth of the market. We, at Zaye Capital Markets, will be looking for increased breadth and stabilization of rate expectations before calling for a further upside move.
Stock Prices
Economic Indicators and Geopolitical Developments
Today’s market is a tug-of-war between slowing inflation pressures and the valuation compression risks. The labor markets have been stable, but the “sticky” inflation pockets have been keeping investors cautious. Rate sensitivity is the primary mechanism that is moving the markets. If rates rise, growth stocks with high valuations will be the first to fall. If rates fall, the markets will attempt to rebound, but the leadership will remain suspect. The geopolitical news headlines will continue to keep the markets defensive, with positioning that is short-term focused.
Latest Stock News
- $META announced that it had locked a multibillion-dollar deal with $GOOGL to supply TPUs for AI training, with the option of buying the chips directly from the vendor the following year. This is clearly a message that compute scarcity is real, as the large players will be diversifying their supply chain risk. Meta is essentially diversifying its supply risk with both $GOOGL, $AMD, and $NVDA.
- $GOOGL | Alphabet is making its rivals pay for its services. The TPU deal is a sign that the compute crunch is making its rivals cooperate, as security of capacity is now more important than competing for market share. This is a structural change, as supply chain constraints are rewriting the rules of competition.
- $ZS | Zscaler reported a great Q2, with revenue $816M vs. $798M estimated, EPS $1.01 vs. $0.89 estimated, operating income $181M, ARR $3.35B. Guidance also beat estimates, Q3 rev $835M, FY26 rev $3.32B, EPS $4.01, ARR $3.74B. Our interpretation is a clean execution story for a cybersecurity company as cloud and AI adoption increase security spends.
- $NVDA | Nvidia reported massive numbers, yet its stock is down by ~5%. The company’s guidance indicates a potential increase of 68% in revenue, 63% EPS, and 65% margins for the company for the next year. The only concern is a sequential decrease in RPO for the first time in three years. Our interpretation is that this is likely a conversion story rather than a demand story, yet investors are clearly punishing anything less than perfect for a company that is a leader in AI.
- $PARA | Paramount is emerging as a potential beneficiary of $NFLX pulling out of the $WBD bidding process, as a $2.8B breakup fee is now being discussed. Our interpretation is that media deal-making is about to heat up again, driven by valuation disparities and asset scarcity.
- Broader Theme | The AI infrastructure landscape is now expanding beyond semiconductors to power, cooling, and energy storage, which are now becoming limiting factors for compute demand. We are tracking energy storage ($EOSE), miners shifting to HPC ($NBIS, $IREN, $CIFR), cloud execution ($DOCN), and space connectivity ($RKLB, $ASTS).
- Watchlist Rotation | $AMZN, $MELI, $AMD, $SOFI, and $HOOD continue to be active on rotation screens due to multi-vendor compute trades and efficiency wave stories.
The Magnificent Seven and the S&P 500

The “Magnificent Seven” – Apple, Microsoft, Nvidia, Amazon, Meta, Alphabet, and Tesla – remain the key level to watch for market direction. They’re being sold as the market no longer rewards “great” stocks, only “perfect” stocks. Dense valuations and extreme positioning make any change in market narrative cause large moves. This explains why the S&P 500 can appear to be holding up well, yet the internals can be struggling as a result of concentration risk. A small number of stocks can dominate the market moves due to their large market capitalization.
Significant Index Levels as of Friday, 27 Feb 2026
- Nasdaq Composite: ~23,255, -1.4% on the day as the technology sector unwinds from its recent earnings-related moves.
- S&P 500: ~6,918, -0.8% change as a result of concentrated selling pressures affecting large-cap stocks.
- Russell 2000: ~2,641, slightly up as a gauge of small-cap value stocks showing relative resiliency.
- Dow Jones Industrial Average: ~49,241, slightly down but holding relatively better compared to other major market gauges.
As Zaye Capital Markets, we believe that the market remains a selective one, with concentrated weakness in mega-cap stocks, valuation pressures, and rate sensitivity influencing market leadership.
Gold Price: What are Inflation Data and US Policy Comments Indicating to Gold Price above $5,000?
Gold is currently trading at around $5,000 an ounce, trading close to its recent multi-month highs. The price of bullion is subject to daily fluctuations; however, recent trading data suggests that there is a strong appetite for gold as the market responds to inflation. The bullish case for gold as an inflation hedge continues to hold as upside pressure in US inflation rates over time is expected to increase bullion demand as investors seek to buy gold as a hedge against currency weakness. The market is currently adopting a cautious stance ahead of important inflation reports, including the US Core Producer Price Index (PPI) and US headline PPI. If these inflation readings come in lower than expected, it would reinforce the bullish case for gold as disinflation would increase its relative value. However, if these inflation readings come in above expectations, it would boost the US dollar and increase real yields, which would negatively impact the price of bullion in the short term.
The current U.S. policy and economic landscape also provides a favorable backdrop for bullion positioning. Although political commentary emanating from the White House and discussions regarding tariffs create uncertainty within financial markets, the safe-haven characteristics of gold are being reaffirmed, particularly as investors attempt to protect against ambiguity within current U.S. policy and potential future volatility within growth assets. As such, should inflation print data come in below expectations, particularly PPI and core inflation, this would likely support current expectations for a potential easing cycle, providing a positive backdrop for gold’s forward outlook. Furthermore, economic data released yesterday revealed a mixed bag for labor market data and consumer sentiment, providing a more cautious backdrop for financial markets, driving bullion prices higher as investors rotated away from risk assets. The price stability of gold, trading near key psychological thresholds around $5,000, is a result of its ability to act as a hedge against inflation and a safe haven during periods of macroeconomic uncertainty.
Oil Prices: How are OPEC Policy, US Data, and Politics Affecting Oil Prices?
The prices of Brent crude are currently fluctuating between $70 to $71 a barrel, whereas WTI crude prices are stuck between the mid-$60s a barrel. This indicates that crude oil prices are oscillating between supply and demand factors. Currently, OPEC+ policies are encouraging crude prices to remain stable due to its efforts to manage crude production to avoid oversupply in the market. However, recent comments from energy agencies suggest that crude demand growth may slow down in the year 2026 compared to previous years. At the same time, geopolitics are also affecting crude prices due to the ongoing tensions between nations in the Middle East region. This has kept the prices of crude oil high due to the risk premium built in the market. Recently, there have been some comments from the US government on its policies to enforce trade tariffs on other nations. Whenever there are high trade tensions between nations, commodities such as crude oil are generally under pressure in the short term due to the potential slowdown in growth factors.
Yesterday’s economic indicators also affected oil prices’ cautious behavior. The stability of labor market indicators, accompanied by inconsistent consumer spending and inflation indicators, creates a degree of confusion regarding oil consumption and transportation demand patterns. Should economic growth slow down, oil prices might decline due to a decrease in refinery demand and transportation demand. Nevertheless, today’s major inflation indicators—German Preliminary CPI and US Core PPI/PPI—may significantly influence oil prices’ direction. Should inflation indicators exceed market expectations, oil prices might benefit from pass-through effects based on rising energy costs. Conversely, a decline in inflation indicators might renew fears about weakening economic growth, which might negatively influence oil prices. The market is currently weighing various factors before making a directional breakout from supply-side discipline by OPEC+ and demand-side projections from various global economic agencies. At Zaye Capital Markets, we perceive oil prices’ range as technically well-supported but fundamentally vulnerable to inflation surprises and geopolitical shifts.
Bitcoin Prices: What Impact Are U.S. Policy Signals and Inflation Figures Having on Bitcoin’s Price at $68K?
Bitcoin is trading in the $67,000 to $68,000 price range after falling to levels below $67,000 earlier in the week and attempting to regain the $70,000 price point. The price of Bitcoin has been very sensitive to market conditions, and volatility has increased considerably due to derivatives markets and short squeezes in the $71,000 price range. Technical indicators have been close to oversold territory in the last few days, leading to buying opportunities and price increases; however, Bitcoin is unable to sustain support above the $68,000 price point. The strength of the U.S. dollar has been a significant headwind for Bitcoin and other crypto assets, and this has reinforced the negative correlation between dollar liquidity and risk appetite. This has been the most significant factor affecting Bitcoin and other crypto assets, and institutional flows have been the main driver of price action, where large positions and corporate Bitcoin balances act as a significant driver of price momentum for Bitcoin and other crypto assets. The narrative surrounding Bitcoin is mixed, where analysts say that the price increase is a structural continuation of the bull cycle; however, Bitcoin has not emerged from the corrective cycle, and altcoins have only experienced relief rallies.
Recent White House and policy-related commentaries have had an impact on overall risk sentiment, thereby indirectly affecting the Bitcoin ecosystem. Although the administration’s statements have not specifically impacted digital assets, the ongoing focus on tariffs, enforcement, and regulation is likely continuing to contribute to overall macro uncertainty, which is an important driver of Bitcoin’s price action in the past. Specifically, overall macro uncertainty tends to generate two opposing dynamics in the Bitcoin market, where risk-off dynamics tend to weigh on speculative assets in the near term, while hedging dynamics tend to support the asset class in the long term as investors seek alternatives to traditional financial instruments. The mixed economic data reported yesterday, while maintaining stable labor dynamics, presented mixed inflation dynamics, thereby continuing the risk-off tone in the overall market, which is preventing a definitive move in either direction. Today, the key inflation reports, including the German preliminary CPI report, as well as the US Core PPI and headline PPI reports, have the potential to move the Bitcoin market significantly, where lower inflation may weaken the dollar, thereby encouraging risk-on dynamics in the digital asset class, prompting Bitcoin to move through the higher resistance levels, while higher inflation may continue the overall risk-off tone, thereby strengthening the dollar, leading to lower Bitcoin prices.
ETH Prices: How are ETF inflows and Whale Accumulation Helping to Support Ethereum Price at above $2,000?
Ethereum is currently trading at levels around the coveted price level of $2,000. The cryptocurrency managed to rise above this important support level after a prolonged consolidation phase. The renewed interest in Ethereum from institutional investors was a crucial factor behind this price action. Recent days have witnessed a rise in net spot ETH ETF inflows to around $157 million. The leading spot ETFs in Ethereum, such as Fidelity’s FETH and Grayscale’s ETHE, are seeing significant growth in assets. The renewed inflows come at a time when there was a prolonged phase of Ethereum ETF outflows. The past week witnessed positive institutional inflows in Ethereum for the first time in recent weeks. Recent days have witnessed Ethereum whales accumulating more ETH. The rise in exchange outflows while seeing a reduction in ETH trading venue supply is a positive sign. The recent accumulation in Ethereum, coupled with the reduction in weak hands, has been able to support the ETH price at above $2,000. The consolidation in recent days at around $2,080 to $2,150 is a result of a tug of war between inflows and distribution from large holders.
Ethereum’s near-term price action continues to be impacted by macro sentiment and technical flow dynamics. The mixed economic results from around the world, including inflation and labor market reports, have impacted risk asset demand, which indirectly affects investor sentiment in riskier assets like Ethereum. The weak economic results result in lower expectations for cryptocurrency adoption, while higher inflation results in tighter conditions and increases risk aversion. ETF inflows are a positive sign for Ethereum’s price action as they show a return to conviction in Ethereum’s price action, which was not there in previous periods. The recent whale activity in Ethereum’s market, including accumulation and distribution, shows that there is a conflicting market sentiment as far as Ethereum’s price action is concerned. The recent activity in Ethereum’s market, where some whales are accumulating Ethereum while others are distributing it, will be crucial in determining whether Ethereum’s price can continue to rise above $2,150 and test other resistance levels or whether it consolidates in its recent range above support.
