Where Are Markets Today?
Global equity futures are pointing sharply lower at the start of the week, with both U.S. and European markets expected to open under significant pressure as investors react to the surge in oil prices and intensifying geopolitical tensions in the Middle East. Futures tied to the Dow Jones Industrial Average are down more than 1,000 points, or roughly 2.3%, while S&P 500 futures are falling around 2.0% and Nasdaq 100 futures are dropping more than 2.3% ahead of the opening bell. European markets are showing a similar pattern of weakness, with Euro Stoxx 50 futures and German DAX futures declining around 3%, while FTSE futures are down roughly 1.5%–2%. The primary catalyst behind the global sell-off is the dramatic rise in energy prices, with West Texas Intermediate crude approaching $118–$120 per barrel and Brent crude trading above $115, levels that raise immediate concerns about inflation and economic growth across major economies.
One of the central drivers of the decline in both European and U.S. futures is the sudden energy supply shock linked to disruptions in the Strait of Hormuz, a critical shipping route through which a large share of the world’s oil flows. Production cuts by several Middle Eastern producers and reduced tanker activity in the region have tightened global supply expectations, pushing crude prices sharply higher. Energy prices above the $100 threshold are widely viewed by economists and investors as a critical pressure point for global growth because higher fuel costs ripple through transportation, manufacturing, and consumer spending. As oil prices rise quickly, markets tend to reprice inflation expectations and reassess central bank policy paths, which often leads to increased volatility in equities and a shift toward defensive positioning.
Another key factor shaping the negative market sentiment is the heightened geopolitical uncertainty surrounding the ongoing conflict with Iran. Political statements suggesting that the conflict could continue for several weeks, combined with reports of leadership changes and ongoing military activity, have intensified investor concerns about a prolonged regional crisis. Financial markets generally respond to such uncertainty by reducing exposure to risk assets, particularly sectors that are sensitive to energy costs or global trade. The impact of this geopolitical backdrop has been amplified by the fragile market tone already present after last week’s losses, when the Dow Jones Industrial Average dropped roughly 3%, the S&P 500 declined about 2%, and the Nasdaq Composite slipped around 1.2%, leaving investors cautious at the start of the new trading week.
Looking ahead, the combination of energy market volatility, geopolitical risk, and macroeconomic uncertainty is likely to keep global equity markets on edge. With no major economic releases scheduled for the start of the week, traders are focusing heavily on developments in energy markets and diplomatic signals that could either escalate or calm the situation. Investors will also monitor upcoming economic data later in the week, including inflation and employment indicators, which could influence expectations about monetary policy and economic resilience. Until oil prices stabilize or geopolitical tensions ease, both European and U.S. markets may continue experiencing heightened volatility as investors adjust portfolios to manage risk in an increasingly uncertain global environment.
Major Index Performance as of Monday, 9 March 2026
- Nasdaq: Trading around 23,030, reflecting continued volatility in large technology stocks.
- S&P 500: Trading around 6,930 as mega-cap tech weakness offsets strength in energy and defense-related sectors.
- Russell 2000: Trading near 2,690 as small-cap companies remain sensitive to economic growth expectations.
- Dow Jones: Trading around 50,110, showing relative resilience supported by industrial and defensive names.
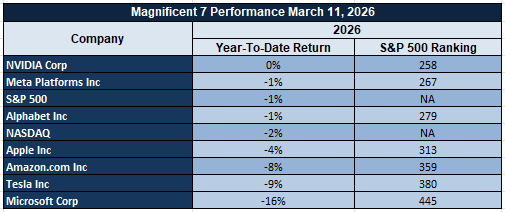
The Magnificent Seven and the S&P 500

The “Magnificent Seven” — Apple, Microsoft, Nvidia, Amazon, Meta, Alphabet, and Tesla — continue to dominate the direction of the broader market. Over the past two years these companies have accounted for a disproportionate share of gains in the S&P 500 and Nasdaq. However, the recent shift in investor sentiment toward heavy AI spending has begun to weigh on these stocks. Markets are not questioning the long-term importance of artificial intelligence, but rather the speed at which massive capital expenditures will convert into sustainable earnings growth. As these companies represent a large portion of the S&P 500’s market capitalization, any pullback within this group has an outsized impact on the broader index. From our perspective at Zaye Capital Markets, broader participation across other sectors will be necessary to support a more durable market rally.
Drivers Behind the Market Move – Monday, March 9, 2026
As U.S. and European markets begin the week under significant pressure, investors are navigating a challenging environment shaped by geopolitical developments, rising energy prices, and uncertainty surrounding the global economic outlook. Equity futures across major indices are pointing lower as traders reassess risk exposure following last week’s market decline and the latest surge in oil prices. With limited economic data scheduled for the start of the week, market sentiment is being driven primarily by geopolitical headlines, energy market volatility, and investor positioning ahead of key economic indicators expected later in the week.
- Middle East Conflict and Oil Price Surge
The escalation of geopolitical tensions in the Middle East continues to dominate market sentiment. Statements indicating that there will be no agreement with Iran except “unconditional surrender,” along with comments suggesting that military objectives could be achieved within four to six weeks, have increased fears of a prolonged conflict in the region. At the same time, the disruption of oil shipments through the Strait of Hormuz has significantly tightened global supply expectations, pushing West Texas Intermediate crude close to $120 per barrel while Brent crude has surged above $115. Higher energy prices raise immediate concerns about inflation and economic growth because fuel costs directly impact transportation, manufacturing, and consumer spending. As a result, investors are reducing exposure to risk assets while closely monitoring developments in the energy market.
2. Global Security Policies and Political Messaging
Policy developments and security-related messaging have also contributed to heightened market caution. The administration recently announced stronger measures targeting transnational cybercrime networks, directing federal agencies to increase enforcement against digital fraud and coordinate more closely with international partners. Additional statements emphasizing military cooperation with allied nations and warnings about hostile foreign influence across the Western Hemisphere have reinforced concerns about broader geopolitical instability. Financial markets typically react cautiously to such developments because rising geopolitical risks can disrupt trade flows, increase defense spending priorities, and shift investor demand toward safer assets such as government bonds and commodities.
3. Absence of Immediate Economic Data and Investor Positioning
Another factor shaping today’s market behavior is the absence of major economic data releases at the start of the week. With no significant macroeconomic indicators scheduled for today, investors are primarily digesting last week’s economic developments, particularly employment data that showed weaker job creation and raised concerns about the pace of economic growth. In periods where geopolitical shocks occur without new economic data to guide expectations, markets often experience increased volatility as traders rely heavily on headlines and macro narratives. As a result, investors are maintaining a cautious stance while waiting for several important economic releases later in the week, including inflation and employment indicators that could provide clearer direction for interest rate expectations and broader market sentiment.
In summary, the combination of escalating geopolitical tensions, rapidly rising oil prices, and the absence of new economic data is shaping today’s market environment. Investors across U.S. and European markets are responding cautiously as they monitor developments in energy markets and prepare for upcoming economic indicators that may determine the next phase of global market direction.
Digesting Economic Data
The TRUMP Tweets and Its Implications
The political messaging between March 6 and March 8 signals a sharp escalation in geopolitical posture that markets cannot ignore. The most immediate theme emerging from the statements is the hardline stance toward Iran, where the administration stated that there would be no agreement except unconditional surrender, alongside claims that allied forces are close to controlling Iranian airspace and that operational objectives could potentially be completed within four to six weeks. Additional remarks suggesting that discussions are already underway about potential future leadership in Iran further reinforce the perception that the situation is evolving beyond limited military engagement into a broader strategic restructuring scenario. For financial markets, this type of language tends to increase geopolitical risk premiums across commodities, defense sectors, and safe-haven assets. Investors typically respond to these developments by reassessing global supply chains, energy security risks, and capital flows into defensive industries.
Another notable policy direction during the same period involves the administration’s intensified focus on transnational cybercrime and financial fraud networks. The executive order directing federal agencies to strengthen cyber defense capabilities, prosecute fraud networks more aggressively, and coordinate with foreign governments reflects an effort to tighten oversight of digital financial activity. The plan also includes programs designed to return seized funds to fraud victims and expand cooperation between federal and local authorities. From a market perspective, such actions could have implications for the technology, cybersecurity, and digital finance sectors. Increased regulatory scrutiny and stronger enforcement frameworks often reshape compliance requirements across financial institutions, digital payment platforms, and cryptocurrency markets, while also potentially benefiting cybersecurity firms that provide defensive infrastructure.
Statements delivered on March 7 highlight a second geopolitical front involving organized crime and regional security dynamics across the Western Hemisphere. The administration emphasized that military force may be necessary to dismantle cartel networks, describing them as entities that control large territories and pose strategic threats. Proposals suggesting missile strikes against cartel leadership and the formation of regional alliances to combat criminal organizations indicate a willingness to expand security operations beyond traditional law-enforcement frameworks. Markets often interpret such rhetoric as a signal that cross-border security cooperation and defense spending could increase. Additionally, comments suggesting that major political changes could soon emerge in Cuba introduce another geopolitical variable that investors may watch closely, particularly in sectors tied to trade, tourism, and regional infrastructure development.
Finally, remarks on March 8 shifted attention toward domestic political priorities and international alliances. The administration stated that it may withhold support for other legislation until the Save America Act passes, while also signaling potential executive action if Congress does not move forward on voting legislation that includes proof-of-citizenship requirements. These developments highlight the intensifying political environment surrounding electoral policy and governance frameworks. At the same time, diplomatic interactions with international allies—including discussions on military cooperation with the United Kingdom and praise for Italian leadership—suggest efforts to reinforce strategic partnerships during a period of geopolitical tension. Taken together, these messages indicate a complex policy landscape where security, governance, and international alliances are increasingly intersecting, a combination that markets will continue monitoring closely as investors evaluate the broader implications for global stability and economic confidence.
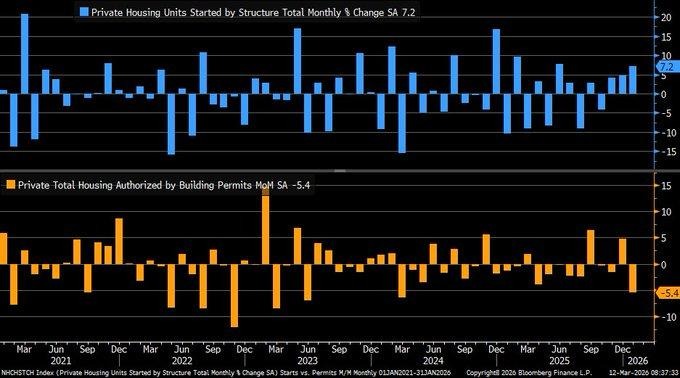
Consumer Credit Growth Slows Sharply, Signaling Cautious Household Borrowing

The recently released consumer credit report revealed that the January 2026 increase in household borrowing totaled $8.05 billion, a far cry from the $12.65 billion that the market had expected. Moreover, the figure also trailed the revised $25.2 billion increase seen in December. Based on our analysis at Zaye Capital Markets, the marked slowdown in consumer credit growth indicates a cautious approach to borrowing by households, especially at a time when interest rates remain high. Generally, the growth of consumer credit is an important barometer of consumer spending behavior. A sudden slowdown in consumer credit suggests a change in the behavior of consumers who continue to spend but with a growing reluctance to add to their debt burden.
Further analysis of the data suggests that the trend is indicative of a structural shift in the composition of consumer debt. Revolving debt, largely driven by the use of credit cards, grew by $4.7 billion. On the other hand, non-revolving debt such as auto loans and student loans grew by only $3.3 billion. This trend suggests that consumers may increasingly be turning to short-term debt to finance their daily needs rather than long-term debt to finance their consumption of durable products. Analysts should keep an eye out for the upcoming retail sales reports to see whether the trend continues or is simply a blip in the pattern of consumer behavior. The historical data provided in the table suggests that changes in the trend of consumer debt have often preceded changes in the broader trend of the economy.
The recent slowdown in consumer debt growth is accompanied by weaker labor market trends, including a slowdown in payroll growth and a rise in the unemployment rate. These trends often have a bearing on the pattern of consumer debt. Nevertheless, from the perspective of Zaye Capital Markets, Walmart Inc. (WMT) is undervalued given the company’s defensive position in the retail space. When consumers tighten their belts in response to changes in the pattern of credit availability, value retailers tend to gain more market share. Analysts should keep an eye out for Walmart’s sales growth to see whether the company continues to benefit from the trend in consumer behavior.
Retail Sales Hold Firmer Than Expected, Pointing to Underlying Consumer Stability
The recent retail sales report indicated that the spending done by consumers in the United States has decreased by a marginal 0.2% on a month-to-month basis in January 2026. While this figure may indicate a certain degree of decline in the spending done by consumers in the United States, it must be noted that the spending done by consumers has performed relatively better than the expected decline of 0.3%. From our perspective at Zaye Capital Markets, this figure indicates that the spending done by consumers in the United States is likely to be more stable than initially feared despite the high interest rates. The retail sales report is one of the most closely watched economic indicators that provide a sense of the underlying economic trends. This is because the spending done by consumers accounts for a significant percentage of the overall economic activity.
While a marginal decline in the spending done by consumers in the United States can be a cause for concern at high interest rates, the recent retail sales report provides a sense that the spending done by consumers in the United States will be more stable than initially feared. While a marginal decline in the spending done by consumers in the United States may be a cause for concern at high interest rates, a deeper analysis of the recent retail sales report provides a sense that the spending done by consumers in the United States will be more stable than initially feared. This is because the control group metric, which excludes automobiles as well as gasoline purchases that can be highly volatile, has risen by a marginal 0.3% after remaining unchanged the previous month. According to the historical retail sales report, a near-zero figure in the retail sales report has been a characteristic of the economic transitions that the United States has undergone over the years.
The broader historical trend represented by the data on retail sales growth points to the overall volatility within the market since 2021, with the most recent period reflecting a stabilization within the growth rate at flat levels. This type of stabilization period tends to indicate to consumers a period of adjustment within spending habits and the overall ability to adapt to shifts within financing costs and overall economic outlooks. Within the current period, we believe the overall position of Walmart Inc. (WMT) to be undervalued within the retail sector given the overall strategic position within the retail market for essential retail categories. Analysts should focus on the ability of the company to maintain comparable store sales growth, inventory efficiency, and the expansion of the retail presence through digital channels to determine the overall ability of the company to maintain market share within the retail sector as consumers become increasingly price-conscious within the overall market.
Prime Age Workforce Participation Rate Drops, Raising Questions About the Labor Market
Recent figures released on the state of the US labor market show that the prime age workforce participation rate, which measures the extent of participation among individuals aged 25 to 54 years old, has dropped to 83.9% as of February 2026. In addition to that, the overall participation rate has dipped to 62%, which is the lowest figure recorded since December 2021. In our view at Zaye Capital Markets, this is an important figure to note because we understand that the prime age workforce participation rate is considered to be one of the most dependable measures of the true health of the US job market. When the prime age workforce participation rate dips, as we have seen recently, we understand that fewer individuals within the most economically active segment of society are either working or actively seeking jobs. Although the current figure is high compared to the average participation rates recorded over the course of the last decade, we understand that the change in trend raises questions as to whether the momentum within the US job market may gradually be slowing.
In addition to that, we understand that the recent jobs report shows that the prime age workforce participation rate has been trending lower over the course of the past several months after recently topping out at around 84% as of the close of 2025. This change is important because we understand that the recent uptrend in participation had been instrumental in helping to sustain economic growth as more people began to seek jobs and actively contribute to the economy. When participation rates fall, we understand that sometimes this can hide weakness within the job market as fewer people actively seek jobs. In effect, unemployment rates may appear to remain stable as participation falls while demand for jobs may gradually be slowing within key sectors of the economy.
Such historical comparisons also serve to underscore the reasons why the current market phenomenon is drawing the attention of market participants. While the current participation rate remains higher than the approximate 82% averages recorded throughout the 2010s, the current decline serves to indicate that the labor supply dynamics are potentially tightening again. Within this context, we believe that the current market phenomenon warrants the attention of market participants, and at Zaye Capital Markets, we believe that the current market valuation of the shares of Microsoft Corporation (MSFT) undervalues the long-term competitive position of the firm given the current and potential future dynamics of the labor market and the potential for firms to turn to new and emerging technologies to help alleviate the labor supply dynamics. Analysts should focus on the overall dynamics of enterprise-level technology spending to gauge the potential for firms to turn to new and emerging technologies to alleviate the labor supply dynamics.
Nonfarm Payrolls Shock Markets With Job Losses, Signaling Labor Cooling
In the latest nonfarm payrolls report released for the month of February 2026, the market witnessed a huge surprise with the release of the data, which showed a net loss of 92,000 jobs instead of the anticipated addition of about 55,000 jobs. This is the first time the labor market has witnessed a decline in the nonfarm payrolls since the labor market recovery from the global economic shutdown period earlier in the current decade. According to the analysis provided by the team at Zaye Capital Markets, the latest nonfarm payrolls report seems to indicate the labor market, which had been very resilient during the earlier period, seems to have entered a moderation phase as businesses are becoming increasingly cautious about the labor market and are not hiring as many workers as they did earlier.
Further analysis of the data provided in the report revealed some very sharp reversals in the employment data for the various sectors, with the private education and health services sector having witnessed a sharp decline of 34,000 jobs instead of the addition of 129,000 jobs recorded the previous month. At the same time, the leisure and hospitality sector also witnessed the loss of about 27,000 jobs, and the overall data seems to indicate the businesses are reacting to the changing expectations and are making the necessary adjustments to the workforce to match the overall economic scenario. It is very important to keep a close tab on the job openings data to determine the overall trend and assess the impact of the overall labor market on the overall economy.
Nevertheless, other aspects of the report point to a gradual decline in labor market inflation. The unemployment rate slightly rose to 4.4%, while average wages grew at a rate of 4.1% on a yearly basis. This suggests that the pace of economic activity is moderate rather than excessive. When the pace of economic activity moderates while the unemployment rate rises slightly, the pressure on central banks to sustain high interest rates diminishes. In this economic scenario, financial markets could begin to price in interest rate cuts as economic activity continues to slow. In this ever-changing economic landscape, we at Zaye Capital Markets believe that Amazon.com Inc. (AMZN) is currently undervalued given its competitive advantage in the digital commerce business. Analysts need to focus on e-commerce demand trends, cloud computing revenue growth rates, as well as improvements in logistics efficiency to determine if Amazon continues to gain from the structural trend of digital adoption despite the economic slowdown.
Household Survey Employment Decline Indicates Early Signs of Cooling in the Labor Market
According to the February 2026 employment survey conducted among households, the number of jobs lost was reported to be 185,000. This number is smaller compared to the substantial loss of jobs reported in January, which was 895,000 jobs lost. This survey is used to derive the unemployment rates and often offers an alternative view of the economy compared to the payroll report. In our view at Zaye Capital Markets, the recent report shows that while the rate of job loss has slowed compared to the previous month, the economy’s underlying conditions remain unpredictable. In addition, the survey reported that the total number of jobs stabilized at around 162.9 million workers. This indicates that the high job creation rates that began after 2021 may be slowing down.
One of the notable characteristics of the survey is that it tracks changes that may not always be reported in the payroll survey. This is because the survey takes into account the number of self-employed workers and small businesses that may offer job opportunities to people within the gig economy. In cases when small businesses begin to make changes to their workforce or when the number of job opportunities within the gig economy decreases, the survey is likely to report changes before the payroll report does. Analysts should keep an eye on the fluctuations in the participation of workers within the economy and the intentions of small businesses to create jobs. In cases when the volatility of jobs persists among people within the economy’s smallest businesses, it may signal the beginning of an economic slowdown that gradually permeates through larger businesses within the economy.
The stabilization of the total employment level at approximately 162.9 million also points to the shift from rapid job creation to a more balanced environment. Although the survey is historically volatile, consistent decreases may begin to impact consumer confidence and income projections. A slower rate of employment may, over time, begin to temper consumer spending and business expansion strategies, which are critical components of the economic equation. As the environment shifts, we at Zaye Capital Markets believe that the Microsoft Corporation (MSFT) is undervalued based upon the structural nature of the business. Analysts should pay particular attention to enterprise technology spend, the adoption of cloud-based service delivery, and business investment in automation tools to gauge the extent to which the business sector is utilizing digital efficiency tools as the environment becomes less predictable.
Permanent Job Losses Increase, Pointing to a Further Softening in the Labor Market
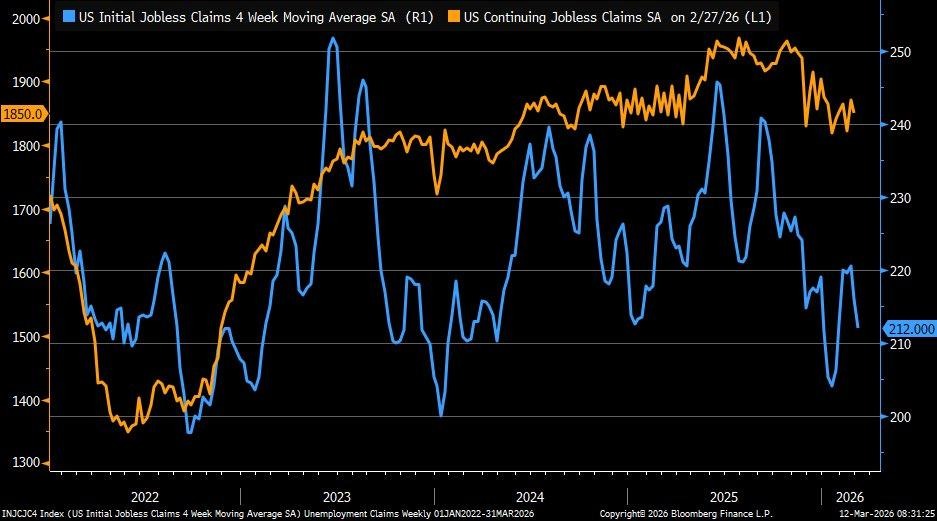
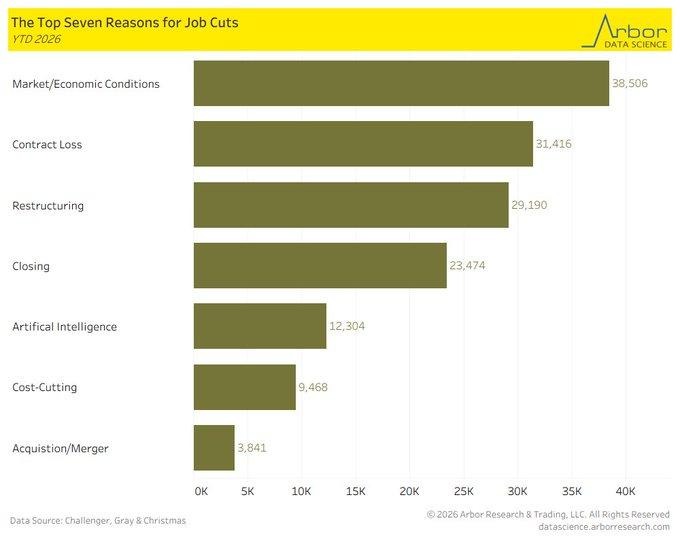
Recent labor market data reveals a marked increase in both permanent job losses and temporary layoffs, suggesting a potential softening in labor market conditions. According to recent data releases, permanent job losses have increased to a near 2 million figure, marking a non-recessionary high not seen since 2014. Meanwhile, temporary layoffs rose to a figure near 1.5 million, indicating a potential response by businesses to a slowdown in economic growth and increasing business costs. As a firm, Zaye Capital Markets views these two figures as key differentiators in labor market data releases. Temporary layoffs are a key indicator of potential business adjustments in response to shifting economic growth rates, while permanent job losses are a more ominous indicator of a business’s overall strategy and long-term outlook.
These trends occur alongside the general employment report, which indicated a net reduction of 92,000 jobs in February, the first monthly decline in payrolls in the past few years. Although the unemployment rate remains stable at 4.4%, the adjustment of the previous months’ data reduced the earlier jobs gains by approximately 45,000 jobs. This indicates that the general trend of the labor market may be weakening at a faster rate than anticipated. When permanent jobs start to rise along with the reduction of hiring trends, this may be an indication that companies are becoming more cautious about the future.
Analysts should pay particular attention to the upcoming jobs openings, wage rate, and business investment reports to ascertain the extent to which the weakening jobs market is a mere blip or the start of a general economic slowdown. Another important aspect of the rise of permanent jobs is the productivity strategies that companies implement. As companies anticipate slower economic growth, companies may turn to more technology-based productivity strategies, such as artificial intelligence, to replace the need for hiring more people. This is especially important for analysts, as it may affect capital allocation strategies for different industries. As analysts at Zaye Capital Markets, we believe that the stock price of Microsoft Corporation (MSFT) is undervalued due to the rise of artificial intelligence technology.
Wage Growth Accelerates to 3.8%, Bolstering Household Income Prospects
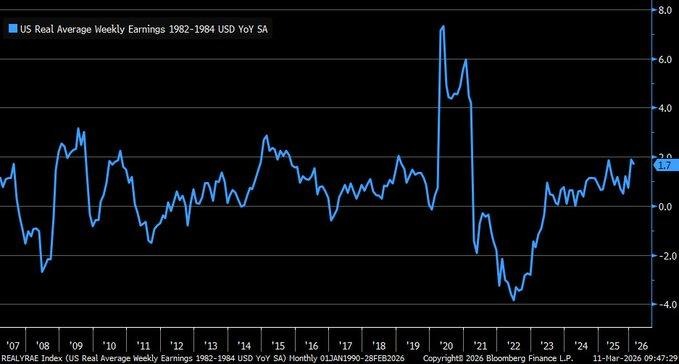
Recent labor market data revealed that the average hourly earnings of private non-farm payrolls accelerated by 3.8% on a yearly basis in February 2026, surpassing the 3.7% growth recorded in January 2026. This growth rate also surpassed the market consensus of 3.7%, reflecting the resilience of wage growth despite the moderation of employment growth rates. From our perspective at Zaye Capital Markets, wage growth is particularly important because it has a direct impact on the overall household income growth rate. When wage growth beats market consensus, it bodes well for consumer spending, which remains an important growth engine for the overall economy. This growth rate also represents the highest wage growth rate since mid-2023, reflecting the relative stability of labor income growth despite the moderation of other labor market growth rates.
However, a more extensive historical perspective can provide a better understanding of the wage trend over the past decade. The long-term wage growth chart provided above shows that wage growth has been changing significantly over the past decade or more, especially since 2009. The recent increase to 3.8% wage growth may indicate that income growth is gradually improving after a period of slower growth. It is also important to note that current wage growth is higher than the recent consumer inflation rate of 2.9%. When wage growth is higher than inflation, it can improve real consumer purchasing power and sustain consumer demand even when credit conditions remain tight. Analysts should keep an eye on future wage reports and productivity growth reports to see if businesses can sustain wage growth without reducing their hiring and investment activity.
The relationship between wages, inflation, and monetary policy is particularly relevant to the financial markets. Strong wage growth above inflation can provide a cushion to consumer demand and economic resiliency but can pose challenges to policymakers seeking to ensure that inflation risks remain contained. If wage growth increases more strongly, policy expectations may change as policymakers seek to gauge whether the labor market is consistent with long-run inflation outcomes. In this environment, we at Zaye Capital Markets view Walmart Inc. (WMT) as undervalued as the company has a strong presence in the value retail segment. When people’s incomes improve slightly but remain apprehensive about consumer spending, large retailers with competitive pricing and essential merchandise can experience improved customer traffic as people seek to make the most of their limited budgets. Analysts should keep an eye on how Walmart’s same-store sales performance and e-commerce expansion can improve as wage growth increases to see if wage growth can sustain demand within their retail ecosystem.
Military Spending Surge Points to Accelerated Demand in the Defense Industry
Recent estimates have indicated that approximately $779 million in spending occurred in the first 24 hours of a significant military operation targeting Iranian Revolutionary Guard facilities in early March 2026. A breakdown of the spending indicates that the deployment of cruise missile systems represents the highest level of expenditure. The use of Tomahawk missile systems is estimated to have accounted for approximately $340 million of the spending. From the perspective of Zaye Capital Markets, the surge in military spending is indicative of the acceleration of defense spending in response to geopolitical tensions. Although the spending represents only 0.1% of the current defense spending budget, the continuation of military engagement could significantly increase the level of spending as the conflict continues for an extended period.
From a broader perspective, the spending in the defense sector is indicative of the acceleration of the defense procurement cycles. Military operations of the scale witnessed in the early stages of the conflict often necessitate the procurement of additional supplies of advanced defense systems. Strategic missile systems used in the early stages of the conflict often need to be replaced as soon as possible. Analysts should therefore focus on the aerospace and defense procurement cycles as the conflict continues. The long-term effects of the conflict could result in the acceleration of the defense procurement cycles as governments in the region seek to strengthen their military capabilities in response to the increased level of regional tension.
Fiscal concerns are also beginning to emerge as another area of discussion among policymakers and analysts. Although the initial day’s operating expenses represent a small fraction of the overall defense budget, projected figures provided by research firms indicate that continued military operations may reach a daily expenditure of close to $900 million. These figures demonstrate how continued warfare can gradually impact fiscal policy decisions, government debt levels, and investment patterns within the defense industry. In this context, we at Zaye Capital Markets view Lockheed Martin Corporation (LMT) as an undervalued security given their dominant position within the advanced missile systems, aerospace technology, and infrastructure segments of the defense industry. Analysts should seek to understand whether continued military operations translate to long-term growth within the defense industry by examining contract awards and backlog levels among major defense contractors.
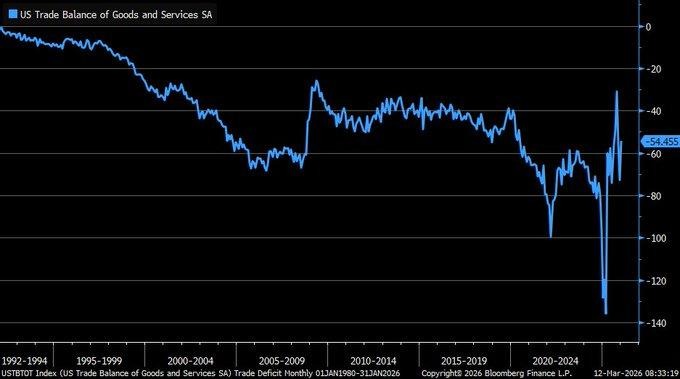
Import Prices Fall Despite Tariffs as Exporters Absorb Costs
According to the latest figures released on import prices, which show a fall of 0.1% over the past year as of February 2026, we can see that exporters around the world have been able to absorb the costs associated with the recently introduced 15% global import surcharge that was introduced on February 24, 2026. From our perspective as investment analysts at Zaye Capital Markets, this is an important trend to note because one of the assumptions that often follows the imposition of tariffs is that they directly impact the overall prices that citizens face within a given economy. However, as we can see from the latest figures released on import prices, we can infer that suppliers around the world may be making efforts to remain competitive within the domestic economy by absorbing the costs associated with the recently introduced tariffs. When suppliers around the world can absorb the costs associated with tariffs without passing them along to citizens within a given economy, we see that the overall inflationary impact that they may have on citizens and businesses within that economy is minimal, which allows demand within that economy to remain stable despite the imposition of new trade barriers.
Another relevant point to consider is the historical pattern of trade. Previous tariff situations have often led to changes in global sourcing patterns rather than directly affecting the prices paid by the end consumer. This is due to the fact that many companies have often resorted to negotiating changes in prices or sourcing from countries that have been less affected by the tariff policies. This could have a diluting effect on the prices paid by the end consumers. Analysts need to keep an eye out for the changes in the import prices index in the future to see whether the exporters continue to bear the burden of the prices or pass them on to the end consumers. Moreover, the possibility of retaliatory trade policies from major countries is another factor to keep in mind.
The overall impact of the stable prices of imports is relevant from an economic point of view. Industries that have relied heavily on global manufacturing would see the positive effects of the prices of imports. Companies would see better margin stability in the case of the prices of imports being stable. Within the current environment of stable prices of imports, we at Zaye Capital Markets believe that Apple Inc. (AAPL) is undervalued due to the global supply chain that the company has in place. The company has the ability to optimize the supply chain in relation to the manufacturing of products in different countries. Moreover, the company is able to keep the prices high in the case of the consumer technology products that the company offers. Analysts need to keep an eye out for the global supply chain in relation to the manufacturing of products in different countries.
Upcoming Economic Events
Markets Enter Quiet Data Window as Investors Await Next Week’s Signals
Moving through the trading session for today, the economic calendar presents markets with little to no major economic events or data releases that could significantly change the market sentiment or investors’ expectations. These periods often indicate a temporary slowdown or a stop in the ongoing market momentum, with investors and analysts choosing to take a step back from reacting to the economic events unfolding on a day-to-day basis to reassess the ongoing economic trends. From a perspective of an investment firm like ours at Zaye Capital Markets, quiet economic days often prove to be crucial for the markets as they allow investors to take a closer look at the economic events that were announced recently.
In the absence of any economic events or data releases, the markets usually focus on analyzing the implications of the economic events that were announced recently with respect to employment trends, consumer spending patterns, or inflation rates. These periods often encourage investors to analyze the economic events announced recently to assess their potential impact on the overall market performance. Trading activities during these periods may not be necessarily influenced by any economic events or data releases. Analysts should also be keeping a watchful eye on the movements of bond yields, the pattern of trading activities for various sectors of the equity markets, or the movements of commodity prices to gauge the markets’ sentiment for the upcoming economic events.
Although the current financial calendar is quiet, the markets are already looking ahead to this upcoming week, where there are a number of economic indicators that will give us a better idea of the state of the labor market, the strength of consumer demand, and the general trajectory of economic growth. As we see it at Zaye Capital Markets, the time during this quiet period should be spent preparing for the upcoming round of macroeconomic data, reviewing sector positioning, assessing the fundamental health of companies, and seeking out companies that may benefit from the changing economic environment. Those companies with healthy balance sheets, strong demand engines, and digital infrastructure may continue to offer attractive investment opportunities as the markets begin to respond to the next round of economic data.
Stock Market Performance
Indexes Rebound Strongly from 2025 Lows, though Market Breadth Remains Unbalanced

Equity markets have posted a robust rebound since the April 8, 2025, market trough, though underlying data indicates that this rebound has not been uniform across all equities. While overall index performance looks healthy, a more in-depth analysis indicates that this rebound has not been as pronounced in individual companies as it has been in the indices themselves. As a firm, Zaye Capital Markets views this difference in index performance and average constituent performance as a clear indicator that market leadership continues to be represented by a small percentage of larger companies, while overall breadth in the market remains behind.
Here’s a summary of overall performance in major indices strictly by the data:
S&P 500: Stable Year-to-Date, Strong Rebound from 2025 Lows
YTD: 0% | +37% since 4/8/25 low | -3% from YTD high | Avg. member: -13%
The S&P 500 index is holding flat on a year-to-date performance, though it’s been a tug-of-war between these advances and declines. While this index is flat on a year-to-date performance, it’s posted a robust rebound of 37% since the April 8, 2025, lows. Though this index has posted a 3% decline from its year-to-date high, the average member of this index has posted a decline of 13% from its high. While this index itself has posted a mere 5% drawdown from its recent high, the average member of this index has posted a 22% decline from its high.
NASDAQ: Strongest Recovery But Weak Underlying Breadth
YTD % change: -2% | +49% since 4/8/25 low | -6% from YTD high | Avg. member % change: -27%
While the NASDAQ has registered the strongest rally from the trough hit in April 2025, the index has still declined by 2% year to date. Moreover, the NASDAQ has declined by 6% from its high since the start of the year. Interestingly, the average NASDAQ constituent has declined by 27% from its YTD high. Since the trough hit in April 2025, the NASDAQ index has seen a maximum decline of 8%, while the average member has seen a decline of 47%.
Russell 2000: Positive YTD Performance With Volatile Participation
YTD % change: +4% | +47% since 4/8/25 low | -5% from YTD high | Avg. member % change: -20%
The small-cap index comprising the Russell 2000 stocks has seen the strongest performance year to date, with a gain of 4%. Moreover, the index has seen a 47% gain since the trough hit in April 2025. However, the index has declined by 5% from its high since the start of the year. Interestingly, the average member of the index has declined by 20% from its high since the start of the year. Since the trough hit in April 2025, the index has seen a maximum decline of 9%, while the average member has seen a decline of 34%.
Dow Jones: Defensive Stability With More Controlled Drawdowns
YTD: 0% | +27% from 4/8/25 low | -4% off YTD high | Average member: -12
This is because the Dow Jones Industrial Average represents a more defensive profile in the overall market. Currently, it is flat year-to-date and up 27% from the April 2025 trough. The drawdown from its YTD high is 4%, while the average stock in this index is down 12%. It is also worth noting that this index has seen a 6% drawdown from its recent trough in April 2025, while the average stock in this index is down 18%. This relatively small difference in drawdowns indicates a potential stabilization effect of this index’s focus on established, large-scale companies in a period of overall market volatility.
From our perspective here at Zaye Capital Markets, it’s worth noting that this performance of the overall index doesn’t necessarily tell us a full picture of the overall health of the equity markets. It’s worth noting that this difference in performance between this index and its average stock’s drawdowns indicates a relatively narrow leadership in this overall market.
The Strongest Sector In All These Indices
Energy Leads Sector Performance, While Defensive Leadership Shapes the Market
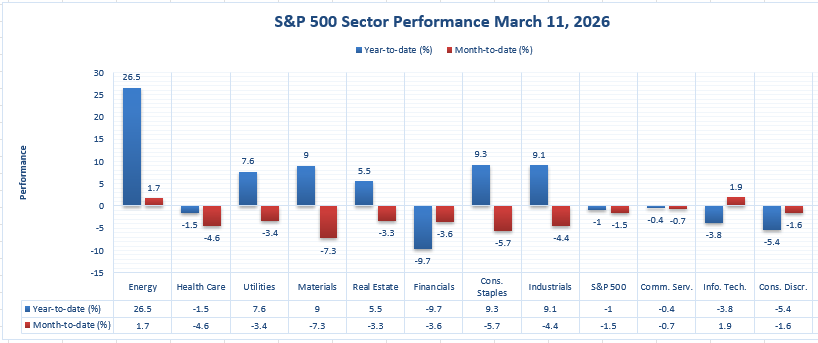
The latest data available on sector performance indicates that the Energy sector is the strongest-performing sector in the S&P 500 index on a year-to-date basis. This means that the Energy sector has outperformed every other sector in the market. From our perspective at Zaye Capital Markets, this data is important because it indicates the areas of the market where the performance is the strongest. The chart below indicates that while the S&P 500 index as a whole is down 0.2% on a year-to-date basis and down 0.7% on a month-to-date basis, there are a number of sectors that are up on a year-to-date basis. This indicates that the market performance is not evenly distributed.
At the top of this table, we see Energy stand out as a clear leader with a year-to-date return of 25.5% and a month-to-date return of 0.8%. No other sector even comes close to this kind of year-to-date performance. Following close behind are Materials with a year-to-date return of 11.3% and a month-to-date return of -5.4%, and Industrials with a year-to-date return of 10.8% and a month-to-date return of -2.9%. Consumer Staples have a year-to-date return of 10.0% and a month-to-date return of -5.2%, while Utilities have a year-to-date return of 9.4% and a month-to-date return of -1.8%. Real Estate also has a year-to-date return of 7.8% and a month-to-date return of -1.2%. As we can see, many of these sectors are still performing well this year, although not as well in their month-to-date performance. What this also shows us is that Energy is not only performing well this year, it is also performing well in their month-to-date performance.
In comparison to these stronger sectors, we also see some weaker sectors in this table. Financials are down 6.7% this year and down 0.4% in their month-to-date performance. Information Technology is down 4.2% this year, although they are up 1.5% in their month-to-date performance. Consumer Discretionary is down 3.3% this year and up 0.5% in their month-to-date performance. Health Care is down 0.8% this year and down 3.9% in their month-to-date performance, while Communication Services are down 0.8% this year and down 1.0% in their month-to-date performance. As we can also see, the S&P 500 index is down 0.2% this year, so it’s clear to us here at Zaye Capital Markets that Energy is performing best in this table of sectors.
Earnings
Corporate Results and Upcoming Reports Provide Signals Across Key Sectors
At Zaye Capital Markets, we monitor corporate earnings closely because they often reveal sector-level trends before they fully appear in macroeconomic indicators. Earnings releases provide investors with insight into operational efficiency, demand conditions, and future business outlooks across industries. The results released on March 6, 2026 reflect developments across aviation, energy infrastructure, aerospace manufacturing, and industrial engineering, while the companies scheduled to report on March 8, 2026 will provide further signals about enterprise technology spending, industrial equipment demand, software growth, and consumer retail activity.
Yesterday’s Earnings – March 6, 2026
- Deutsche Lufthansa AG – Revenue of €39.6 billion (up 5% from prior year; record high) was reported for full year 2025, confirming continued recovery in global aviation demand. Adjusted EBIT reached approximately €2.0 billion (around €1.96 billion) representing a 19–20% increase and producing an operating margin of 4.9%. Consolidated net income stood at €1.3 billion, remaining stable compared with the prior year despite tax valuation effects. Passenger airline operations generated €30.1 billion in revenue and €1.1 billion in adjusted operating profit. Management proposed a dividend of €0.33 per share. At Zaye Capital Markets, we believe investors should monitor passenger demand trends, ticket pricing dynamics, and fuel cost exposure to assess whether aviation margins remain stable through 2026.
- AltaGas Ltd. – Normalized EBITDA for full year 2025 reached $1,863 million, representing a 5% increase year-over-year and landing at the upper end of company guidance. Income before income taxes totaled $1,029 million. Full-year GAAP earnings per share reached $2.48, while normalized EPS came in at $2.23. Fourth-quarter revenue was $3.29 billion with net income of $205 million (GAAP EPS $0.67) and normalized EPS of $0.77. The company reaffirmed its 2026 normalized EBITDA guidance range of $1.925 billion to $2.025 billion. Investors should watch regulated utility cash flow stability, natural gas export demand, and capital investment plans as key drivers for future earnings momentum.
- Embraer SA Sponsored ADR – Revenue for full year 2025 reached $7.578 billion, representing an 18% year-over-year increase and marking the company’s highest annual revenue level on record. Adjusted EBIT totaled $656.8 million with an operating margin of 8.7%, exceeding earlier guidance. The company delivered 244 aircraft during the year, also reflecting an 18% increase. Firm backlog expanded to a record $31.6 billion, highlighting strong order visibility. Embraer also guided for 2026 revenue between $8.2 billion and $8.5 billion. From our perspective at Zaye Capital Markets, investors should focus on aircraft delivery schedules, commercial aircraft orders, and defense aviation contracts as the main drivers of future performance.
- IMI plc – Revenue reached £2.304 billion for full year 2025, rising from £2.210 billion in the previous year and representing roughly 5% organic growth. Adjusted operating profit totaled £460 million, reflecting approximately 8% organic growth, while adjusted earnings per share rose to roughly 132.3 pence. Net income reached £309.9 million. The company also achieved a record adjusted operating margin of 20.0% and reported 96% cash conversion. Management announced a £500 million share buyback program as part of its capital return strategy. Investors should monitor industrial order pipelines, automation demand, and manufacturing activity levels to evaluate the sustainability of IMI’s growth trajectory.
Today’s Earnings – March 9, 2026
- Hewlett Packard Enterprise Co. – Investors will focus primarily on enterprise cloud demand, artificial intelligence infrastructure spending, and server hardware sales linked to expanding data center capacity. These metrics provide insight into broader enterprise technology investment trends and the pace of digital infrastructure expansion.
- GEA Group Aktiengesellschaft – Earnings will provide a view into industrial equipment demand, particularly across food processing technology, automation systems, and energy efficiency solutions. Investors will monitor order intake trends and capital spending from manufacturing clients.
- Constellation Software Inc. – Market attention will remain on acquisition-driven revenue growth and the performance of recurring software revenue across its vertical market software businesses. Investors typically analyze integration performance of newly acquired companies and organic revenue expansion.
- Casey’s General Stores, Inc. – Earnings will offer an important snapshot of consumer spending through convenience retail sales, fuel margins, and same-store sales growth. Investors often use Casey’s results as a real-time indicator of regional consumer demand conditions and fuel retail profitability trends.
Stock Market Overview – Monday, 9 March 2026
U.S. equity markets began the week with a cautious tone as investors digest a combination of softer labor market data, rising geopolitical tension in the Middle East, and renewed scrutiny around large technology valuations. While energy markets are reacting to supply risks and defense spending headlines, equity investors are becoming more selective as they reassess earnings expectations and capital spending across major technology firms. At Zaye Capital Markets, we see a market currently balancing two competing forces: the possibility of slower economic growth and the massive spending cycle underway in artificial intelligence infrastructure. Until clarity emerges on both fronts, volatility in mega-cap stocks is likely to remain a defining feature of the market.
Stock Prices
Economic Indicators and Geopolitical Developments
Recent economic data showing weaker employment growth alongside steady wage expansion has complicated the macro outlook. Investors are now debating whether the labor market slowdown could eventually lead to easier monetary policy, while at the same time rising oil prices and geopolitical developments threaten to reintroduce inflation pressures. Geopolitical developments surrounding military operations in the Middle East have also increased focus on defense spending and global energy security. These crosscurrents are keeping market sentiment cautious, particularly toward companies with stretched valuations or heavy capital spending commitments.
Latest Stock News
- $NVDA | Nvidia approved a new executive compensation plan that includes a $4 million target cash bonus tied directly to revenue performance goals, reinforcing management confidence in continued AI demand growth. Nvidia also halted production of H200 chips intended for China and shifted production focus toward its next-generation Rubin AI platform, signaling a strategic pivot toward higher-value AI infrastructure systems.
- OpenAI | OpenAI launched ChatGPT integrations for financial and spreadsheet workflows, pushing its AI platform deeper into enterprise productivity and analyst environments. However, OpenAI’s robotics hardware leader resigned following concerns related to the company’s partnership with the U.S. Department of Defense, creating uncertainty around future hardware strategy. Another reports also indicate OpenAI and Oracle abandoned plans to expand a major Texas AI data center site, raising questions about the pace of AI infrastructure expansion.
- Anthropic | Anthropic announced a cybersecurity partnership with Mozilla to enhance AI-powered protection tools inside the Firefox browser ecosystem. Likewise the Pentagon simultaneously classified Anthropic as a supply-chain risk, restricting potential defense adoption of its technology.
- $HIMS | Hims & Hers shares surged roughly 39% after Novo Nordisk agreed to distribute obesity drugs through its platform, ending a dispute and opening a major new healthcare revenue stream.
- $AMZN | Amazon is facing investor scrutiny as markets debate whether massive AI spending across large technology firms will translate into sufficient revenue growth.
- $MSFT | Microsoft remains under pressure as investors evaluate the return on billions being invested into artificial intelligence infrastructure and data centers.
- $GOOGL | Alphabet is also being reevaluated by investors as capital expenditures accelerate in its AI infrastructure and cloud expansion.
- $META | Meta’s continued aggressive AI spending is also contributing to broader valuation concerns surrounding mega-cap technology companies. $META also agreed to temporarily allow competing AI chatbots on WhatsApp within Europe as regulators increase pressure on digital platform competition.
- $AVGO | Broadcom shares rose after management projected more than $100 billion in AI chip sales in coming years while securing long-term memory supply agreements through 2028.
- $MRVL | Marvell Technology surged after issuing a bullish multi-year outlook for custom AI chips used by hyperscale cloud companies.
The Magnificent Seven and the S&P 500
The “Magnificent Seven” — Apple, Microsoft, Nvidia, Amazon, Meta, Alphabet, and Tesla — continue to dominate the direction of the broader market. Over the past two years these companies have accounted for a disproportionate share of gains in the S&P 500 and Nasdaq. However, the recent shift in investor sentiment toward heavy AI spending has begun to weigh on these stocks. Markets are not questioning the long-term importance of artificial intelligence, but rather the speed at which massive capital expenditures will convert into sustainable earnings growth. As these companies represent a large portion of the S&P 500’s market capitalization, any pullback within this group has an outsized impact on the broader index. From our perspective at Zaye Capital Markets, broader participation across other sectors will be necessary to support a more durable market rally.
Major Index Performance as of Monday, 9 March 2026
- Nasdaq: Trading around 23,030, reflecting continued volatility in large technology stocks.
- S&P 500: Trading around 6,930 as mega-cap tech weakness offsets strength in energy and defense-related sectors.
- Russell 2000: Trading near 2,690 as small-cap companies remain sensitive to economic growth expectations.
- Dow Jones: Trading around 50,110, showing relative resilience supported by industrial and defensive names.
At Zaye Capital Markets, we maintain a selective approach in the current environment. Mega-cap technology volatility, rising geopolitical tensions, and mixed economic signals are reshaping equity leadership. Investors should focus on companies with strong balance sheets, durable earnings visibility, and clear structural growth drivers while monitoring market breadth closely for confirmation of a more sustainable rally.
Gold Price: How Do Geopolitics and Weak Economic Data Drive Gold Price Trends?
Spot gold is currently trading around US $5,082 per ounce, fluctuating within a narrow band near the $5,040–$5,080 range, as global investors weigh rising geopolitical tensions against a stronger U.S. dollar and elevated Treasury yields. At Zaye Capital Markets, the latest political developments between March 6 and March 8 have added a significant layer of uncertainty to the global financial landscape. Statements from the White House outlining aggressive military objectives in Iran, warnings of potential further strikes, and broader rhetoric surrounding military action against cartel networks across Latin America have intensified geopolitical risk perception across global markets. Historically, such escalation tends to support safe-haven flows into gold because investors seek protection during periods of conflict, political uncertainty, and potential energy supply disruption. However, the ecosystem around gold is currently more complex. While geopolitical risks normally lift bullion prices, the simultaneous surge in oil prices and the strengthening of the U.S. dollar are counteracting some of that upward momentum. Rising oil prices increase inflation expectations and push Treasury yields higher, which in turn raises the opportunity cost of holding non-yielding assets such as gold. As a result, bullion is receiving geopolitical support while facing macroeconomic resistance, creating a volatile consolidation phase around current price levels.
The broader macroeconomic environment is also influencing gold’s trajectory. Recent labor market data showing weaker job creation and a modest rise in unemployment has raised concerns about slowing economic momentum. Under normal conditions, weaker employment figures can strengthen gold because they increase expectations that policymakers may eventually ease monetary conditions to support growth. However, the economic backdrop is complicated by persistent wage growth and the inflationary impact of rising energy prices, which reduces the probability of immediate monetary easing. At the same time, the absence of significant economic releases on today’s calendar means markets are currently digesting last week’s employment data rather than reacting to new information. In this environment, gold is functioning as a balancing instrument between two competing forces: geopolitical risk and monetary policy expectations. When geopolitical tensions escalate while economic indicators weaken, gold often benefits from capital preservation flows and portfolio hedging strategies. Yet if the dollar continues to strengthen alongside rising yields, those forces may temporarily limit the pace of further price increases. This dynamic explains why bullion is holding near historic levels rather than accelerating sharply higher, as investors simultaneously hedge geopolitical risk while waiting for clearer signals from economic data and monetary policy direction.
Oil Prices: Why Are Oil Prices Rising on Geopolitical Tensions and Supply Risk?
Crude oil prices remain highly volatile as geopolitical risk and supply concerns dominate energy markets. As of Monday, 9 March 2026, Brent crude is trading close to $119 per barrel while U.S. West Texas Intermediate is hovering near $120 per barrel, levels that reflect one of the strongest rallies in recent years. The primary catalyst behind this surge is the escalating conflict involving Iran and the broader Middle East region, which has injected a significant geopolitical risk premium into energy markets. Statements made between March 6 and March 8 emphasizing military escalation, potential long-term operations, and broader regional security campaigns have heightened fears about disruption to global oil flows. The Strait of Hormuz, a strategic shipping corridor responsible for roughly one-fifth of global oil transport, has become the focal point for traders assessing supply risks. Any threat to shipments through this route can rapidly tighten global energy markets, and that concern is currently being reflected in higher crude prices. Market commentary from energy analysts and macro traders has also pointed to logistical disruptions and reduced output across parts of the region, adding further upward pressure on prices. At the same time, reports from global energy agencies suggest that inventories remain relatively tight compared with historical averages, meaning the market has limited ability to absorb supply shocks quickly if tensions intensify further.
Beyond geopolitics, macroeconomic signals are also influencing the oil market narrative. Yesterday’s labor market data showing weaker job creation has raised concerns about economic momentum, which under normal conditions could reduce demand expectations for energy consumption. However, the impact of geopolitical developments has largely outweighed those demand concerns for now. Higher oil prices are already beginning to feed into broader inflation expectations, increasing the cost of transportation, logistics, and manufacturing inputs across the global economy. This dynamic complicates the outlook for policymakers who are monitoring inflation pressures alongside slowing economic activity. Today’s economic calendar contains no major data releases, meaning energy markets are primarily reacting to geopolitical developments, supply disruptions, and commentary from global energy institutions rather than new macroeconomic indicators. OPEC continues to monitor production stability among member countries, while the International Energy Agency has warned that prolonged regional instability could significantly tighten global supply balances. In this environment, oil prices are being driven by the intersection of geopolitical risk, constrained supply conditions, and macroeconomic uncertainty, creating a highly sensitive ecosystem where any escalation in conflict or disruption to shipping routes could quickly push prices even higher while periods of de-escalation may trigger sharp corrections.
Bitcoin Prices: Why Is Bitcoin Volatile Amid Geopolitics and Economic Uncertainty?
Bitcoin is currently trading around $67,375, according to the latest chart data, after recovering from recent volatility that pushed prices briefly below the $70,000 threshold. The weekly chart shows Bitcoin opening near $65,970, reaching a high close to $67,668, dipping toward $65,821, and stabilizing around $67,375, reflecting a modest 2.13% weekly gain. This price behavior highlights how the digital asset continues to respond to global macroeconomic conditions and geopolitical developments. The political rhetoric between March 6 and March 8 surrounding military escalation in the Middle East triggered an initial wave of risk-off sentiment across financial markets, temporarily driving Bitcoin toward lower levels earlier in the week. Historically, geopolitical shocks often cause short-term volatility in crypto markets because investors initially move toward liquidity and defensive positioning. However, the rebound toward the $67,000 area indicates that underlying demand remains active as institutional investors continue allocating capital into digital assets. ETF inflows and broader crypto ecosystem stability have helped absorb selling pressure, allowing Bitcoin to maintain support above key technical levels despite global market turbulence.
From a technical perspective, the chart also shows Bitcoin trading above its 200-week moving average near $58,846, a long-term indicator closely watched by institutional investors when evaluating the structural health of the crypto market. Remaining above this long-term support suggests that the broader bullish cycle remains intact even though the market is experiencing short-term consolidation. Momentum indicators also reflect cooling conditions after the earlier rally, with the Relative Strength Index currently near 34, approaching oversold territory. This suggests that selling pressure may be stabilizing while buyers gradually re-enter the market. At the same time, macroeconomic signals continue to shape investor behavior. The latest labor market data showing weaker job creation has increased uncertainty about economic growth and policy direction, which often strengthens Bitcoin’s appeal as an alternative asset during periods of financial system uncertainty. However, higher bond yields and a stronger dollar continue to create short-term headwinds for risk assets, including cryptocurrencies. With no major economic releases today, markets are currently digesting last week’s data while reacting to geopolitical headlines and institutional crypto flows. If Bitcoin maintains support above $65,400 and eventually reclaims the $70,000 level, analysts expect the market to test higher resistance zones near $72,600, reinforcing the ongoing integration of cryptocurrency markets into the broader global macro environment.
Ethereum Prices: Why Is Ethereum Moving With ETF Flows and Whale Accumulation?
Ethereum is currently trading around $1,977, according to the latest weekly chart data, after experiencing moderate volatility during the past several trading sessions. The chart indicates that Ethereum opened near $1,937, reached a weekly high close to $2,004, dipped toward $1,929, and is now stabilizing near $1,977, representing roughly a 2.07% weekly gain. While Ethereum remains well below the highs seen earlier in the previous cycle above $4,000, the asset continues to trade within a broader consolidation structure as investors evaluate macroeconomic conditions and institutional demand trends. One of the most important structural indicators visible on the chart is the 200-week moving average near $2,432, a long-term level that many institutional investors use to measure whether the broader crypto market remains in a bullish or defensive phase. Even though Ethereum is currently trading slightly below that long-term benchmark, the price has held relatively stable above the $1,900 region, which analysts often view as an important support zone during periods of market correction. Momentum indicators also show that the Relative Strength Index is near 38, suggesting that the asset is approaching levels where selling pressure historically begins to stabilize after extended drawdowns. These technical signals are important because they help investors determine whether the current environment reflects a temporary consolidation phase or the early stages of a stronger recovery within the digital-asset market cycle.
Beyond technical structure, institutional flows and large investor activity remain critical drivers of Ethereum’s price behavior. Over the past week, attention across the crypto ecosystem has focused heavily on the direction of spot Ethereum exchange-traded fund (ETF) flows, which have become a key indicator of institutional demand. When ETF investors allocate capital into these products, the fund managers must purchase the underlying Ethereum in the open market, effectively creating structural demand that can support prices. Although inflows have slowed slightly during recent market volatility, institutional participation through ETF structures continues to provide an important foundation for the Ethereum ecosystem. At the same time, blockchain monitoring platforms have reported increased whale activity during recent price dips, with several large wallets transferring substantial amounts of ETH from exchanges into private storage. Historically, these movements are interpreted as accumulation signals, because coins moved away from trading platforms are typically held for longer periods rather than sold immediately. This behavior can reduce short-term selling pressure and help establish a market floor during volatile conditions. If Ethereum continues to hold above the $1,900 support region and institutional flows remain stable, analysts will be watching closely for a potential recovery toward the $2,200–$2,400 range, which could signal renewed confidence in the asset as the broader digital-asset ecosystem increasingly integrates with global financial markets.
