Where Are Market Today?
European and U.S. futures are holding near the flat line heading into Tuesday, March 17, 2026, signaling a cautious start to the trading session. S&P 500 futures are slightly lower by around 0.1%, Nasdaq 100 futures are down close to 0.2%, and Dow futures are marginally softer, while European futures are broadly flat to slightly negative. This positioning reflects a market that is stabilizing after a recent rebound but remains highly sensitive to macro and geopolitical developments. The primary driver behind this flat opening is the easing in oil prices, which has reduced immediate inflation pressure, although ongoing uncertainty surrounding global energy supply routes continues to limit upside momentum.
The first major force influencing this setup is the pullback in oil prices from last week’s surge, which had been driven by fears of supply disruption linked to tensions around the Strait of Hormuz. With Brent crude moving closer to the $100 level and WTI declining further, markets are finding short-term relief as lower energy prices ease concerns around input costs, consumer spending, and inflation expectations. However, this relief is not translating into a strong rally because the underlying risk has not disappeared. The possibility of renewed disruption to a critical global shipping route continues to act as a ceiling on risk appetite, keeping both European and U.S. futures anchored near flat levels rather than pushing higher.
The second key factor shaping market direction is the contrast between strong corporate momentum and rising macro uncertainty. Technology and AI-driven companies continue to provide support to broader indices, driven by strong forward demand expectations and ongoing investment in digital infrastructure. At the same time, investors are increasingly aware of emerging cracks in the broader economic picture, particularly in labor market trends and growth sustainability. This creates a disconnect where headline indices appear resilient, but underlying participation and conviction remain limited, resulting in a cautious and balanced futures positioning rather than a decisive directional move.
Finally, policy expectations and geopolitical developments are reinforcing a wait-and-see environment across global markets. Investors are positioning ahead of the upcoming central bank rate decision, with uncertainty around the path of interest rates as inflation risks remain tied to energy market volatility. At the same time, evolving geopolitical signals—including uncertainty around coordinated efforts to secure key shipping routes—continue to add layers of risk. This combination of easing inflation pressure, persistent geopolitical tension, and uncertain monetary policy direction explains why European and U.S. futures are opening flat, as markets pause to reassess the next major catalyst.
Major Index Performance as of Tuesday, 17 Mar 2026
- Nasdaq: Trading around 22,700, reflecting continued volatility in technology and semiconductor stocks.
- S&P 500: Trading around 6,699, supported by the recent rebound in equities following easing energy prices.
- Russell 2000: Trading around 2,503, highlighting cautious sentiment toward smaller, rate-sensitive companies.
- Dow Jones: Trading around 46,946, supported by relative strength in industrial and defensive sectors.
The Magnificent Seven and the S&P 500
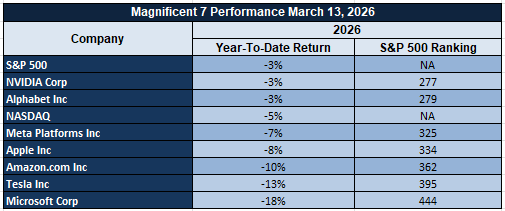
The “Magnificent Seven” — Apple, Microsoft, Nvidia, Amazon, Meta, Alphabet, and Tesla — continue to dominate market direction. Recent gains across this group were driven by renewed optimism around artificial intelligence infrastructure spending and easing energy-related pressures. However, this concentration also creates vulnerability. When these names move higher, they lift the broader indices, but any pullback can quickly reverse market momentum. From our perspective at Zaye Capital Markets, the reliance on a narrow group of mega-cap stocks remains a key risk factor, as broader market participation continues to lag.
Drivers Behind the Market Move – Tuesday, March 17, 2026
As U.S. and European markets navigate through a complex mix of geopolitical escalation, shifting energy dynamics, and critical economic data expectations, investor sentiment remains cautious and reactive. The interaction between policy signals, macro indicators, and global conflict developments is driving a fragile market structure, where short-term relief is repeatedly offset by underlying uncertainty.
- Middle East Tensions and Global Energy Route Risks
Geopolitical developments surrounding the Middle East continue to dominate market direction, particularly with ongoing concerns about the security of the Strait of Hormuz. Recent White House comments highlight uncertainty around leadership stability in Iran, challenges in negotiations, and increasing pressure on allies to secure key global shipping routes. While there are indications that some oil tankers are still moving through the Strait, the lack of full international coordination has kept markets on edge. This uncertainty is directly feeding into energy price volatility, which remains a key transmission channel into broader financial markets. As a result, investors are maintaining a cautious stance, with energy-sensitive sectors and transport-linked industries showing heightened sensitivity to any new developments.
- Policy Pressure and Interest Rate Expectations
Policy-related signals are playing a significant role in shaping market expectations, particularly with renewed calls for an immediate rate cut and a special central bank meeting. These developments are increasing speculation around potential shifts in the interest rate path, even as inflation risks remain elevated due to energy market volatility. The tension between easing financial conditions and controlling inflation is creating a complex environment for investors, where traditional policy signals are less predictable. Markets are responding by adopting a more defensive positioning, with both equities and bonds reflecting uncertainty around the timing and direction of future policy moves.
- Housing Data and Broader Economic Momentum
Economic data continues to provide critical signals, with particular focus on pending home sales as a measure of housing market activity and consumer strength. This indicator is especially important in the current environment, where affordability pressures and borrowing costs remain elevated. A stronger-than-expected reading would suggest resilience in consumer demand, potentially supporting equity markets but also reinforcing concerns about persistent inflation. On the other hand, a weaker outcome would point to slowing economic momentum, increasing expectations for policy easing but also raising concerns about growth durability. Combined with recent data showing modest expansion rather than strong acceleration, markets are adopting a wait-and-see approach, contributing to the mixed and cautious tone observed across global equities today.
In summary, the convergence of geopolitical uncertainty, evolving policy expectations, and key economic data releases is shaping today’s market landscape. Investors are navigating these factors carefully, leading to a balanced but fragile positioning across U.S. and European markets as they await clearer signals on both growth and risk.
Digesting Economic Data
The TRUMP Tweets and Its Implications
The latest White House comments reflect a clear escalation in geopolitical tone, particularly across the Middle East and Caribbean regions, with direct implications for global markets. Statements emphasizing uncertainty around Iran’s leadership, difficulty in negotiations, and pressure on allies to secure the Strait of Hormuz reinforce the perception of elevated geopolitical risk. The Strait remains one of the most critical energy chokepoints globally, and any uncertainty around its stability directly influences oil prices, shipping costs, and broader inflation expectations. At the same time, comments indicating that not all countries are willing to assist in reopening the Strait introduce further uncertainty about coordinated global responses. From our perspective at Zaye Capital Markets, this combination of uncertainty and pressure on allies increases the probability of prolonged instability, which tends to support safe-haven assets while maintaining a risk premium across energy markets.
In parallel, the comments around Cuba introduce an additional geopolitical layer that markets are beginning to monitor closely. Statements suggesting potential action and ongoing discussions indicate that geopolitical focus is not limited to one region, which broadens the scope of uncertainty. When markets are faced with multiple geopolitical fronts simultaneously, investor behavior typically shifts toward capital preservation and risk management. This can influence asset allocation decisions across equities, commodities, and currencies. Additionally, the emphasis on ensuring that Iran cannot obtain nuclear capabilities further reinforces a long-term strategic stance that could extend geopolitical tensions beyond short-term events, keeping markets sensitive to headline risk and policy developments.
On the monetary side, the call for an immediate rate cut and a special meeting introduces a direct challenge to the current policy path. Such statements increase market speculation around potential shifts in interest rate expectations, even if immediate action does not materialize. Lower rate expectations generally support liquidity conditions, influencing both risk assets and alternative assets such as gold and cryptocurrencies. However, this also introduces volatility in bond markets and currency movements, as investors reassess the trajectory of monetary policy. The interaction between geopolitical risk and monetary policy expectations creates a complex environment where markets must balance inflation concerns, growth expectations, and liquidity conditions simultaneously.
Beyond geopolitics and monetary policy, the announcement of a government-wide task force to eliminate fraud introduces a domestic policy angle that could have longer-term economic implications. Measures aimed at improving benefit eligibility verification, strengthening fraud detection, and enforcing documentation requirements suggest an effort to address inefficiencies that contribute to inflation and fiscal pressure. While these initiatives may not have immediate market-moving impact, they signal a broader policy direction focused on fiscal discipline and structural reforms. Combined with reaffirmations of constitutional stability and leadership appointments in security roles, the overall message reflects a multi-dimensional policy environment. For markets, this translates into a landscape where geopolitical developments, policy signals, and structural reforms are all interacting, requiring investors to remain highly responsive to both headline risk and underlying economic shifts.
Housing Sentiment Edges Higher as Builders Navigate Affordability Pressures
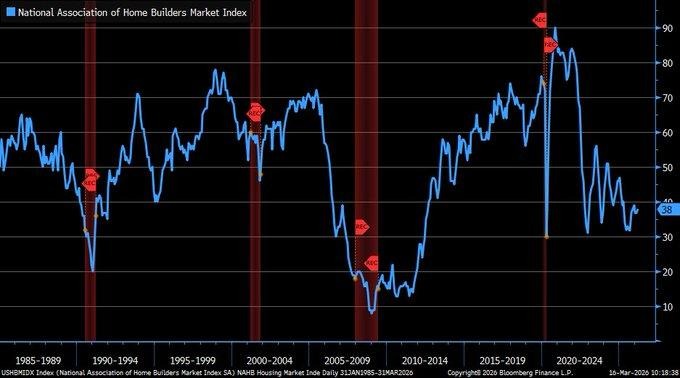
The March 2026 Housing Market Index rose to 38, beating the expected 37 and registering the first increase since December 2025, with the previous revision being 37. Although the index is still below the neutral level of 50, the rise indicates a slight stabilization in builder sentiment following a long period of weakness in the housing market. All major components in the survey registered an improvement for the month. The current conditions of single-family home sales improved to 42, while the sales expectations for the next six months rose to 49, indicating that the builders are slowly regaining confidence in the medium-term outlook. Furthermore, the buyer traffic, which is generally a leading indicator of demand, improved by three points to 25, indicating a slight improvement in interest from potential buyers despite the persisting affordability pressures.
However, despite the improvement in sentiment, the underlying data continues to point to the persistent pressure in the housing market. About 37% of homebuilders reported a reduction in prices for the month, with the average price cut of about 6%. At the same time, about 64% of homebuilders reported that they are employing sales incentives such as mortgage rate buydowns or home upgrades to attract sales. These efforts reflect the continued tension between high borrowing costs and affordability constraints on households. The long-term trend of the index also indicates that housing sentiment has been below the expansion threshold since mid-2022, occasionally approaching levels that have been historically consistent with recessionary conditions in the housing market. This indicates that while demand may be stabilizing, the housing market recovery is still fragile and dependent on borrowing costs and overall consumer purchasing power.
In light of these events, we believe that Lennar Corporation (LEN) currently appears to be undervalued in relation to the stabilization that is emerging in the single-family housing market. As one of the largest homebuilders with a geographically diverse footprint and strong market sensitivity to entry-level housing demand, the firm is well-positioned to capitalize on continued improvements in buyer traffic and limited housing inventory. The company’s size and integrated construction business enable it to dynamically adjust pricing strategies while sustaining competitive margins during periods of demand softness. From our perspective at Zaye Capital Markets, analysts are advised to pay close attention to mortgage rate trends, new home order volumes, and homebuilder incentives over the next few months. If affordability pressures recede while buyer traffic continues to recover, homebuilders with optimized cost structures could see improved earnings visibility and valuation multiples.
Industrial Production Edges Higher, Signaling Stable Manufacturing Output
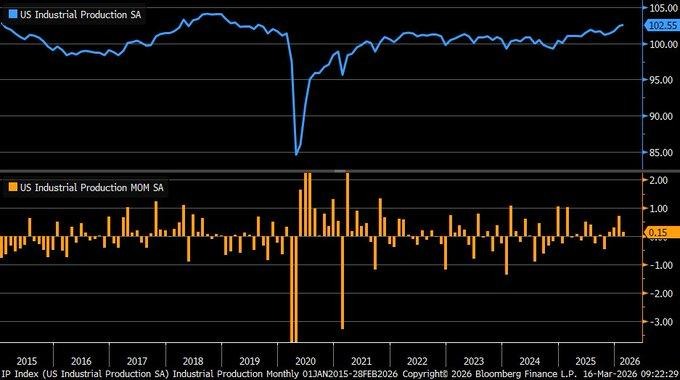
The February 2026 industrial production report showed a modest but important improvement, rising by 0.15% month-over-month, slightly exceeding expectations of 0.1% but slowing considerably from January’s stronger 0.8% increase. The data highlights that production across factories, mines, and utilities continues to expand, though at a more moderate pace as the economic cycle matures. Manufacturing output increased by 0.2%, providing the primary support for the headline figure, while utilities production declined by 0.6%, offsetting part of the manufacturing strength. Industrial production remains one of the most important real-economy indicators because it reflects the physical output of goods across the economy. When manufacturing remains stable despite tighter financial conditions, it often signals that business investment and supply chain activity continue supporting economic momentum.
Looking at the longer-term trend, industrial output has demonstrated a steady recovery over the past decade, with the index hovering near the 102 level on a seasonally adjusted basis. Although the data series experienced significant volatility during the 2020 downturn, the broader trajectory shows resilience in production activity despite higher borrowing costs and shifting demand conditions. The February reading reinforces the idea that the industrial sector is experiencing a gradual cooling rather than a contraction. The slowdown in utilities output may reflect seasonal energy demand fluctuations, but it also highlights potential pressure within energy-intensive sectors. Overall, the data supports a narrative of economic moderation rather than sharp deterioration, suggesting that manufacturing activity remains capable of sustaining production levels even as broader economic growth slows.
Given these findings, we believe that Emerson Electric Co. (EMR) appears undervalued relative to the current industrial production environment. As a leading provider of industrial automation systems, intelligent process control solutions, and digital manufacturing infrastructure, the company is strategically positioned to benefit from stable factory output and ongoing investments in productivity improvements. Emerson’s technologies allow manufacturers to maintain production efficiency while managing operational costs in an environment where businesses remain cautious about workforce expansion. At Zaye Capital Markets, we believe analysts should closely monitor manufacturing order trends, capital expenditure guidance from industrial companies, and capacity utilization levels across factories. Continued stability in these indicators could reinforce the case for industrial automation companies as production efficiency becomes increasingly important for manufacturers navigating a slower but still expanding economic cycle.
Economic Calendar Points to Policy Week as Markets Remain Focused on Rate Decision
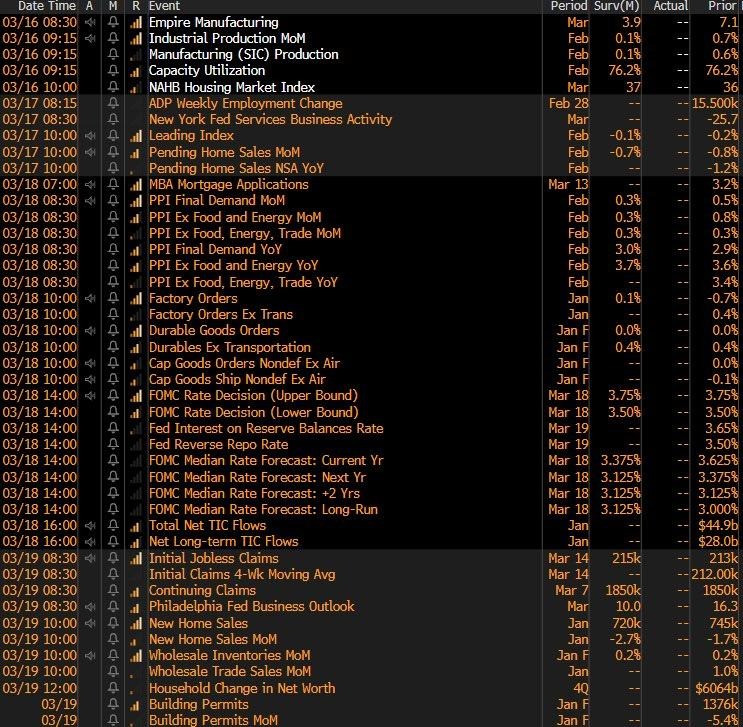
Looking at the economic calendar for the period of March 16-20, 2026, it is clear that one of the most policy-sensitive weeks for financial markets is ahead, with a number of important economic data releases that have the potential to influence market sentiment regarding economic growth and monetary policy. The most important event of the week is the interest rate decision, set to take place on March 18, which is generally considered to be the primary driver of short-term market volatility in financial markets, including stocks, bonds, and commodities. In addition to the interest rate decision, the economic calendar also points to important economic data releases, including the Empire Manufacturing survey due out on March 16 and initial jobless claims on March 19. These two indicators offer information on manufacturing sector performance and labor market conditions, which are two factors that are considered essential by policymakers when assessing the performance of economic growth.
Market participants usually pay close attention to such economic calendars, as a concentration of highly influential economic data points can increase price volatility across various markets. Leading into the week, survey data indicates that market participants are expecting stable growth in industrial production of approximately 0.7% month-over-month and a capacity utilization rate of 76.3%. These economic metrics are significant because industrial production measures real economic activity in the manufacturing and energy sectors, while capacity utilization measures how heavily businesses are utilizing existing production capacity. A stable reading in both of these metrics often indicates that the economy is functioning without significant disruptions. However, geopolitical events and energy price volatility can impact such expectations, especially if rising energy prices start to impact industrial input costs and transportation costs.
Under such circumstances, we at Zaye Capital Markets believe that Caterpillar Inc. (CAT) currently looks undervalued in comparison to the overall industrial sector outlook. As a leading manufacturer of heavy machinery, construction equipment, and energy-related industrial systems, Caterpillar is well-positioned to benefit from stable industrial production and infrastructure spending cycles. The company’s global footprint in the construction, mining, and energy sectors makes it well-positioned to capitalize on demand when production capacity is utilized and infrastructure spending continues to grow. We at Zaye Capital Markets believe that market analysts should pay close attention to the outcome of the policy decision, trends in industrial production data, and changes in capacity utilization levels in the coming months. If production activity stabilizes while infrastructure spending continues to grow, companies that manufacture heavy industrial equipment may see increased demand visibility and improved earnings visibility.
Upcoming Economic Events
USA Pending Home Sales m/m
As markets continue to progress through a week that has been filled with significant economic indicators, investors will be watching the release of the Pending Home Sales month-over-month figure very closely. This economic indicator measures the change in the number of homes that are pending sale, making it one of the first indicators of future activity in the housing market. Because a home sale is typically finalized several weeks after a sale has been agreed upon, pending home sales can be considered a leading indicator of existing home sales and overall housing demand. Overall, housing market data is of particular interest to investors, as the residential real estate market has a significant impact on construction, consumer confidence, mortgage sales, and expenditures on household goods. In the current market, where interest rates are still high, investors are particularly interested in determining whether housing demand is stabilizing or weakening further.
- If the actual Pending Home Sales figure is greater than the predicted figure, it would indicate that housing demand is more resilient than anticipated despite affordability issues. A strong number would indicate that contract activity is strong, and that buyers are still entering the market, possibly in response to stabilizing mortgage rates or improved expectations of household income. For investors, a strong number could be a positive indicator for the housing-related sectors such as homebuilders, construction materials companies, and housing supply retailers. However, a strong number could also serve to further solidify the notion that the overall economy is strong, which could reduce expectations of aggressive interest rate cuts. In this scenario, bond yields could rise, and equities related to the cyclical economic growth areas such as construction and industry could see increased interest from investors.
- On the other hand, if the Pending Home Sales number falls short of the predicted amount, it would be a sign that the housing market is still struggling with demand due to high financing costs. A lower number could also be a sign that potential buyers are holding off on purchasing a home due to high financing costs compared to household income levels. In the financial markets, a negative surprise could pressure housing stocks and construction companies, while raising investor expectations that economic growth is slowing down. Such an event could also encourage investors to buy defensive stocks and government bonds as they position themselves for slower economic growth. At Zaye Capital Markets, we expect analysts to monitor mortgage rates, housing inventory, and homebuilder order data following the release, as these indicators will help determine whether the housing market is stabilizing or facing another period of weak demand.
Stock Market Performance
Indexes Recover from April Lows, Yet Underlying Market Breadth Remains Uneven
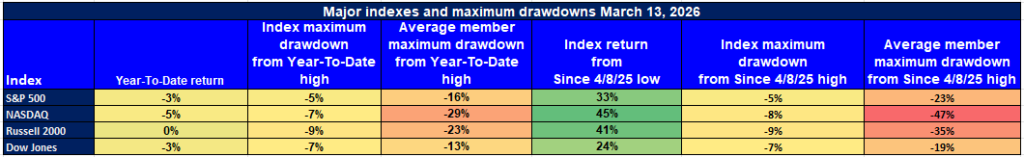
Equity markets have made a substantial recovery since the April 8, 2025 lows, but the underlying data suggests that the recovery has not been uniform across the broader market. Although the headline indexes suggest a recovery, the level of drawdowns and the performance of the average stock within the indexes suggest that the market structure is more delicate than the headline data would suggest. In our view at Zaye Capital Markets, the decoupling of index performance and stock performance suggests that investors should be cautious and monitor market breadth metrics rather than focusing solely on headline indexes.
Below is our analysis of the latest performance of the major equity indexes based strictly on the data presented in the chart:
S&P 500: Headline Stability Masks Broad Stock Weakness
YTD: -3% | +33% since April 8, 2025 low | -5% from YTD high | Avg. member: -16%
The S&P 500 has been down 3% year-to-date, although it has recovered 33% from the April 8, 2025 low. The index has had a relatively tame maximum drawdown of 5% from its year-to-date high. However, the average stock within the index has had a more substantial drawdown of 16% from its YTD high. Since the April 8 low, the index has had a drawdown of 5%, although the average stock drawdown has increased to 23%, reflecting the decoupling of large-cap indexes from the broader market.
NASDAQ: Strong Rebound Led by Select Leaders
YTD: -5% | +45% since April 8, 2025 low | -7% from YTD high | Avg. member: -29%
The NASDAQ has been down 5% year-to-date, but it has shown the strongest recovery among the major indexes with a 45% recovery since the April low. The NASDAQ has seen a maximum drawdown of 7% from its YTD high. However, the average stock in the NASDAQ has seen a much steeper drawdown of 29% from the YTD high and an even steeper 47% drawdown since the April 8 low. This indicates that a few large technology leaders have been driving the index’s performance.
Russell 2000: Small-Caps Struggle Despite Rebound
YTD: 0% | +41% since April 8, 2025 low | -9% from YTD high | Avg. member: -23%
The Russell 2000 index is flat year-to-date, indicating a cautious outlook on smaller companies that are generally more vulnerable to economic conditions and interest rates. Although the index has had a strong 41% recovery since the April 2025 low, it has still seen a 9% drawdown from its YTD high. The average stock in the index has seen a much steeper drawdown of 23% from the YTD high and 35% since the April low, indicating that small-caps continue to face challenges.
Dow Jones: Defensive Components Provide Relative Stability
YTD: -3% | +24% since April 8, 2025 low | -7% from YTD high | Avg. member: -13%
The Dow Jones Industrial Average is down 3% year to date and has experienced a 24% rebound from the April 2025 low. The index has experienced a 7% drawdown from its YTD high, while the average member drawdown from the YTD peak is at 13%. Since the April low, the index drawdown is still at 7%, but the average member has experienced a more severe 19% drawdown. The smaller difference between the index performance and the average member performance is due to the fact that the Dow Jones is comprised of mature and diversified companies, which tend to be more stable during times of market volatility.
From our perspective at Zaye Capital Markets, the current market environment highlights a key theme: headline index rebounds are being driven by a relatively narrow group of companies, while the broader universe of stocks continues to face deeper drawdowns. As a result, investors should continue monitoring market breadth, sector rotation, and earnings resilience when assessing whether the current recovery represents a sustainable expansion phase or merely a leadership-driven rebound.
The Strongest Sector In All These Indices
Energy Leads Sector Performance as Defensive and Cyclical Gaps Widen
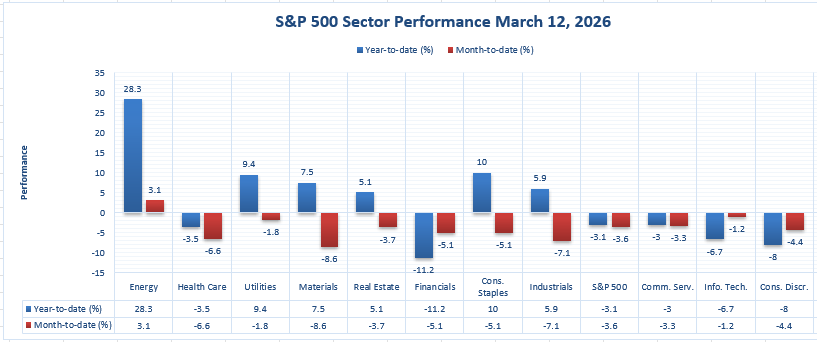
Strictly based on the data presented in the chart, Energy is the strongest sector in the S&P 500 sector performance table with a year-to-date return of 28.3% and a month-to-date return of 3.1%. No other sector comes close to this performance. The next best performers in the year-to-date returns are Consumer Staples with 10.0%, Utilities with 9.4%, Materials with 7.5%, Industrials with 5.9%, and Real Estate with 5.1%. In contrast, the S&P 500 is down -3.1% year-to-date and down -3.6% month-to-date, making Energy’s relative strength even more impressive.
What catches our attention at Zaye Capital Markets is that Energy not only leads on a year-to-date basis, but it is also one of the few sectors that still has a positive month-to-date performance. This is important. A sector that leads on both time horizons tends to indicate that it has experienced persistent institutional buying rather than a mere bounce. In contrast, some sectors that have positive year-to-date performance are actually negative on a month-to-date basis, including Utilities at -1.8%, Materials at -8.6%, Real Estate at -3.7%, Consumer Staples at -5.1%, and Industrials at -7.1%. This suggests that while these sectors have fared relatively better in the year, their current momentum has actually turned south. Energy, on the other hand, is positive on both counts.
The relative weakness of the rest of the market makes the leadership of Energy even more pronounced. Financials are down -11.2% year-to-date and -5.1% month-to-date, Information Technology is down -6.7% and -1.2%, Consumer Discretionary is down -8.0% and -4.4%, Health Care is down -3.5% and -6.6%, and Communication Services is down -3.0% and -3.3%. In our view at Zaye Capital Markets, this chart indicates that the market is characterized by very narrow leadership that is highly concentrated. Energy stands out in a big way, while the rest of the sectors are either negative on both time horizons or losing steam on a month-to-date basis. This makes Energy the best-performing sector in this chart by a wide margin.
Earnings
Yesterday’s Earnings – March 16, 2026
- Hon Hai Precision Industry — The company reported full-year 2025 net income of TWD 189,353.85 million, rising from TWD 152,705.07 million the previous year, highlighting strong growth driven largely by expanding demand in advanced electronics manufacturing. For Q4 2025, revenue reached approximately TWD 2.61 trillion, although quarterly profit declined about 2% year-over-year, falling short of some forecasts. Despite the softer quarterly performance, management emphasized a strong outlook for AI server demand in 2026, which continues to drive investment in data-center infrastructure and advanced computing supply chains.
- Guotai Junan Securities — Recent quarterly figures across 2025 showed mixed but overall resilient performance within capital markets activity. Q3 2025 EPS came in at 0.3606, missing forecasts by -14.49%, while revenue reached 24.06 billion, beating expectations by +109.76%. Earlier quarters showed stronger earnings momentum, including Q2 2025 EPS of 0.422, beating estimates by +6.79%, and Q1 2025 EPS of 1.16, representing a substantial earnings surprise. Across the trailing twelve months, earnings were estimated around $4.00 billion with revenues near $6.91 billion, reflecting continued activity in brokerage services and capital markets operations.
- Fubon Financial Holding — The group reported full-year 2025 net income of TWD 120,943.98 million, compared with TWD 150,820.14 million in 2024, while still maintaining record operational strength across its subsidiaries. Fubon Life generated more than TWD 62 billion in profit, Taipei Fubon Bank delivered more than TWD 36 billion in net profit, and Fubon Securities reported record earnings above TWD 10 billion. Additionally, Fubon Insurance posted net profit of TWD 6.97 billion, roughly doubling year-over-year. Monthly data for February 2026 also showed consolidated pre-tax profit of NT$20.75 billion and net profit of NT$20.57 billion, marking a new historical high for the group.
- Dollar Tree — The company reported Q4 fiscal year 2025 results with diluted earnings per share of $2.56, slightly beating market estimates of $2.53. Quarterly revenue reached $5.45 billion, slightly below the $5.46 billion expectation but still reflecting strong performance supported by comparable store sales growth of 5.0%. For the full fiscal year 2025, net sales from continuing operations totaled approximately $19.4 billion, representing roughly 10% year-over-year growth. Looking ahead, the company expects FY2026 comparable store sales growth of 3%–4%, with adjusted EPS projected between $6.50 and $6.90, indicating continued expansion in value-focused retail demand.
Today’s Earnings – March 17, 2026
- Tencent Music Entertainment Group (TME) — Investors will closely monitor the company’s earnings release with particular attention to subscription growth, advertising revenue expansion, and user monetization trends across its digital music and social entertainment ecosystem. The key factor investors will watch is whether the company can continue converting its large user base into paid subscribers, which remains central to long-term revenue expansion and profitability improvement.
- Oklo Inc. (OKLO) — Market participants will focus on developments in the advanced nuclear energy sector, particularly updates related to small modular reactor technology, project timelines, and capital investment plans. Investors will also be looking for updates on regulatory progress and long-term infrastructure deployment, as next-generation nuclear technology continues attracting attention as a potential source of reliable clean energy.
- Atour Lifestyle Holdings Limited (ATAT) — The company’s results are expected to provide insight into hospitality and travel demand, with analysts focusing on hotel occupancy rates, average room pricing trends, and expansion strategy across its property portfolio. These metrics will offer signals about the strength of leisure and business travel spending within the hospitality sector.
- Corporacion America Airports SA (CAAP) — Investors will watch closely for passenger traffic growth, airport revenue performance, and infrastructure investment updates across the company’s global airport network. Particular attention will be given to commercial revenue streams such as retail and duty-free operations, which often provide early signals about broader international travel demand and airport traffic recovery trends.
Stock Market Overview – Tuesday, 17 Mar 2026
U.S. equity markets are trading cautiously as investors digest geopolitical tensions in the Middle East, fresh economic data releases, and expectations surrounding monetary policy signals this week. Volatility remains elevated after energy prices surged earlier in the month before partially retreating, allowing equities to stabilize. At Zaye Capital Markets, we observe that markets are currently being driven by a combination of artificial intelligence optimism and macro uncertainty, creating a mixed but opportunity-rich environment.
Stock Prices
Economic Indicators and Geopolitical Developments
The current market tone reflects the interaction between macroeconomic data and geopolitical risks. Rising tensions tied to Iran initially pushed oil prices sharply higher, creating pressure on equities before a partial pullback in energy markets helped support a rebound. Investors are also positioning ahead of key policy signals this week, while recent manufacturing and labor data suggest the economy is cooling but not contracting. This balance between resilience and caution continues to define market sentiment.
Latest Stock News
- $NVDA | Nvidia dominated market attention as its CEO highlighted an expected $1 trillion in AI chip demand through 2027, driven by its Blackwell and Vera Rubin architectures. The company also introduced new AI chip and server systems, intensifying competition across the semiconductor space. The stock rose roughly 1.6%–2%, reinforcing its leadership in the AI-driven rally and highlighting the scale of demand from hyperscale cloud providers.
- $META | Meta shares gained around 2.3% after reports of a planned workforce reduction of at least 20%, aimed at controlling costs and reallocating capital toward artificial intelligence investments. The company also secured a $27 billion AI infrastructure deal, signaling aggressive expansion in long-term computing capacity.
- $MSFT, $GOOGL, $AMZN | Microsoft, Alphabet, and Amazon all benefited from Nvidia’s comments highlighting their role as key cloud infrastructure providers supporting AI growth. These companies are collectively involved in over $700 billion in data center expansion commitments, reinforcing their position at the center of the AI ecosystem. Their stocks moved modestly higher as part of the broader technology rebound.
- $TSLA | Tesla rose approximately 1.1% after announcing the launch timeline for its Terafab AI chip project, signaling a deeper push into in-house AI hardware development and vertical integration within its technology stack.
- $AAPL | Apple remained relatively stable, participating in the broader market rebound without a specific catalyst, as investors continue to evaluate its positioning within the evolving AI landscape and consumer demand trends.
- $PLTR, $AMD, AI Ecosystem | Palantir and AMD remained supported by broader AI sentiment, while companies tied to the AI ecosystem, including those connected to OpenAI and Anthropic infrastructure, continued to benefit from rising demand for data centers and computing capacity. Overall, the broader technology sector rallied, with the Nasdaq gaining around 1.2% and the S&P 500 rising about 1%, driven largely by AI optimism and easing oil price pressures.
The Magnificent Seven and the S&P 500

The “Magnificent Seven” — Apple, Microsoft, Nvidia, Amazon, Meta, Alphabet, and Tesla — continue to dominate market direction. Recent gains across this group were driven by renewed optimism around artificial intelligence infrastructure spending and easing energy-related pressures. However, this concentration also creates vulnerability. When these names move higher, they lift the broader indices, but any pullback can quickly reverse market momentum. From our perspective at Zaye Capital Markets, the reliance on a narrow group of mega-cap stocks remains a key risk factor, as broader market participation continues to lag.
Major Index Performance as of Tuesday, 17 Mar 2026
- Nasdaq: Trading around 22,700, reflecting continued volatility in technology and semiconductor stocks.
- S&P 500: Trading around 6,699, supported by the recent rebound in equities following easing energy prices.
- Russell 2000: Trading around 2,503, highlighting cautious sentiment toward smaller, rate-sensitive companies.
- Dow Jones: Trading around 46,946, supported by relative strength in industrial and defensive sectors.
At Zaye Capital Markets, we maintain that this is a selective market environment. Artificial intelligence remains the dominant structural theme, but macro risks—including energy volatility and policy uncertainty—continue to shape short-term movements. Investors should remain focused on quality companies with strong earnings visibility while monitoring market breadth for confirmation of a more sustainable rally.
Gold Price: How Geopolitics and Economic Data Are Driving Gold Prices Higher
Spot gold is currently trading around $5,038.35 per ounce as of Tuesday, 17 March 2026, holding at elevated levels as markets respond to a combination of geopolitical escalation and shifting monetary expectations. The latest White House comments have intensified uncertainty across global markets, particularly around Iran, the Strait of Hormuz, and broader Middle East stability. Statements highlighting uncertainty in leadership, pressure on allies to secure critical oil routes, and ongoing tensions around energy flows have reinforced concerns about potential supply disruptions. This type of geopolitical backdrop historically drives capital into safe-haven assets, and gold is directly benefiting from that positioning. At the same time, calls for immediate rate cuts introduce an additional macro layer—when markets begin pricing in lower interest rates, real yields tend to fall, making gold more attractive as a non-yielding asset. The combination of geopolitical instability and easing expectations is therefore reinforcing sustained demand rather than short-term speculation.
Looking ahead, the release of Pending Home Sales data will act as a near-term catalyst for gold price direction. A weaker-than-forecast reading would strengthen the case for economic slowdown, increasing expectations for policy easing and further supporting gold through lower yields and defensive positioning. Conversely, a stronger reading could temporarily pressure gold by lifting yields and reducing urgency for rate cuts, although geopolitical risks are likely to maintain a strong price floor. Meanwhile, yesterday’s economic data—particularly the moderation in industrial production and mixed manufacturing signals—has already contributed to a balanced sentiment where growth is slowing but not collapsing. This “soft landing” backdrop creates sustained uncertainty around policy direction, which continues to support gold. The current setup reflects a multi-layered support structure driven by geopolitical risk, monetary policy expectations, and cautious economic momentum, keeping gold firmly positioned as a key hedge within the broader financial ecosystem.
Oil Prices: How Geopolitics and Economic Data Are Driving Oil Prices Today
Brent crude is currently trading at $103.04 per barrel, while WTI crude stands at $95.84 per barrel as of Tuesday, 17 March 2026, holding elevated levels as markets continue to price in geopolitical risk alongside shifting demand expectations. The primary driver behind recent price movements remains the escalating tension surrounding Iran and the Strait of Hormuz, a critical chokepoint for global oil supply. White House comments pointing to uncertainty around Iran’s leadership, pressure on allies to secure shipping routes, and acknowledgment that some countries are reluctant to assist in reopening the Strait have reinforced fears of potential supply disruptions. At the same time, statements suggesting that energy policy responses will depend on how long the conflict persists have introduced an additional layer of uncertainty, keeping a risk premium embedded in oil markets. However, prices have not moved in a straight line upward. Reports that some oil shipments continue to pass through the Strait, combined with market reassessments of actual supply disruption risks, have triggered periodic pullbacks. Broader market commentary also reflects ongoing supply discipline from major producers, while global energy agencies continue to highlight that the supply-demand balance remains highly sensitive to geopolitical developments rather than purely demand-driven factors.
On the demand side, yesterday’s economic data contributed to a stabilizing but cautious sentiment across energy markets. Industrial production showed continued expansion, though at a slower pace, reinforcing the view that global demand remains intact but is not accelerating strongly. This type of data supports oil prices at current levels but limits aggressive upside unless supply risks intensify further. Looking ahead, today’s Pending Home Sales data will act as a key near-term demand indicator for energy markets. A weaker-than-forecast reading would suggest slowing economic activity, potentially reducing expectations for fuel consumption and placing downward pressure on oil prices. Conversely, a stronger reading would reinforce economic resilience, supporting demand expectations and helping sustain current price levels or push them higher. In this environment, oil is trading at the intersection of two powerful forces: geopolitical supply uncertainty and macroeconomic demand signals. As long as tensions around key energy routes persist while economic data remains mixed, oil prices are likely to remain volatile, with upward moves driven by supply fears and downward corrections triggered by demand concerns, keeping the market in a reactive and headline-driven trading range.
Bitcoin Price: How Geopolitics and Economic Data Are Driving Bitcoin Prices Higher
Bitcoin is currently trading at $74,307 as of Tuesday, 17 March 2026, holding near its highest level since early February after advancing more than 3% and briefly pushing above key resistance levels. The recent move reflects a clear shift in market behavior, where Bitcoin is increasingly being positioned alongside traditional safe-haven assets during periods of geopolitical uncertainty. The latest White House comments—highlighting instability around Iran, pressure on allies to secure the Strait of Hormuz, and broader uncertainty in global leadership dynamics—have contributed to a rise in macro risk perception. This environment is pushing capital into alternative assets, and Bitcoin is benefiting from that rotation. At the same time, calls for immediate rate cuts are reinforcing expectations of increased liquidity and lower real yields, both of which historically support Bitcoin’s price. On the technical side, the break above the 50-day moving average and the confirmed move above the $74,000 level, with a peak at $74,307, signal strengthening momentum. Institutional flows remain a key driver, with ETF inflows and large strategic buyers supporting demand, while derivatives activity continues to amplify short-term price movements. Importantly, this rally is occurring while sentiment remains cautious, indicating that positioning and macro-driven allocation—not speculative excess—are driving the move.
From a broader macro perspective, yesterday’s economic data has played a supportive role in shaping Bitcoin’s current trajectory. Industrial production and manufacturing indicators pointed to a slowing but still stable economy, reinforcing the idea that growth is moderating without collapsing. This “soft landing” environment creates uncertainty around policy direction, particularly when combined with renewed pressure for rate cuts. Such conditions tend to favor Bitcoin, as investors look for assets that can perform outside traditional financial systems. Looking ahead, today’s Pending Home Sales data will act as a key short-term catalyst. A weaker-than-expected reading would strengthen expectations of economic slowdown, potentially accelerating flows into Bitcoin as investors seek alternative stores of value and protection against policy shifts. Conversely, a stronger reading could support broader risk sentiment but may reduce the urgency of immediate crypto inflows. Overall, Bitcoin is currently supported by a multi-layered framework: geopolitical instability, evolving monetary policy expectations, and improving technical structure. As long as uncertainty around global policy and economic momentum persists, Bitcoin remains positioned as both a risk asset and a hedge, with sustained strength above $74,000 increasing the likelihood of a continuation toward the $80,000 level.
Ethereum (ETH) Price: How ETF Flows and Whale Activity Are Driving Ethereum Prices
Ethereum is currently trading at $2,312 as of Tuesday, 17 March 2026, positioning itself in a relatively stable range despite broader volatility across global markets. Recent price behavior reflects a balance between institutional demand and cautious market sentiment. Over the past week, flows linked to Ethereum-focused investment products have remained a key driver, with institutional positioning continuing to provide underlying support. While inflows have not shown explosive acceleration, they have remained consistent enough to prevent deeper downside pressure. This steady demand suggests that Ethereum is still being accumulated as part of broader digital asset allocation strategies, particularly as investors look beyond Bitcoin for exposure to blockchain infrastructure, decentralized finance, and smart contract ecosystems.
At the same time, whale activity has played a critical role in shaping short-term price movements. On-chain data over the past week indicates that large holders have been selectively accumulating Ethereum during dips while also taking profits near resistance levels, creating a range-bound structure. This type of behavior often results in controlled volatility, where sharp sell-offs are absorbed by accumulation and rallies are capped by distribution. The absence of aggressive net selling from whales is a key stabilizing factor for the market, as it suggests that long-term holders remain confident in Ethereum’s positioning. As ETF-related demand continues to provide a steady flow of capital and whale accumulation offsets short-term selling pressure, Ethereum remains supported at current levels, with further price direction likely dependent on sustained institutional inflows and broader risk sentiment across global markets.
