Where Are Market Today?
European and U.S. futures are opening higher into Friday’s session, reflecting a modest recovery in risk sentiment after recent declines. U.S. futures are showing early gains, with the Dow up 0.23%, the S&P 500 higher by 0.18%, and the Nasdaq-100 advancing 0.17%, while European futures are also moving in the same direction. The primary driver behind this move is the easing of immediate geopolitical fears following signals that the Strait of Hormuz could reopen sooner than expected. This shift reduces the probability of prolonged supply disruptions, allowing investors to step back into risk assets after a period of defensive positioning.
A second key factor supporting futures is the pullback in oil prices from recent highs. While crude remains significantly elevated on a monthly basis, the recent decline has helped ease short-term inflation concerns that were weighing on equities. Lower oil pressure directly improves the outlook for consumer spending and corporate margins, particularly in Europe where economies are more sensitive to energy costs. This dynamic is helping stabilize sentiment across both regions, as markets begin to price in a less severe inflation shock than previously feared.
However, the broader market backdrop remains fragile despite this early rebound. Major indices are still on track for consecutive weekly losses, and there is increasing concern that current valuations do not fully reflect the economic damage caused by ongoing geopolitical tensions. Rising energy costs in recent weeks have already begun to erode purchasing power, while elevated interest rates continue to tighten financial conditions. This combination is creating a disconnect between market expectations and underlying economic realities, keeping institutional investors cautious and limiting the strength of any upside move.
At Zaye Capital Markets, we view this as a relief-driven bounce rather than a structural shift in trend. While easing geopolitical tensions and softer oil prices are providing near-term support, sustained upside will require confirmation that energy markets stabilize and that economic growth can withstand tighter financial conditions. Until then, both European and U.S. markets are likely to remain sensitive to headlines, with volatility driven by developments in energy supply, policy expectations, and global risk sentiment.
Major Index Performance as of Friday, 20 Mar 2026
- Nasdaq Composite: Trading at 22,090.69, down 0.3%, as mega-cap technology stocks remain under pressure.
- S&P 500: Trading at 6,606.49, down 0.3%, with weakness driven by inflation concerns and rate expectations.
- Russell 2000: Trading at 2,494.71, up 0.6%, showing relative strength in small-cap equities.
- Dow Jones Industrial Average: Trading at 46,021.43, down 0.4%, reflecting pressure on large-cap industrials.
The Magnificent Seven and the S&P 500

The “Magnificent Seven” — Apple, Microsoft, Nvidia, Amazon, Meta, Alphabet, and Tesla — are currently facing renewed selling pressure, acting as a drag on both the S&P 500 and Nasdaq. While Nvidia continues to benefit from AI-driven optimism, the broader group is being repriced as higher interest rate expectations reduce the value of future earnings. The scale of planned AI spending is also raising concerns about profitability timelines. Given their heavy index weighting, weakness in this group is masking broader market softness and reinforcing narrow leadership concerns.
Drivers Behind the Market Move – Friday, March 20, 2026
As U.S. and European markets navigate a sensitive mix of geopolitical developments, energy price adjustments, and recent economic signals, investor sentiment remains cautious but reactive. The latest developments from late yesterday and early today are shaping short-term positioning, with markets balancing relief from easing tensions against persistent macro pressures.
- Geopolitical Signals Ease Immediate Risk Premium
Recent official remarks pointing to weakening capabilities of key adversaries and the possibility of a shorter-than-expected conflict are helping to reduce immediate geopolitical risk premiums. Indications that the Strait of Hormuz could reopen sooner have eased fears of prolonged disruption to global energy flows. This has supported a modest recovery in equity futures across both regions, as investors rotate slightly back into risk assets. However, continued military objectives and strong rhetoric around deterrence suggest that underlying risks remain active, keeping markets highly sensitive to any escalation or reversal in developments.
- Energy Price Pullback Supports Short-Term Sentiment
Energy markets remain central to today’s market direction. After a sharp surge driven by conflict-related disruptions, oil prices have pulled back, helping to ease immediate inflation concerns. Prior commentary acknowledging that oil prices surged due to the conflict—and could decline once tensions subside—has reinforced expectations of continued volatility but potential downside if stability improves. This easing in energy pressure is particularly supportive for European markets, where economies are more exposed to imported energy costs, and is contributing to a short-term improvement in equity sentiment while keeping inflation expectations uncertain rather than decisively lower.
- Recent Economic Data Reinforces Higher-for-Longer Outlook
Economic data released yesterday continues to shape market expectations by signaling resilience alongside persistent inflation pressures. Stronger manufacturing activity, stable labor indicators, and elevated producer costs suggest that price pressures remain embedded in the system. This reduces the likelihood of near-term policy easing and reinforces a higher-for-longer interest rate environment. With no major economic releases scheduled today, markets are left without fresh catalysts, leading to a positioning-driven session where investors remain cautious, awaiting clearer direction from upcoming data.
In summary, easing geopolitical tensions, a pullback in energy prices, and firm economic data are collectively shaping today’s market landscape. While short-term sentiment has improved, underlying macro pressures and policy uncertainty continue to limit conviction, keeping both U.S. and European markets in a cautious, headline-driven environment.
Digesting Economic Data
New Home Sales Collapse: What This Means for Housing Demand and Rates
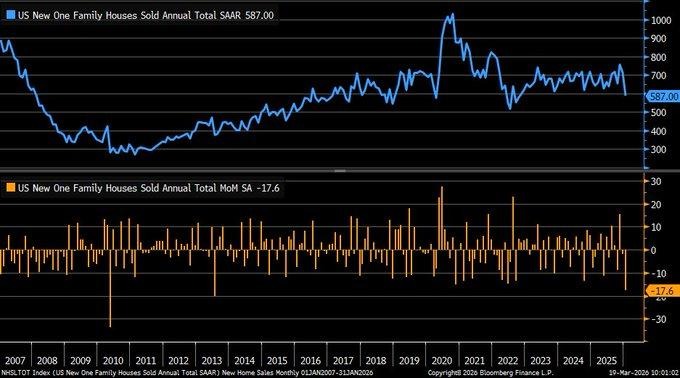
The January 2026 data shows that new single-family home sales have contracted by 17.6%, falling to an annualized rate of 587,000, which is the largest decline since the housing market slowdown following the recession. This is a clear indicator that housing demand is suffering, with cyclical and structural factors affecting this sector. Compared to last year, new single-family home sales have fallen by 11.3%, while median home prices have dropped by 6.8% to $400,500.
The factors that have contributed to this decline in new single-family home sales are clear indicators that there is an affordability crisis in this sector, driven by high borrowing costs and tightening credit markets. The fact that mortgage rates remain near 6% means that demand for new homes is being suppressed, particularly for first-time buyers, while severe winter weather has been another factor that has impacted new single-family home sales in recent weeks. However, beyond these factors, it is clear that buyers are being cautious, driven by uncertainty regarding income stability and mortgage rates in the near term. Additionally, there are signs that housing supply is starting to become an issue, with unsold new homes building up in some markets, thus pressuring builders to offer discounts to buyers to improve demand.
In this backdrop, we believe D.R. Horton Inc. (DHI) is undervalued based on its long-term positioning. The company, being one of the leading homebuilders with a strong focus on entry-level and affordable housing products, is likely to benefit from the stabilization of rate pressures. Analysts should keep a close eye on the current trends in mortgage rate pressures, absorption rate, and builder incentives, as this will give an idea about the timing of stabilization in demand. Although the current scenario is challenging, leading homebuilders with flexible pricing models and strong land positions will benefit disproportionately from the potential recovery.
Philadelphia Manufacturing Strength Signals Output Growth but Cost Risks
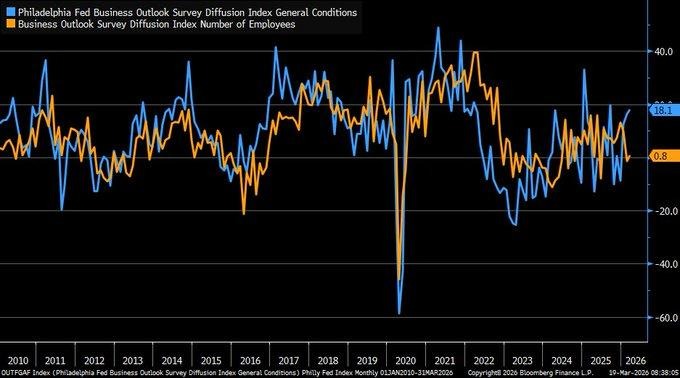
The March 2026 Philadelphia Manufacturing Index report showed a robust upside surprise, recording a +18.1 reading and beating both consensus and the previous month’s report. This indicates a clear acceleration in the rate of economic growth for the region. This was driven mainly by a large increase in the shipments component, which suggests that the region’s manufacturing plants are pushing out more goods, even as the macro environment remains uncertain. At the same time, the prices paid component also rose, which suggests that cost pressures are starting to build again within the manufacturing cycle. This therefore suggests that the manufacturing cycle is indeed being maintained but at the cost of higher costs, which therefore supports the persistence of inflation risks.
However, if we look deeper into the data, we can also notice other underlying factors. For one, the employment component is back into expansion territory, recording a +0.8 reading. This suggests a clear shift following previous contractions and therefore points to localized strength in the labor markets. This is therefore a welcome sign, especially since the national manufacturing employment data has been soft. This therefore suggests that the region is recovering much faster than the national average. On the other hand, the new orders component eased, which suggests that although the current data is robust, the forward-looking data is slowing. This therefore suggests that the manufacturing plants are working off existing backlogs and therefore raises concerns over the sustainability of the current data.
In this context, we believe Illinois Tool Works Inc. (ITW) represents an undervalued opportunity based on its positioning within the current industrial cycle. The company’s focus on specialized industrial equipment, as well as its ability to maintain pricing power and efficiency, enables the company to manage rising costs. Additionally, the company’s diversified exposure across the automotive, construction, and industrial end markets provides stability as these markets experience differing levels of end-market demand. As manufacturers continue to focus on improving productivity and managing costs, companies like Illinois Tool Works, which offer high-margin efficiency-based solutions, have the potential to benefit. Analysts should focus on new order trends, pricing power sustainability, as well as margin guidance, as well as broader shipment trends, as a means of determining if the current output trends have the ability to sustain earnings growth.
Jobless Claims Reflect Strength in Labor Market, Yet Also Underlying Cracks in Hiring Cycle
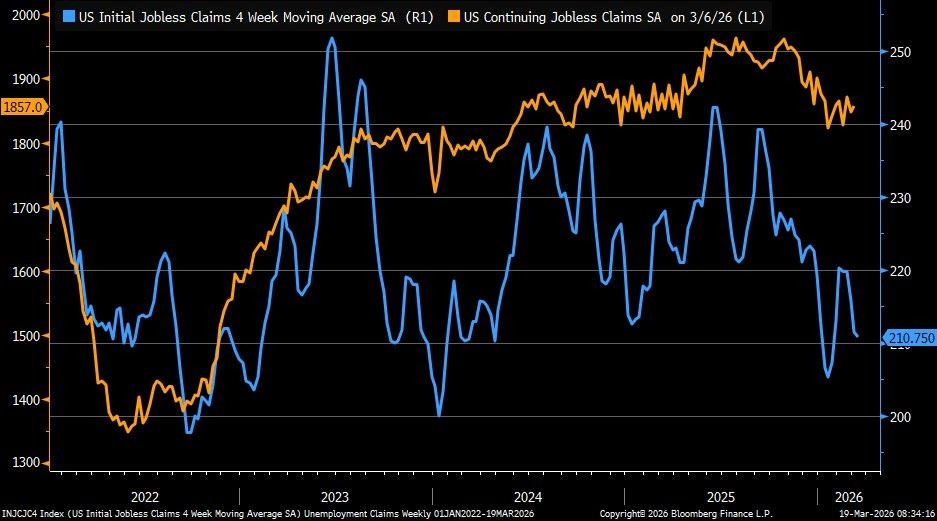
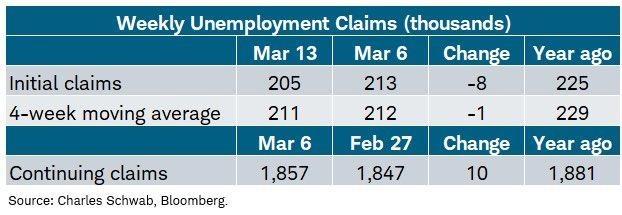
The latest labor market data indicates a mixed bag, reflecting underlying conditions in the US economy. Initial jobless claims fell to 205,000 for the week ending March 13, 2026, beating expectations and the prior week’s figure. This indicates the labor market continues to hold firm, with layoffs remaining under control. The four-week moving average continues to hover near historically low levels, suggesting companies are not yet cutting jobs. The current levels of initial jobless claims support the argument that the underlying pace of economic activity has not weakened significantly, thus removing pressure on policymakers to ease monetary conditions.
However, if we dig a little deeper, we notice some underlying cracks in the hiring cycle. The continuing claims rose to 1.857 million, beating expectations and signaling a rise in the number of individuals taking longer to find new jobs. This is historically seen as an underlying sign of slowing hiring, as seen in the initial claims. In simple terms, companies may not be cutting jobs, but they are becoming increasingly selective in hiring, thus leading to a gradual rise in continuing claims. This is a critical sign, as this type of underlying shift tends to precede a weakening labor market by several quarters
Regional data further adds to this uneven picture, as claims increase in states such as Kentucky, Oklahoma, and Arkansas, while significant labor markets such as California, Missouri, and New York exhibit substantial decreases. All of this further points to a fragmented recovery in which certain areas are seeing stress, while others are more stable. In such a backdrop, we believe Automatic Data Processing Inc. (ADP) is a stock that is undervalued. As a payroll processing and workforce management solutions leader, they are able to leverage a stable employment environment and a strengthening need for efficiency in labor cost management. Analysts should keep a close eye on wage growth rates, hiring rates, and corporate guidance on workforce management, as these will be key in determining whether current resiliency gives way to a general slowdown or a balanced labor market growth pattern.
Expectations of Policy Direction Change, Rate Hike Probability Increases
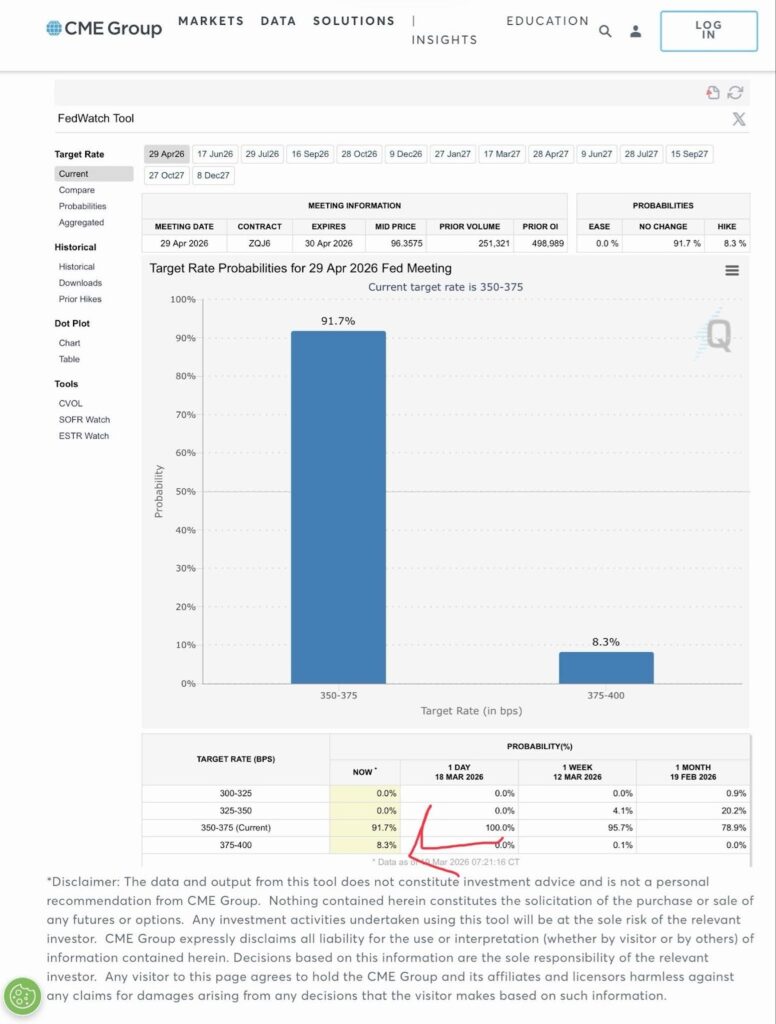
Expectations of the direction of the Fed’s policy have shifted, with the probability of a rate hike at the April 2026 meeting rising to 8.3% from close to zero just a day prior. Although the base case remains the same, with the Fed maintaining the status quo on the prevailing interest rates, the pace at which the markets have repriced the interest rates shows the extent of the shift in the market’s psychology. The markets have started to realize the reality of the stronger economic conditions than previously thought, which has led to the decline in the chances of a Fed rate cut. Financial conditions are becoming increasingly tight, not just because of the Fed, but also due to the market’s expectations, which have a direct influence on the interest rates. The main driver of the repricing of the interest rates has been the stronger manufacturing data, particularly the latest surge in the regional manufacturing data, which shows increasing output coupled with rising costs. Such conditions are more aligned with the environment of a sustained inflation, where the economy continues to grow but inflation remains a problem. Such conditions are testing times for the Fed, as policymakers have to balance the stable economic conditions with the risk of sustained inflation. The increase in the prices paid data from the manufacturing sector shows the reality of the situation, where inflationary pressures are far from being contained.
In this context, we believe that BlackRock Inc. (BLK) is a stock that is undervalued in a higher-for-longer rate environment. The company, being a global asset management firm, will be able to reap the benefits of a higher rate environment. In a higher rate environment, bond yields tend to increase. In such a situation, more and more income will be generated in the bond markets. Moreover, in a volatile rate environment, more and more investors will opt for active management. In such a situation, asset management companies will be able to reap the benefits. In a market that is adjusting to a higher-for-longer rate environment, we believe that asset management companies will be able to reap the benefits.
Housing Wealth Shift Indicates Structural Imbalance and Generational Divide
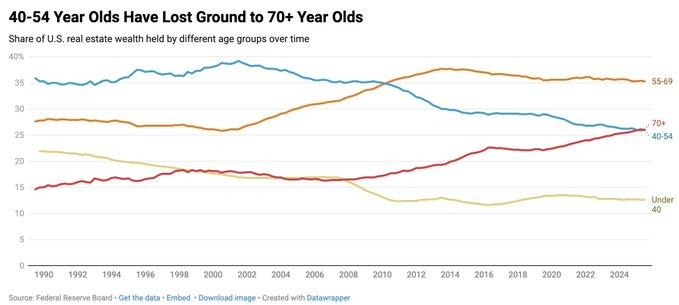
Recent data from the Federal Reserve indicates a significant change in the distribution of real estate wealth in the United States, as the 70+ age group is now holding 26% of total housing wealth, surpassing the 40–54 age group, which is holding 25%, a first in recorded history. The significant change in the distribution of wealth is a function of the long-run impact of asset appreciation, as the older generation, which entered the housing market decades ago at significantly lower prices, has benefited significantly from sustained inflation in housing prices. The middle-aged population is being adversely affected due to higher housing costs, higher mortgage rates, and a decline in credit availability, limiting their capacity to build comparable levels of housing wealth despite being in their peak income years.
This is not a cyclical change but a reflection of the deeper structural imbalance in the housing market, as the lack of supply due to restrictive land-use regulations and a decline in housing construction is keeping prices higher and limiting the capacity of new entrants to the housing market. The demographic changes in the population, such as a higher aging population and a longer life expectancy, are further contributing to the imbalance in wealth distribution in the housing market, as the feedback loop of sustained wealth appreciation for the existing homeowner population is limiting the capacity of new entrants to the housing market.
In such a context, we propose that Zillow Group Inc. (ZG) is a stock that is undervalued in light of its strategic positioning in a housing market that is constrained. As a digital real estate platform, the firm is well-positioned to capitalize on a housing market that is increasingly demanding greater levels of transparency, pricing intelligence, and transaction efficiency. In a housing transaction environment in which affordability is a key concern, we propose that analysts should keep a close eye on housing transaction volumes, user engagement, and user monetization. In a housing transaction environment in which access and information are increasingly key factors, we propose that platforms that can help facilitate greater decision-making are likely to be a key area for value capture.
Mortgage Demand Slows as Rate Spike Affects Housing Market
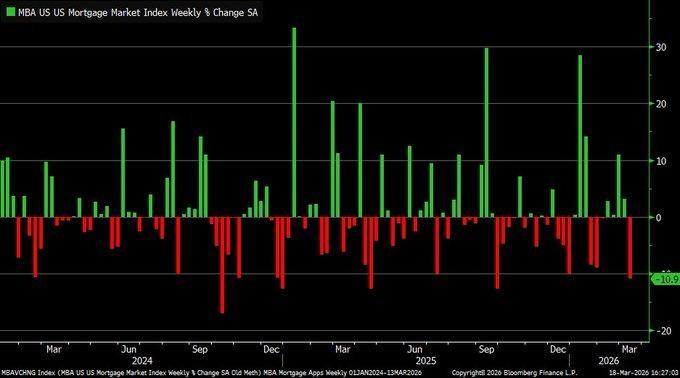
According to the latest housing data, mortgage applications have recorded the steepest decline since September 2025, dipping 10.9% during the week ending March 13, 2026. The data shows a decline in mortgage applications, reversing the previous uptrend. Additionally, the data shows that the 30-year mortgage rates have spiked to 6.72%, the highest recorded this year. Although the mortgage applications have recorded a 37.5% increase during the year, the latest decline shows the housing market momentum remains sensitive to the mortgage rates. The latest data shows the housing market remains vulnerable as the mortgage rates continue to influence the housing market. The data shows the housing market has entered a period of decline, as the mortgage rates continue to remain high. The high mortgage rates have affected the housing market, as the rates have reduced the purchasing power of the buyers.
The data shows the housing market remains vulnerable, as the mortgage rates continue to influence the housing market. The housing market has recorded volatility in the mortgage applications since 2024, as the rates have affected the housing market. The data shows the housing market has entered a period of decline, as the mortgage rates have affected the housing market. The data shows the housing market remains vulnerable, as the mortgage rates continue to influence the housing market. The housing market has recorded volatility in the mortgage applications since 2024, as the rates have affected the housing market. The data shows the housing market has entered a period of decline, as the mortgage rates have affected the housing market.
Under this context, we believe that Lowe’s Companies Inc. (LOW) is undervalued despite near-term housing challenges. Although home purchase activity could slow down, rising interest rates are also likely to extend homeowner tenure, thus driving renovation, maintenance, and improvement activities. Lowe’s benefits from this trend because existing homeowners are more likely to spend on upgrading existing homes rather than purchasing new homes. Analysts should track mortgage rate direction, housing turnover, and same-store sales performance, as well as home improvement spending, to understand how demand is shifting. In this constrained housing market, companies that benefit from renovation and maintenance demand rather than new home sales are more likely to perform well.
Rate Pause Holds as Policy Balances Inflation Risks and Growth Stability
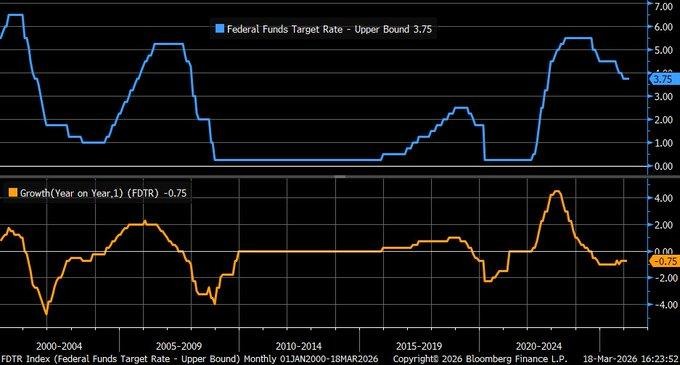
The latest policy decision indicates that the federal funds target range remains unchanged at 3.50% – 3.75%, thus extending the current pause following an aggressive tightening cycle in pursuit of inflation control. The decision reflects a critical balancing act between keeping inflation under check and preventing undue pressure on economic growth. The year-over-year change in policy rates is now negative, implying that not only has the rate hike cycle been paused but also normalized. As this trend continues to zero, it reflects that the most stressful part of policy may be behind us, notwithstanding that rates are high in absolute numbers.
Furthermore, forward projections suggest that the policy is set for a cautious recovery, as indicated by projections of one to two modest rate cuts later in 2026. This reflects that policy makers are not fully convinced that inflation risks are off the table, but they are starting to recognize the need for economic support should conditions deteriorate. The current position maintains the status of a ‘higher-for-longer but not tightening-further’ environment, where rates remain restrictive but stable. Such stability, while offering visibility, also means that sectors sensitive to rates remain capped from rising higher. Analysts must keep a close eye on inflation rates, wage growth, and consumption patterns, as these factors will dictate when the easing process begins or if it gets pushed even further.
In this context, we have identified JPMorgan Chase & Co. (JPM) as an undervalued stock, as it has the ability to thrive in the stable but higher rates environment. On one hand, the higher rates help the bank maintain net interest income, while the stable rates environment minimizes the risk of any credit risk buildups. The bank’s diversified revenue base across lending, investment banking, and asset management makes it more immune to the transition from a restrictive to a normalized environment. In a rates environment where stability rather than rapid movement defines the space, financial institutions with strong balance sheets and pricing powers are best positioned to maintain earnings growth and deliver long-term value.
Core Producer Inflation Reaccelerates and Challenges Disinflation Narrative
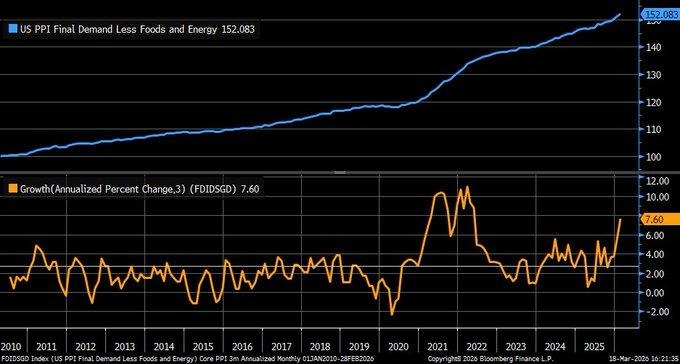
The latest inflation figures suggest that inflationary pressures are rising at the underlying level, as indicated by the three-month annualized core producer price index rising substantially to 7.6% for February 2026. This is well above the month-over-month rise of 0.5% and the year-over-year rise of 3.9%, suggesting that inflation at the producer level is not only sticky but also reaccelerating in the short term. As this measure does not include food and energy, which are volatile components, this trend points to more fundamental and structural issues in the economy. This also points to the possibility that the recent narrative of easing inflation could be challenged, as producer inflation remains high and could eventually filter into consumer inflation.
The implications for the markets are substantial, especially with reference to interest rate expectations. Producer price pressures, in turn, may result in higher consumer prices with a lag, thus requiring policymakers to extend restrictive monetary conditions for longer than expected. This runs counter to current market expectations, which have been pricing in a potential normalization of monetary conditions. The current scenario, therefore, poses risks of potential repricing across markets. In case bond yields were to rise in response to persistent inflation pressures, there could be potential pressure on equity markets, especially stocks with high reliance on earnings.
In this context, we believe Procter & Gamble Co. (PG) is undervalued, considering its pricing power and ability to manage cost-driven inflation. The company operates in essential consumer businesses, and this provides stability in demand, thus enabling the company to pass on cost pressures without suffering significant volume declines. The company’s global presence, brand strength, and supply chain efficiency provide a competitive advantage in managing prices during periods of increasing producer prices. Analysts should focus on pricing actions, volume trends, and margins, as well as trends in input costs, to evaluate the company’s success in maintaining profitability. In an environment where inflation pressures are resurfacing, companies with strong demand and cost pass-through capabilities will likely outperform.
Factory Orders Stabilize as Growth Holds but Momentum Softens
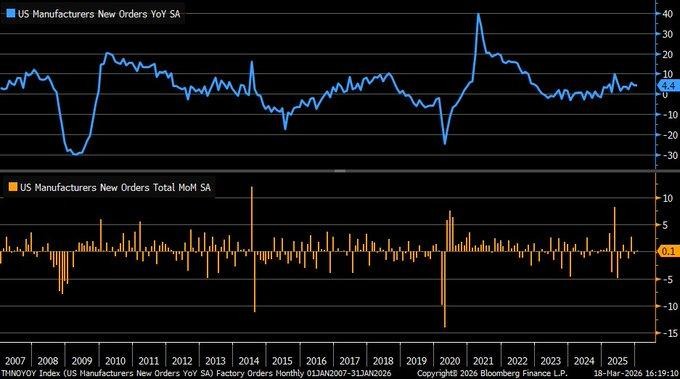
Factory orders for January 2026 increased slightly by 0.1%, or $620.1 billion, on a month-over-month basis. This is a stabilization in factory demand, which declined in December. It is a positive signal that, although factory demand is increasing slowly, it is doing so in a balanced manner. There is no evidence of a sharp increase or decrease in factory demand. On a year-over-year basis, factory demand is increasing strongly by 4.4%, indicating that economic activity is still strong. The bigger picture is that economic activity is slowing down in a controlled manner. There is no evidence to suggest a sharp downturn in economic activity. Companies are managing their inventories well. They are not overproducing, and they are producing enough to meet demand. Companies are still concerned about interest rates, costs, and supply. The current level of factory demand is positive for economic growth. It is a positive signal for companies to keep producing. However, the fact that factory demand is not increasing sharply is a negative signal for companies. It is a negative signal that companies are not confident about a sharp increase in demand in the coming months. Analysts should keep a close eye on durable goods, inventory to sales ratios, and capital expenditures. These are key indicators of whether demand is increasing or decreasing in the coming months.
In this context of operation, we have identified Caterpillar Inc. (CAT) as undervalued as it is benefiting from its position in long-cycle industrial markets and infrastructure spend. The company is benefiting from its stable order pipeline that is linked to the construction, energy, and mining sectors. These sectors tend to remain active even during periods of moderated growth. Analysts need to focus on order backlog trends, dealer inventory levels, and capital spend indicators in key end markets. The companies that benefit in a soft landing scenario where growth is sustained but at a lower rate have scope to continue to grow their earnings and attract investor interest.
Upcoming Economic Events
Quiet Calendar Keeps Focus on Next Week’s Data Catalysts
As we continue through this relatively quiet period in the economic calendar, we recognize that markets are essentially being given a temporary reprieve from data-driven volatility. This is an environment in which market direction is likely being driven by expectations, as opposed to any new information being reported. This means that investors are essentially looking to position themselves based on what is likely to be reported in the coming days, as opposed to what has been reported in recent days.
The main thing to recognize with this relatively quiet period in the economic calendar is that market direction is likely being driven by the various narratives that have been in place for some time, such as inflation, interest rates, and overall economic health. This means that markets are essentially being driven within relatively narrow ranges as investors look to position themselves for upcoming data releases, as opposed to being driven by new information being reported in recent days.
From our perspective, we believe that this is an environment in which investors should be looking to position themselves for the upcoming week, as we expect to see a significant number of high-impact economic data points being reported, which will help to give investors a better sense of direction in the coming days. In our opinion, Microsoft Corporation (MSFT) is still an undervalued stock in this environment, given the strength in cash flow, as well as the diversity in revenue generation and artificial intelligence infrastructure. As investors look to position themselves for upcoming weeks, we believe that analysts should be looking to understand forward trends in analyst guidance, capital allocation, as well as demand indicators, as these will be key drivers once we begin to see new data being reported in the coming weeks.
Stock Market Performance
Indexes Rebound from April Lows, But Weak Breadth Signals Fragile Structure
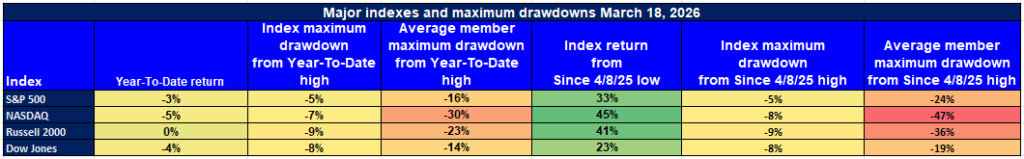
Equity markets have staged a notable recovery from the April 8th lows, yet year-to-date performance remains negative across most major indexes, highlighting an uneven and fragile market structure. While headline returns since the April bottom appear strong, deeper analysis shows that the average stock continues to underperform significantly, indicating that gains are concentrated in a narrow group of names rather than broad-based participation. This divergence between index strength and internal weakness suggests that volatility remains embedded beneath the surface.
Here’s our breakdown of the latest performance across key indexes:
S&P 500: Strong Rebound, But Participation Remains Narrow
YTD: -3% | +33% since April low | -5% from YTD high | Avg. member: -16%
The S&P 500 has rebounded 33% from its April low, showing strong headline recovery. However, it remains down 3% year-to-date, with a 5% drawdown from its peak. The average member drawdown of 16% highlights weak participation, suggesting that gains are still concentrated in a limited number of large-cap names rather than the broader market.
NASDAQ: Sharp Recovery Masking Deep Underlying Losses
YTD: -5% | +45% since April low | -7% from YTD high | Avg. member: -30%
The NASDAQ leads in recovery terms, surging 45% from the April low. Despite this, it remains down 5% year-to-date, with a 7% pullback from its highs. The average member drawdown of 30% signals significant internal weakness, reinforcing that the recovery is heavily skewed toward a small group of dominant growth stocks.
Russell 2000: Flat Performance Reflects Weak Small-Cap Confidence
YTD: 0% | +41% since April low | -9% from YTD high | Avg. member: -23%
The Russell 2000 shows a 41% rebound from April lows but remains flat year-to-date, indicating a lack of sustained conviction in small-cap equities. A 9% drawdown from highs and a 23% average member decline reflect ongoing pressure in economically sensitive and less liquid segments of the market.
Dow Jones: Modest Recovery with Relative Stability
YTD: -4% | +23% since April low | -8% from YTD high | Avg. member: -14%
The Dow Jones has recovered 23% from its April low but remains down 4% year-to-date. With an 8% drawdown from its highs and a comparatively smaller 14% average member decline, the index reflects relative stability due to its defensive composition, though underlying weakness is still present.
We at Zaye Capital Markets remain cautious on the current market structure. While index-level recoveries appear strong, weak breadth and significant average stock drawdowns signal that the rally lacks depth. We continue to favor high-quality companies with strong balance sheets and consistent earnings visibility, while closely monitoring participation metrics for confirmation of a more sustainable and broad-based recovery.
The Strongest Sector In All These Indices
Energy Leads the Market as Defensive and Cyclical Gaps Widen
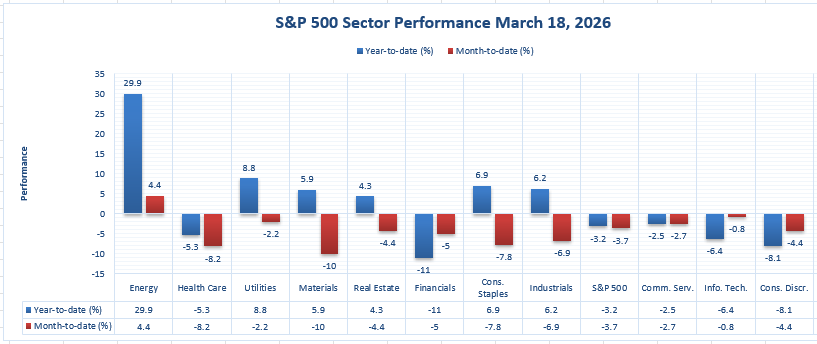
The latest sector performance data shows a clear leadership trend across the market, with Energy standing far ahead of every other group on both a year-to-date and month-to-date basis. This makes Energy the strongest sector in the current market structure, supported by a 29.9% year-to-date gain and a 4.4% month-to-date rise. No other sector comes close to that level of outperformance. The gap is especially notable when compared with the broader S&P 500, which is down 3.2% year-to-date and down 3.7% month-to-date, reinforcing how narrow leadership has become beneath the index level.
From our perspective at Zaye Capital Markets, the chart points to a market where strength is highly concentrated rather than broadly distributed. After Energy, the next-best year-to-date performers are Utilities at 8.8%, Consumer Staples at 6.9%, Industrials at 6.2%, Materials at 5.9%, and Real Estate at 4.3%. However, each of these sectors posted negative month-to-date readings, with Utilities at -2.2%, Consumer Staples at -7.8%, Industrials at -6.9%, Materials at -10.0%, and Real Estate at -4.4%. That divergence matters because it shows that even sectors with positive year-to-date returns have recently lost momentum, while Energy has remained positive across both timeframes.
The weaker side of the chart further strengthens that conclusion. Financials are down 11.0% year-to-date and 5.0% month-to-date, making them the weakest sector on a year-to-date basis. Consumer Discretionary is down 8.1% year-to-date and 4.4% month-to-date, while Information Technology is down 6.4% year-to-date and 0.8% month-to-date. Health Care is down 5.3% year-to-date and 8.2% month-to-date, and Communication Services is down 2.5% year-to-date and 2.7% month-to-date. In short, Energy is not just leading — it is separating itself decisively from the rest of the market. We at Zaye Capital Markets see this as a sign that investors are still rewarding sectors with immediate earnings leverage and pricing support, while showing far less conviction in the broader equity landscape.
Earnings
Yesterday’s Earnings – March 19, 2026
- Alibaba Group Holding Limited (BABA) reported revenue of 284.84 billion CNY (approximately $40.72 billion USD), slightly missing expectations, while GAAP EPS came in at 7.09 CNY, significantly below forecasts. Net income stood at around 17.12 billion CNY attributable to ordinary shareholders. The results highlight stable but slowing demand, with pressure coming from the broader economic environment. The key focus remains on margin recovery, cloud segment performance, and whether consumption trends can reaccelerate in the coming quarters.
- Accenture plc (CAN) reported revenues of $18.04 billion, up 8% in USD, with operating margin expanding to 13.8%. Diluted EPS came in at $2.93, beating estimates, while new bookings reached a record $22.1 billion. Free cash flow totaled $3.7 billion, with $2.7 billion returned to shareholders. The strength in bookings reflects continued demand for digital transformation, but the key factor to watch is how efficiently these bookings convert into revenue amid cautious client spending.
- FedEx Corporation (FDX) reported revenue of $24.0 billion, with GAAP operating income of $1.35 billion and net income of $1.06 billion. Diluted EPS came in at $4.41, with adjusted EPS at $5.25, beating expectations. The results were supported by cost efficiency and operational improvements. The main focus going forward is margin sustainability and demand trends across global shipping routes as economic conditions remain uneven.
- Darden Restaurants, Inc. (DRI) reported total sales of $3.35 billion, with diluted EPS at $2.95 and net earnings of approximately $341.2 million. Same-restaurant sales increased by 4.2%, reflecting continued consumer demand. The key factor remains the balance between pricing power and customer traffic, as higher prices must be sustained without reducing volume.
Today’s Earnings – March 20, 2026
- XPeng Inc. (XPEV) will be closely watched for delivery growth, margin trajectory, and progress toward profitability. Investors should focus on vehicle pricing, production efficiency, and competitive positioning within the electric vehicle market, particularly as pricing pressure remains a key challenge.
- Ermenegildo Zegna N.V. (ZGN) will provide insight into global luxury demand, with particular attention on regional performance, especially in Asia. The key factors include revenue growth, brand strength, and the ability to maintain pricing power amid shifting consumer sentiment.
- New Found Gold Corp. (NFGC) earnings will center on exploration progress and resource expansion updates. Investors should monitor operational developments, cost structure, and project advancement, as these directly impact long-term valuation in the resource sector.
- 111, Inc. (YI) will offer signals on healthcare distribution demand and operational efficiency. The focus should remain on revenue quality, margin trends, and scalability, as the company operates in a competitive and cost-sensitive healthcare supply environment.
Stock Market Overview – Friday, 20 Mar 2026
U.S. equity markets are trading with a cautious tone as investors reassess the path of interest rates following stronger-than-expected economic data and renewed inflation signals. The shift in rate expectations, combined with persistent geopolitical tensions in energy markets, is keeping risk appetite restrained. While headline indices remain relatively stable, underlying sentiment reflects hesitation, particularly in rate-sensitive and high-valuation segments. At Zaye Capital Markets, we see markets transitioning into a recalibration phase where positioning is increasingly driven by policy expectations rather than momentum alone.
Stock Prices
Economic Indicators and Geopolitical Developments
Today’s market tone is being shaped by resilient economic data and rising inflation concerns. Strong manufacturing readings and elevated producer prices are reinforcing the view that inflation remains embedded, reducing the likelihood of near-term rate cuts. At the same time, ongoing geopolitical tensions tied to energy supply disruptions continue to support elevated oil prices. This combination is pushing yields higher and tightening financial conditions, weighing on equity valuations—especially in growth-heavy sectors.
Latest Stock News
- $NVDA | Nvidia remains at the center of market focus, being added to a “2026 best idea list” while receiving multiple analyst upgrades and a raised price target to $323. The company continues to be highlighted for its strong competitive advantage in AI chips and dominant positioning in the artificial intelligence ecosystem. Despite a broader tech pullback that pushed the stock down around 1%, sentiment remains supported by expectations of massive future demand and projected large-scale AI infrastructure orders.
- $MSFT $GOOGL $AMZN $META | Major hyperscale technology companies remain in focus as projections point to roughly $650 billion in AI-related spending in 2026. This level of investment is expected to sustain demand across the AI supply chain, particularly semiconductors and cloud infrastructure, though concerns are emerging around return on investment and margin pressure.
- $AAPL | Apple continues to feature in analyst discussions, with focus on its ability to maintain resilience amid softer consumer demand trends and broader valuation pressure across mega-cap technology.
- $TSLA | Tesla remains under scrutiny as pricing strategies, competitive intensity, and demand stability in the electric vehicle market continue to weigh on investor sentiment.
- $PLTR | Palantir is gaining attention for its positioning in the AI and data analytics space, with continued focus on its ability to capture enterprise demand for data-driven solutions.
- $MU | Micron reported strong earnings supported by AI-driven memory demand, but the stock faced pressure due to elevated capital expenditure and ongoing supply constraints, highlighting structural bottlenecks in the AI ecosystem.
The Magnificent Seven and the S&P 500
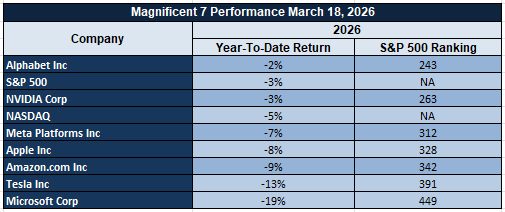
The “Magnificent Seven” — Apple, Microsoft, Nvidia, Amazon, Meta, Alphabet, and Tesla — are currently facing renewed selling pressure, acting as a drag on both the S&P 500 and Nasdaq. While Nvidia continues to benefit from AI-driven optimism, the broader group is being repriced as higher interest rate expectations reduce the value of future earnings. The scale of planned AI spending is also raising concerns about profitability timelines. Given their heavy index weighting, weakness in this group is masking broader market softness and reinforcing narrow leadership concerns.
Major Index Performance as of Friday, 20 Mar 2026
- Nasdaq Composite: Trading at 22,090.69, down 0.3%, as mega-cap technology stocks remain under pressure
- S&P 500: Trading at 6,606.49, down 0.3%, with weakness driven by inflation concerns and rate expectations
- Russell 2000: Trading at 2,494.71, up 0.6%, showing relative strength in small-cap equities
- Dow Jones Industrial Average: Trading at 46,021.43, down 0.4%, reflecting pressure on large-cap industrials
At Zaye Capital Markets, we maintain a selective stance. AI-driven optimism, rising capital expenditure, and higher interest rate expectations are creating both opportunity and risk. We continue to favor companies with strong balance sheets, clear earnings visibility, and structural demand drivers, while closely monitoring valuation compression and market breadth for confirmation of a more sustainable trend.
Gold Price: What Is Driving Gold Prices Higher Amid War Risk and Inflation Pressure?
Spot gold (XAUUSD) is currently trading at $4,722.87 per ounce, up +1.55%, holding firmly near elevated levels as markets absorb a combination of geopolitical escalation and persistent inflation signals. The latest wave of official comments around military operations, threats to critical energy infrastructure, and direct warnings tied to potential retaliation has intensified global uncertainty. This type of environment typically drives capital into safe-haven assets, and gold is responding accordingly. At the same time, acknowledgment that oil prices have risen due to conflict reinforces inflation expectations across the system, particularly through energy-driven cost pressures. With no meaningful economic data scheduled today, market direction is being dictated by positioning and sentiment rather than fresh inputs, which is currently skewed toward risk aversion and capital preservation—conditions that continue to support gold at elevated levels.
At the same time, yesterday’s economic data is playing a reinforcing role in shaping the current price structure. Strong manufacturing activity combined with a surge in producer-level inflation signals that cost pressures remain embedded within the economy, increasing the likelihood that inflation persists longer than previously expected. This dynamic supports gold by keeping real yields constrained, even as interest rates remain elevated. However, the same data also reduces expectations for near-term policy easing, introducing a counterforce that can limit aggressive upside. The result is a market caught between inflation support and rate pressure, where gold remains structurally bid but sensitive to shifts in policy expectations. At Zaye Capital Markets, we interpret this as a high-tension environment where geopolitical risk and inflation dynamics are providing a firm foundation for gold, while interest rate expectations act as a moderating force, creating a sustained but volatile upward trend that investors must monitor closely for confirmation of continuation or signs of exhaustion.
Oil Prices: What Is Driving Oil Prices Volatility Amid War Risk and Demand Shifts?
WTI crude oil is currently trading at $93.54 per barrel (down ~2.10%), while Brent crude stands at $106.72 per barrel (down ~0.80%), confirming that despite elevated geopolitical tensions, oil prices are now pulling back from recent highs. This price behavior reflects a market that is no longer reacting in a straight line to conflict headlines but is instead pricing two opposing forces at the same time. On one side, ongoing military developments, direct threats to major energy infrastructure, and confirmation that oil prices have already risen due to the conflict continue to support a strong risk premium in the market. On the other side, forward-looking statements suggesting that the conflict could end soon and that oil prices may “drop like a rock” are triggering repositioning and profit-taking. This has created a split structure where prices rise on escalation fears but fall on expectations of resolution. Additional market signals indicate that while key shipping routes and facilities are under pressure, oil is still flowing through alternative channels, preventing a complete supply shock. This explains why prices are elevated but not breaking into uncontrolled upside, as the market recognizes disruption without total shutdown.
At the same time, yesterday’s economic data is reinforcing the underlying demand side of the equation, with strong manufacturing activity and rising producer prices confirming that energy consumption remains firm across industrial sectors. This provides a structural base for oil prices, even as short-term volatility persists. However, the same data also reduces expectations for near-term policy easing, which introduces a counterbalance by potentially slowing future demand growth if borrowing costs remain high. With no meaningful economic data released today, oil markets are being driven almost entirely by geopolitical developments, positioning, and expectations rather than fresh demand signals. Broader market commentary and institutional outlooks continue to emphasize that supply-side uncertainty remains the dominant force, while global organizations such as OPEC and the IEA are closely monitoring production stability and demand resilience. At Zaye Capital Markets, we interpret this as a high-volatility environment where oil prices remain supported by geopolitical risk and industrial demand, but capped by expectations of eventual normalization and tighter financial conditions, resulting in a market that is elevated, reactive, and highly sensitive to any shift in conflict narrative or macro expectations.
Bitcoin Prices: What Is Driving Bitcoin Price Movements Amid War and Rate Pressure?
Bitcoin is currently trading at $70,589, up ~0.94%, stabilizing after recent volatility that saw prices dip below $70,000 and briefly touch lows near $68,805. This price action reflects a market attempting to recover but still constrained by broader macro forces. The latest geopolitical developments—ranging from escalating conflict signals, threats to energy infrastructure, and strong military positioning—are increasing global uncertainty, but unlike traditional safe-haven assets, Bitcoin is not seeing consistent inflows during these periods. Instead, risk-off sentiment is pushing institutional capital toward more defensive assets, while crypto remains sensitive to liquidity conditions. At the same time, confirmation that oil prices have surged due to the conflict reinforces inflation concerns, but this is not translating into sustained upside for Bitcoin because inflation in the current cycle is being met with restrictive policy rather than liquidity expansion.
At the same time, yesterday’s economic data continues to weigh on Bitcoin’s broader outlook. Strong manufacturing activity and rising producer prices signal persistent inflation, which reduces expectations for near-term rate cuts and reinforces a higher-for-longer interest rate environment. This is critical because Bitcoin thrives in conditions of abundant liquidity, and tighter financial conditions limit speculative capital flows into crypto markets. This dynamic is already visible through ETF outflows exceeding $163 million and growing institutional caution, as market participants reassess risk exposure. With no major economic data released today, Bitcoin is trading primarily on positioning, macro expectations, and sentiment rather than fresh catalysts. At Zaye Capital Markets, we interpret this as a constrained environment where Bitcoin remains supported near key levels but lacks the liquidity-driven momentum required for a sustained breakout, leaving the asset highly sensitive to shifts in rate expectations, capital flows, and broader market risk appetite.
Ethereum Prices: Why Is Ethereum Price Stuck Despite ETF Flows and Whale Activity?
Ethereum is currently trading at $2,144.3, up ~0.31%, holding within a relatively tight range as markets struggle to establish strong directional momentum. This price behavior reflects a market that is supported but not yet ready to break higher, largely due to mixed institutional flows and broader macro constraints. Over the past week, ETF-related activity has shown an inconsistent pattern, with intermittent inflows providing short-term support while outflows signal hesitation among larger investors. This uneven capital movement suggests that while Ethereum continues to benefit from its position as the backbone of decentralized finance and smart contract ecosystems, institutional conviction remains cautious in a higher interest rate environment. As liquidity conditions remain tight and risk appetite selective, Ethereum is not attracting the same level of aggressive capital deployment required for a sustained rally, keeping price action controlled rather than trending.
At the same time, recent whale activity is reinforcing this constrained structure, with large holders actively accumulating during dips while distributing into strength. This behavior creates a stabilizing effect on downside movements but also introduces resistance on the upside, effectively compressing price within a defined range. The absence of strong, one-directional accumulation suggests that major participants are positioning tactically rather than building long-term exposure at current levels. This aligns with the broader macro backdrop, where yesterday’s economic data pointed to persistent inflation and reduced expectations for near-term policy easing, limiting liquidity-driven upside across risk assets. With no major economic catalysts today, Ethereum remains driven by positioning, sentiment, and capital flows rather than new demand triggers. At Zaye Capital Markets, we interpret this as a balanced but fragile environment where Ethereum’s structural value remains intact, but short-term price direction will depend heavily on shifts in ETF flows, whale positioning, and broader financial conditions, leaving the asset sensitive to both upside catalysts and downside liquidity pressure.
