Where Are Markets Today?
The U.S. and European futures are trading slightly lower and volatile to begin the week, with a defensive tone dominating global markets. The U.S. futures are trading with a slightly negative bias, with Dow futures trading -0.1%, while S&P 500 futures and Nasdaq futures are trading -0.2% each. Similarly, European futures are trading with a negative bias, reflecting global market sentiments. At Zaye Capital Markets, we note that while this is not a market panic situation, we are witnessing a volatile market environment where investors are becoming defensive in nature. The decline in futures can be attributed to increasing global tensions and surging energy prices.
The first factor to consider in this volatile market environment is the escalating tensions in the Strait of Hormuz, an important global oil shipping lane. Recent events in this region, which have threatened global energy infrastructure and shipping in this region, have increased global risk premiums. This is not a mere geopolitical event but reflects global energy security and global supply chains. Investors are becoming defensive in nature in response to these global events. European markets are witnessing a strong decline in futures and are moving towards multi-month lows.
The second important factor that is affecting the futures market is the sharp move-up in oil prices. With oil prices rising above the $100 to $110 price range, there is a growing sense of worry that there is a renewed threat of inflation that will affect the market’s expectations of easing financial conditions. This is posing a direct threat to the market because of the expectations of interest rate cuts that are being lost amidst rising bond yields. Growth-sensitive sectors, such as technology stocks, are negatively impacted by this move, which explains the pressure that is being seen in the futures market today despite the absence of fresh economic data.
In terms of the overall market structure, it is evident that the current market is part of a larger trend that is being seen in the markets. As we have seen in the recent past, the markets have been experiencing a decline for multiple weeks. What is noteworthy in the current market is that there is a lack of a safe-haven trade that is being seen in the market today. Rather than investing in bonds, there is a growing sense of cash being accumulated in the market. At Zaye Capital Markets, we believe that this is a liquidity-driven phase that is being seen in the markets today as a result of the impact of geopolitical events and changes in expectations of the overall market. The question that is being asked is whether this is a short-term blip in the market that will change the overall dynamics of the market.
Major Index Performance as of Monday, 23 March 2026
- S&P 500: The S&P 500 is currently trading within the 6,620-6,700 range and recently closed at 6,624.70. It is being pressured again by weak breadth and rising macro risks.
- Nasdaq Composite: The Nasdaq is currently trading within the 22,100-22,300 range and recently closed at 22,152.42. This represents the ongoing weakness in mega-cap technology stocks.
- Dow Jones Industrial Average: The Dow is currently trading within the 46,000-46,300 range and recently closed at 46,225.15. This represents relative stability within the market.
- Russell 2000: The Russell 2000 is currently trading within the 2,450-2,500 range and recently closed at 2,478.64. This represents the most vulnerable segment of the market due to tightening financial conditions.
The Magnificent Seven and the S&P 500
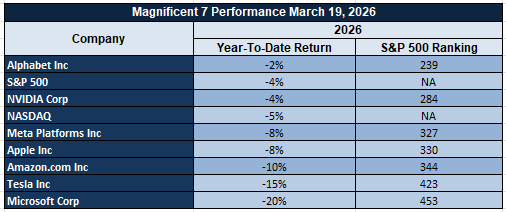
The Magnificent Seven, which include Apple, Microsoft, Nvidia, Amazon, Meta, Alphabet, and Tesla, are key to the overall index performance, but they are now under collective pressure. The recent sell-off in these names is being caused by valuation compression, profit-taking, and changes in AI-related growth expectations. The Magnificent Seven have previously contributed to a disproportionate increase in the stock market, so their current sell-off is now negatively impacting the S&P 500 and Nasdaq. At Zaye Capital Markets, we believe that this represents a transition phase rather than a collapse in fundamentals. Nevertheless, until sector participation broadens again or until earnings growth accelerates again, our reliance on this core group will continue to limit our upside potential and heighten our sensitivity to further downside risks.
Drivers Behind the Market Move – Monday, March 23, 2026
In a complex environment of escalating geopolitical tensions, energy price shocks, and changing policy expectations in the US and European economies, market sentiment has been cautious and defensive. The recent market developments in the last 24-48 hours are driving market positioning, as investors balance escalating global risks against stable but restrictive economic conditions.
1. Geopolitics and Risks in Energy Supply
Escalating geopolitical tensions in the Strait of Hormuz have been a major market mover in recent times. The recent comments on deadlines, threats to energy infrastructure, and military escalation have increased the uncertainty in global oil supply. The market has responded by pushing oil prices above the $100-$110 range, heightening global supply disruption fears in one of the most critical global energy supply routes. These market developments not only heighten inflationary pressures but also affect investor sentiment, especially in energy-related sectors. The US and European markets are reacting defensively, as capital moves away from the market in response to escalating geopolitical tensions.
2. Inflation Pressures and Interest Rate Uncertainty
This rise in energy prices is directly influencing inflation, which in turn is causing a shift in market sentiment towards the expected rate of interest. The investor, who has been expecting a relaxation in financial conditions, is now re-evaluating their expectations due to the rise in oil prices, which might cause inflation to remain high. This is causing a rise in bond yields and a cautious sentiment in the equity market, especially in those sectors which are more sensitive to rate changes. The lack of economic news today is also adding to the market sentiment, as there is a lack of economic indicators which can counteract the inflationary pressures. The market is thus being driven by expectations and broad economic indicators.
3. Policy Signals and Cautious Market Positioning
The policy signals, which include a unified national policy on artificial intelligence and geopolitical signals, are adding another dimension of complexity in market positioning. Although there are indicators which suggest that military objectives might be close to being achieved, there are also signals which suggest that threats remain. This has caused a shift in market positioning, as investors are now becoming more cautious and defensive in their approach. The lack of economic news today has meant that the market is being driven by investor sentiment, as both the U.S. and European markets remain sensitive to any new economic indicators which might cause a shift in market positioning in the coming sessions.
In conclusion, it can be said that the market sentiment today is being driven by a combination of escalating geopolitical threats, rising inflation, and cautious policy signals. The investor is being cautious in their approach, which has led to weak and unstable futures.
Digesting Economic Data
The Trump Tweets and its Implications
Recent White House communication reflects a dual-track narrative combining geopolitical escalation and domestic policy structuring, both of which are directly influencing market behavior. The release of a national AI legislative framework signals a clear push toward centralized regulation, replacing fragmented state-level approaches with a unified system. This includes safeguards around child protection, cost allocation for data infrastructure, and faster permitting for power generation tied to data centers. From a market perspective, this creates long-term clarity for technology and infrastructure investment, particularly in artificial intelligence and energy supply chains, while also raising questions about cost distribution and regulatory oversight. The broader implication is a more structured but controlled growth environment for AI-related industries, which may stabilize long-term investment but limit near-term flexibility.
At the same time, geopolitical messaging has intensified significantly, particularly around the Strait of Hormuz and the ongoing conflict involving Iran. Statements indicating that military objectives may soon be met are being offset by direct threats toward energy infrastructure and ultimatums tied to reopening critical supply routes. This has created a high-risk environment where markets are forced to price in both escalation and potential resolution simultaneously. The impact has already been visible through rising oil prices above $112 per barrel and increasing volatility across commodities and equities. The repeated emphasis on securing energy routes and the possibility of further military action reinforces a persistent geopolitical risk premium that is now embedded across global markets.
Additional policy signals, including potential deployment of security forces at airports and strong rhetoric toward international alliances, are contributing to broader uncertainty around global cooperation and internal stability. Comments directed at allied nations and ongoing tensions surrounding Middle Eastern conflict dynamics suggest a more fragmented geopolitical landscape. This is important for markets because it affects global trade flows, capital movement, and investor confidence. The combination of domestic enforcement actions and international pressure points creates an environment where risk sentiment can shift rapidly based on headlines rather than underlying economic fundamentals.
From a financial standpoint, the overall messaging has left investors preparing for potential market disruption. While there are indications of sufficient funding for ongoing military operations and no immediate plans for tax increases, the broader tone remains one of controlled escalation. At Zaye Capital Markets, we see this as a key driver behind current market conditions, where energy prices, safe-haven assets, and volatility indicators are all responding to geopolitical developments rather than traditional economic cycles. The focus on energy security and global supply stability further reinforces the importance of commodities and strategic assets in the current environment, suggesting that markets will remain highly sensitive to both policy direction and geopolitical developments in the near term.
Falling Jobless Claims Reinforce Labor Market Strength Despite Payroll Noise
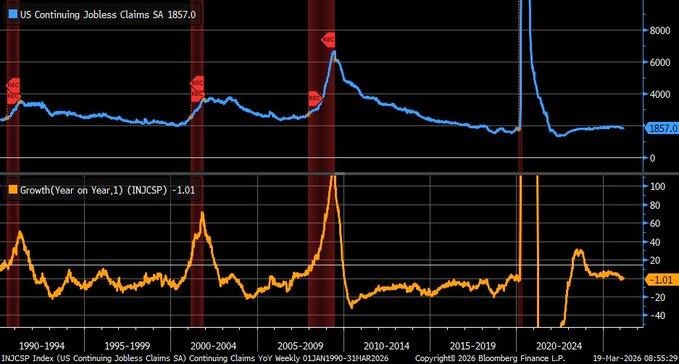
The latest data on the labor market suggests that the overall trend is stronger than the employment data may be indicating. Continuing jobless claims have fallen to 1.857 million, and the data suggests that they have contracted by 10.1% on a year-over-year basis. This suggests that people are returning to the workforce more quickly, and the overall duration of joblessness is falling. At the same time, initial jobless claims have fallen to 205,000, and they came in lower than expectations. This suggests that the labor market is not weakening, but rather that it is holding steady.
Despite recent changes to payroll data that have sparked concern over the rate of job creation within the economy, claims-based data offers a more current and accurate representation of labor conditions. The ongoing decrease in both initial and ongoing claims indicates that businesses are not aggressively reducing their workforce levels and that hiring activity remains well-balanced. This equilibrium of hiring and firing levels is particularly important to economic conditions, as it allows consumers to maintain a level of income stability and thereby promotes economic growth.
From an investment standpoint, we believe that consumer discretionary and workforce solutions-based businesses are undervalued within current labor conditions. A stable labor environment benefits consumer spending power, particularly within industries that are heavily dependent on consumer spending within retail environments and travel-related industries. Conversely, businesses that focus on improving workforce solutions and human capital management benefit from ongoing labor optimization trends. From an investment standpoint, analysts should focus on wage growth trends and labor participation rates to better understand their ability to sustain consumption-driven growth. Additionally, tracking changes to employment data and real-time claims data will be essential to better understand whether current labor conditions will be able to sustain current economic conditions.
Rising capital expenditure plans signal renewed industrial confidence
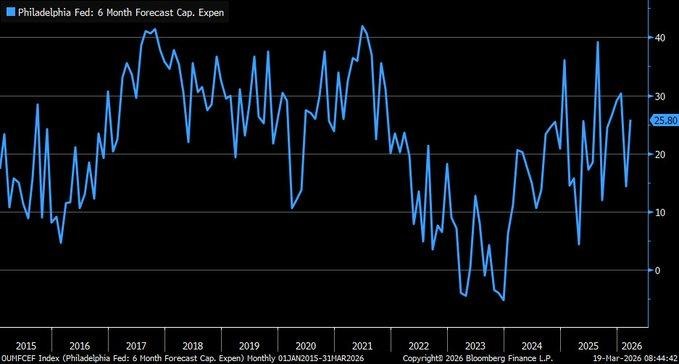
The latest manufacturing data indicates a notable shift in forward-looking investment sentiment, with the future capital expenditures index recording a sharp increase by 11 points to 25.8 in March 2026. This indicates a surge in the willingness of manufacturers to commit to capital expenditure expansion and upgrade plans, indicating confidence in forward demand visibility despite the still uncertain macro environment. At the same time, the overall manufacturing diffusion index recorded a notable surge to 18.1, beating market expectations and further emphasizing the notion that industrial activity continues to exhibit resilience.
However, if we take a closer look at the historical trend, it will become clear that although the recent pick-up is robust, it is still part of a gradual recovery rather than a full-fledged expansion cycle. In terms of the capital expenditure index, it has recovered strongly from the subdued levels seen in 2023–2024. Yet it still remains below the peaks seen in 2025. This implies that although there is a pick-up in confidence, firms still seem to be taking a measured view, weighing the opportunities against the ongoing concerns regarding financing costs and global demand conditions. The volatility seen since 2015 also emphasizes the fact that capital spending does indeed occur in phases, often influenced by changes in interest rates, input costs, and overall economic expectations.
In terms of the broader market, we at Zaye Capital Markets believe that industrial machinery, engineering solutions, and materials-focused firms are undervalued within the current market environment. This is because they will be direct beneficiaries of the increasing capital expenditure cycles. Analysts need to focus on the growth in order intake for the industrial machinery, engineering solutions, and materials industries. In addition, it will also be important to track the business investment intentions, credit conditions, and margin performance in order to get a sense of whether the early stages of the capital spending recovery will translate into a sustained earnings growth story for capital-intensive industries.
Declining Market Breadth Indicates Weak Equity Participation Behind Index Stability
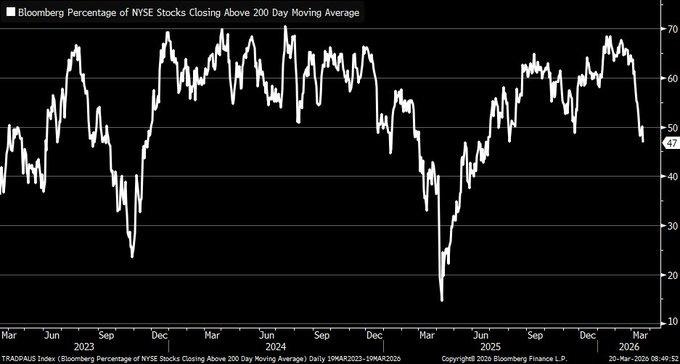
Market breadth data released for the latest period indicates a critical change in the composition of the overall market, with only 47% of NYSE stocks registering above their 200-day moving average on March 20, 2026. This is the lowest reading since mid-2025 and indicates a trend towards narrowing participation within the market. The overall market has made relatively small movements over the early part of 2026, but the underlying trend is weakening, with the majority of the gains coming from a small number of large-cap stocks.
A further interpretation of the trend suggests that there is a growing trend towards selectivity in the market, where investors are putting their capital into companies they believe to be relatively safer and market leaders, leaving behind the small and mid-sized companies. In the past, such low breadth has often been a precursor to a market correction, as the market may not be able to sustain the upward momentum when there is less participation. In addition, when fewer stocks propel the market, the market may be more vulnerable to the impact of the decline in the market leaders. Therefore, the market may be vulnerable to a shift in sentiment, especially if there is a deterioration in the macro environment and earnings growth.
In terms of investment, we believe that there are some selective buying opportunities in the oversold small and mid-sized industrial, materials, and cyclical companies, which we believe are relatively undervalued based on the trend towards selectivity. These companies have been relatively neglected in the market, despite their improving fundamentals, and we believe they could be good entry points for investors, especially when the market normalizes. It is crucial for market analysts to keep an eye on the market breadth, earnings growth, and capital rotation trends, as they could be indicative of whether the market is moving towards a further rally or a correction. In addition, market analysts should keep an eye on the market’s liquidity and sector rotation trends to gauge the sustainability of the current index levels.
Upcoming Economic Events
As we begin the week, the market conditions seem to be relatively calm, and there are no major market drivers influencing the market. This is often a pause rather than a resolution, and we believe that the market players are holding their positions and waiting for major market drivers to emerge during the course of the week. During such periods, the market is expected to be relatively technical and sentiment-driven, and the overall market players seem to be less convinced about the market direction.
As we look at the market from a strategic perspective, we believe that the early weeks of the market should not be seen as a period of stability. Rather, we believe that the market is in a state of transition and often uses such periods to prepare for upcoming market drivers. During such periods, the market trends tend to form, and we believe that patience and preparation are more critical during such periods.
At Zaye Capital Markets, we believe that the market players should be focused on the latter part of the week, where we believe that major market drivers will emerge and redefine the market direction. The analysts should be focused on the market sentiment, market sector patterns, and overall market risks, as we believe that the market trends often begin to form during such periods.
Stock Market Performance
Indexes Rebound from April Lows, But Weak Participation Indicates Caution
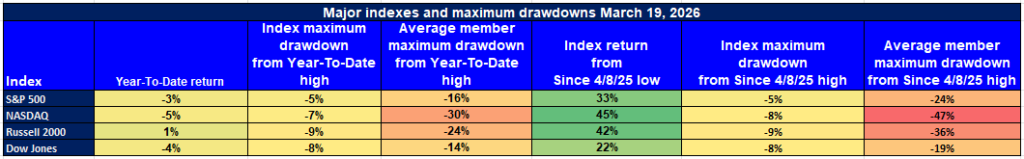
In our analysis of the stock market at Zaye Capital Markets, we have seen that while the major stock market indexes have registered a strong bounce back from the lows of April 8, 2025, underlying participation remains low. The difference between index-level performance and underlying member drawdowns remains a concern as it indicates a weak market structure. While the indexes have registered good gains, underlying weakness remains as participation remains low.
Here is our analysis of the recent performance of the major stock market indexes:
S&P 500: Strong Rebound, but Narrow Participation Remains a Concern
YTD: -3% | +33% off April low | -5% from YTD high | Avg. member: -16% (YTD high) / -24% (since April low)
The S&P 500 index has registered a strong bounce back of 33% from its low of April 8, 2025, but still remains down 3% year-to-date. While it has registered a relatively small 5% drawdown from its high, underlying member stocks are down more than the index itself.
NASDAQ: Powerful Rebound but Underlying Stocks Remain in Deep Trouble
YTD: -5% | +45% off April low | -7% from YTD high | Avg. member: -30% (YTD high) / -47% (since April low)
The NASDAQ index has registered the strongest bounce back of 45% from its low of April 8, 2025, but still remains down 5% year-to-date. While it has registered a relatively small 5% drawdown from its high, underlying member stocks are down more than the index itself by 47%.
Russell 2000: Moderate Gains with a Resurgent Rally
YTD: +1% | +42% off April low | -9% from YTD high | Avg. member: -24% (YTD high) / -36% (since April low)
The Russell 2000 index shows a resurgent rally of 42% from April lows. However, the index is only up 1% year-to-date. The 9% drawdown from the YTD high, along with the average member losses, indicates that the market pressures remain. This shows that the confidence level in the small-cap space is still low.
Dow Jones: Defensive Gains with Limited Upside Potential
YTD: -4% | +22% off April low | -8% from YTD high | Avg. member: -14% (YTD high) / -19% (since April low)
The Dow Jones index has gained 22% from the April low. However, the index is still down 4% year-to-date. Dow Jones’ average member drawdowns have been lower than the Russell 2000. This shows the defensive nature of the Dow Jones. However, the lack of upside momentum shows the lack of confidence in the traditional value sectors.
We at Zaye Capital Markets remain cautious about the markets. While the resurgent rally of the indexes is a positive sign, the diverging trend between the indexes and the average member stocks shows that the uptrend is still a work in progress. Analysts need to be on the lookout for the broader market’s ability to sustain the uptrend.
The Strongest Sector In All These Indices
Energy Leads the Market by a Wide Margin While Most Sectors Stay Under Pressure
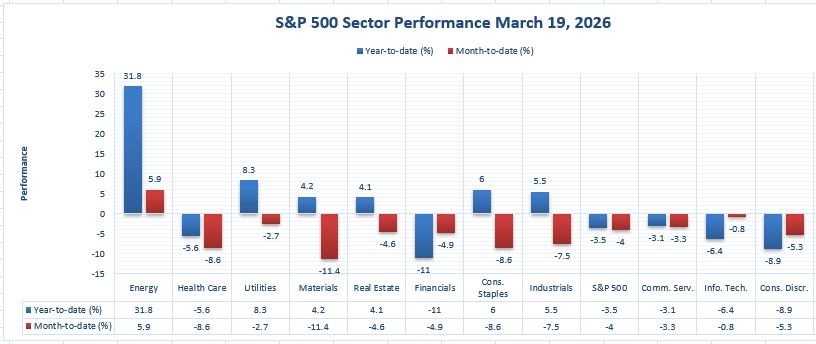
We at Zaye Capital Markets have identified Energy as the strongest sector of the market, according to the latest figures from the chart above. Energy is currently leading the pack with a year-to-date gain of 31.8%. Moreover, it also gained 5.9% month-to-date. It is the only sector that is currently showing a strong year-to-date gain and a strong month-to-date continuation. This is a significant margin compared to the rest of the sectors.
Energy is currently leading the pack, and the gap from the second-best sector, Utilities, is substantial. Utilities is currently gaining 8.3% year-to-date. Consumer Staples is currently gaining 6.0%, Industrials is currently gaining 5.5%, Materials is currently gaining 4.2%, and Real Estate is currently gaining 4.1%. Even though these sectors have strong year-to-date gains, they have weak month-to-date figures. Utilities is currently losing 2.7%, Consumer Staples is currently losing 8.6%, Industrials is currently losing 7.5%, Materials is currently losing 11.4%, and Real Estate is currently losing 4.6%.
The overall market is still weak. The S&P 500 is currently losing 3.5% year-to-date. It is also losing 4.0% month-to-date. Financials are currently losing 11.0% year-to-date. It is also losing 4.9% month-to-date. Information Technology is currently losing 6.4% year-to-date. It is also losing 0.8% month-to-date. Consumer Discretionary is currently losing 8.9% year-to-date. It is also losing 5.3% month-to-date. Health Care is currently losing 5.6% year-to-date. It is also losing 8.6% month-to-date. Communication Services is currently losing 3.1% year-to-date. It is also losing 3.3% month-to-date.
Earnings
Yesterday’s Earnings – March 20, 2026
- XPeng Inc. (XPEV): XPeng reported a significant inflection point in its latest results, reporting Q4 revenues of RMB22.25 billion, up 38.2% YoY and 9.2% QoQ, driven by a RMB19.07 billion contribution from vehicle sales, and RMB3.18 billion from services and other revenues, up 121.9% YoY. Gross margin came in at 21.3%, with a vehicle margin of 13.0%. The most impressive aspect of the results is its first net profit, at RMB0.38 billion, compared to a net loss of RMB1.33 billion in the prior year. Revenues for the full year came in at RMB76.72 billion, up 87.7% YoY, driven by deliveries of 429,445 units, up 125.9% YoY. The net loss also narrowed significantly to RMB1.14 billion from RMB5.79 billion, driven by margin expansion and improved efficiency. The results can be seen as a transition towards profitability, and analysts will have to focus on margin sustainability, delivery growth, and cost discipline.
- Ermenegildo Zegna N.V. (ZGN): Zegna reported full-year revenues of €1,916.9 million, representing a reported decline of 1.5% YoY, but an increase of 1.1% organically. The gross margin improved by 90bps to 67.5%, driven by a strong performance in its direct-to-consumer business, which now accounts for 82% of branded revenues. The profit came in at €109.5 million, up 20% YoY, while adjusted EBIT came in at €163.0 million, or €173.0 million before a provision of €10 million. The firm also reported free cash flow of €82 million, followed by a net cash position of €52 million. Despite a decline in its top line, the firm has reported a robust performance in its gross margin and profitability. Analysts will have to focus on regional demand, pricing, and its DTC business.
- New Found Gold Corp. (NFGC): The company is in an exploration stage and thus has no revenues to report. However, it continues to report losses due to project development expenses. Net losses are in the range of -CAD45 million to -CAD50 million. The company maintains a strong cash position of around CAD71.68 million. The investment thesis is completely based on drill progress, resource expansion, and project timelines.
- 111, Inc. (YI): The company reported revenues for Q3 amounting to RMB3.0 billion, a decline of -16.7% year-over-year. Gross segment profit was reported to be RMB178.0 million in Q3, a decline of -15.5% year-over-year. The company continues to report losses in its GAAP results but remains profitable in its non-GAAP results. This is an indication that the company is moving in the right direction in its transition to an asset-light model. The focus remains on improving its revenues and maintaining its profitability.
Today’s Earnings – March 23, 2026
- AbbVie Inc. (ABBV): The focus remains on diversified revenues from its major therapeutic areas and its ability to maintain stable earnings in an evolving environment. The focus remains on maintaining stable revenues in an environment where product cycles are changing.
- Broadcom Inc. (AVGO): Focus will be on demand trends in semiconductor and infrastructure segments, particularly in enterprise and data-driven technology. Investors can look at consistency in revenue growth, strength in pricing, and forward guidance to see if existing demand levels can be maintained. Margin and capital allocation will also be watched.
- Bruker Corporation (BRKR): The earnings report will offer insight into the demand for scientific equipment, as well as spending patterns related to research. Investors should focus on order growth, as well as stable margins, as a means of determining demand for the firm’s products.
- Banco De Chile (BCH): The earnings report will provide investors with an idea of the state of the financial sector, including an examination of loan growth, asset quality, as well as interest margin trends. Investors should focus on the bank’s ability to manage credit risk, as well as its ability to maintain stable returns during the current environment.
Stock Market Overview – Monday, 23 March 2026
The US stock markets are starting the week on a cautious note as investors are trying to digest mixed economic data, narrowing breadth, and continued pressure on big-cap technology names. The markets are showing mixed results, while the overall stock market appears to be stable. At Zaye Capital Markets, we view this as a tricky situation where the markets are holding up, yet there seems to be limited conviction ahead of stronger catalysts that are expected to emerge later this week.
Stock Prices
Economic Indicators and Geopolitical Developments
The overall stock market is showing mixed results today as the markets are trying to balance between stability and concern. The labor markets are showing signs of stability, which are helping to boost the overall markets. On the other hand, inflation rates are causing concern, while interest rates are uncertain. The manufacturing sector appears to be stabilizing, yet there are mixed signs of future growth. At the same time, geopolitical tensions related to energy routes are causing concern, yet the markets are showing a cautious tone.
Latest Stock News
- $NVDA – Nvidia Corp. shares are under pressure again as the stock declined by approximately 3% as investors are losing interest in the company’s shares following recent rallies related to AI. The company’s shares are showing weakness ahead of the open on March 20. On the other hand, several insider sales of the company’s shares by senior officials have put pressure on the company’s shares. Despite this, the company continues to invest heavily in developing its ecosystem through massive infrastructure investments, such as recent commitments to invest billions of dollars into data center capacity.
- $MSFT $AMZN $OpenAI | Microsoft is considering legal action against Amazon and OpenAI over a strategic collaboration deal reportedly valued at $50 billion, which involves the deployment of advanced AI systems. This strategic deal has resulted in ambiguity within the cloud computing environment, causing Microsoft’s shares to fall by approximately 1.9%, while Amazon’s shares have declined by approximately 2.5%. Despite this decline, Amazon’s long-term strategy of growing its cloud computing services and executing significant AI-related deals continues to remain strong, making it an essential part of the developing AI environment.
- $GOOGL $META $AAPL | Alphabet’s shares have declined by approximately 2% as part of the overall decline of top-tier technology companies. This decline does not, however, impact the company’s long-term strategy of developing AI capabilities and expanding its overall infrastructure. Meta Platforms is increasing competition within the AI chip environment by advancing the development of its AI chip technology. Apple’s shares are experiencing pressure within the overall environment as it integrates AI capabilities into its overall ecosystem to maintain its competitive edge.
- $TSLA | Tesla’s shares are experiencing a mixed environment, where the company’s shares are declining due to margin pressure while it expands into the energy infrastructure environment. The company’s shares are reportedly considering a deal to purchase solar equipment valued at $2.9 billion within the Chinese environment.
- $PLTR | Palantir has cooled off like the rest of the high-growth AI names after a strong previous move, but underlying demand is supported by continued government and enterprise spend. The company is benefiting from developments in expanded defense-related AI systems, which should continue to support the company’s narrative, even in the face of a recent pullback.
- $Anthropic | Tensions in the AI industry are running high, with Anthropic pushing back against regulatory and defense-related scrutiny, while at the same time competing with OpenAI for large-scale enterprise and government access. However, the company is benefiting from rapid valuation appreciation, just like OpenAI, due to strong revenue growth and in-depth partnerships with large cloud providers.
- $AI Infrastructure | The combined plans for capital expenditures by the large tech names are expected to total approximately $700 billion by 2026, driven by aggressive investment in artificial intelligence infrastructure. This is naturally supportive to the sector, even in the short-term volatile environment, particularly to semiconductor and cloud-related names.
The Magnificent Seven and the S&P 500

The Magnificent Seven, which include Apple, Microsoft, Nvidia, Amazon, Meta, Alphabet, and Tesla, are key to the overall index performance, but they are now under collective pressure. The recent sell-off in these names is being caused by valuation compression, profit-taking, and changes in AI-related growth expectations. The Magnificent Seven have previously contributed to a disproportionate increase in the stock market, so their current sell-off is now negatively impacting the S&P 500 and Nasdaq. At Zaye Capital Markets, we believe that this represents a transition phase rather than a collapse in fundamentals. Nevertheless, until sector participation broadens again or until earnings growth accelerates again, our reliance on this core group will continue to limit our upside potential and heighten our sensitivity to further downside risks.
Major Index Performance as of Monday, 23 March 2026
- S&P 500: The S&P 500 is currently trading within the 6,620-6,700 range and recently closed at 6,624.70. It is being pressured again by weak breadth and rising macro risks.
- Nasdaq Composite: The Nasdaq is currently trading within the 22,100-22,300 range and recently closed at 22,152.42. This represents the ongoing weakness in mega-cap technology stocks.
- Dow Jones Industrial Average: The Dow is currently trading within the 46,000-46,300 range and recently closed at 46,225.15. This represents relative stability within the market.
- Russell 2000: The Russell 2000 is currently trading within the 2,450-2,500 range and recently closed at 2,478.64. This represents the most vulnerable segment of the market due to tightening financial conditions.
At Zaye Capital Markets, we maintain a selective approach in the current environment. Weak breadth, concentrated leadership, and sensitivity to interest rate expectations continue to define market behavior. Investors should prioritize quality, earnings visibility, and structural growth themes while closely monitoring rotation signals and broader participation for confirmation of a more sustainable market direction.
Gold Price: Why Is Gold Holding Near Highs Despite Strong Data and War Risks?
Currently, the spot gold price is at $4,370.29. This has been holding up at record highs despite a decline of -2.82%. This decline is not a break in the gold price trend. As a market analysis firm, we at Zaye Capital Markets have noted that this has been holding up at record highs due to the rising geopolitical tensions, especially around the Strait of Hormuz. This has been especially true as threats to energy supplies have been on the rise. Recent comments on potential military conflicts, threats to energy infrastructure, and deadlines set for Iran have already pushed oil prices to over $112. This has already led to inflation concerns across global markets. This has been driving up gold prices as this is a concern that needs to be addressed. The lack of any major data releases today has taken away any pressure on interest rates. This has allowed geopolitical tensions to take center stage. This has helped gold prices hold up at record highs.
The economic data from yesterday has created another layer of complexity for the price of gold as it supports stability in the labor market as well as the resilience of manufacturing activity. Normally, this type of economic data would pressure the price of gold as interest rates are likely to rise. However, the current environment is not being influenced by a single variable. Rather, the price of gold is being supported by a combination of persistent geopolitical risks, higher energy prices, as well as stable yet not overheating economic environments. This is creating a fair environment where the pressure from interest rates is being countered by strong safe-haven demand. Therefore, the price of gold is entering a consolidative phase at higher price levels rather than reversing the trend. Market players should focus their attention to developments in the energy market, escalation risks, as well as changes in interest rate expectations that will determine whether the price of gold will continue to consolidate at these higher price levels or resume its upward movement.
Oil Prices: Why Are Oil Prices Volatile Amid War Risks and Supply Disruption Fears?
The current price for crude oil stands at $108.62 for Brent oil and $100.66 for WTI. These prices are still at higher levels as a result of a strong geopolitical rally. As confirmed by Zaye Capital Markets, oil prices are no longer moving based on fundamental supply-demand analysis. This is because they are moving based on geopolitical risk pricing. Recent events within the Strait of Hormuz, which is a critical global oil chokepoint, have increased market sensitivity. This has been brought about by threats to energy infrastructure, deadlines to Iran, as well as threats to escalate tensions. These events have already pushed up prices as traders are pricing in the potential for supply disruption within this critical chokepoint that handles a significant percentage of global oil flows. However, mixed messages that military objectives will soon be met have brought intermittent pullbacks to this volatile market. This has created a volatile push-and-pull environment. Overall market positioning has brought about increased hedging activity as traders are responding to these events immediately rather than waiting to see actual changes to oil supply.
The economic data that was announced yesterday has provided further support to the demand side of the equation, thus providing further support to oil prices by showing that the global economic activity continues to be strong. This shows that there will be no issue of demand destruction even at such high oil prices. Normally, this situation would have provided support to oil prices, but the absence of any economic data today means that oil prices are completely dependent on geopolitical factors. At the same time, the continued economic signals coming from the oil-supplying countries show that there will be no issue of supply, while the energy agencies are still concerned about maintaining the stability of oil supplies given the increasing geopolitical risks. This shows that the overall environment that oil prices are moving in at the moment is one that combines the factors of strong oil demand, controlled oil supplies, and increasing geopolitical risks. This shows that oil prices will be volatile in the near future, while any upside movement will be dependent on the escalation of risks. On the other hand, any downward movement will be limited unless there are any positive geopolitical factors.
Bitcoin Prices: Why Is Bitcoin Volatile Near $68K Amid War Risks and Tight Liquidity?
Currently, Bitcoin is trading at $68,285. It has been under pressure as it pulled back sharply from highs above $100,000. It has been struggling to gain pace above the $70,000 mark. As per our analysis at Zaye Capital Markets, we have confirmed that the current price movement of Bitcoin is largely influenced by a combination of various factors, including geopolitical tensions, market liquidity conditions, and shifting investment positions. Recent tensions over the Strait of Hormuz, which have been threatening energy infrastructure, have increased oil prices to over $112. This has created volatility across all asset classes. The current situation has created a dual identity for Bitcoin, which sometimes acts as a hedge asset, moving higher as equities face extreme pressure. At other times, however, it has been showing risk asset behavior, prone to extreme liquidations. This has been clearly reflected in the current situation, as Bitcoin has fallen below $69,000 due to geopolitical tensions. This has been accompanied by extreme derivatives readings as well as liquidations nearing $300 million. At the same time, underlying demand has been reflected by continued corporate buying as well as rising acceptance. This indicates that long-term investment confidence has not been affected by short-term volatility.
The economic data that has been revealed yesterday has strengthened the macro environment that is affecting Bitcoin by showing that the overall economy is still doing well, as labor conditions are still stable and manufacturing activity is improving. This is a major factor that is affecting Bitcoin because, as financial conditions tighten, liquidity flowing into assets will be curbed. However, as there are no major economic events today, everything will be affected by geopolitical events. This means that volatility will be affected greatly because everything will be influenced by sentiment. As a result, the price of Bitcoin is still stuck within a range that is volatile, as it is affected by both the overall trends that are showing that people are still adopting this asset as well as the overall macro environment that is pressuring this asset.
ETH Prices: Why Is Ethereum Price Stuck Near $2K Amid ETF Flows and Whale Moves?
Currently, Ethereum’s price stands at $2,059.51. This indicates that Ethereum’s price continues to consolidate at lower price points compared to its trend average of $2,434. Based on our analysis at Zaye Capital Markets, Ethereum’s price continues to experience pressure against Bitcoin. This comes at a time when Ethereum’s price continues to experience lower highs. This indicates that Ethereum’s price fails to sustain rallies past critical resistance points. Based on our analysis over the last week, Ethereum’s price continues to experience mixed flows from Ethereum-linked investment products. This indicates that there are no clear trends of strong institutional flows that could propel Ethereum’s price to breakout. This comes at a time when the overall markets are experiencing lower liquidity. Ethereum’s price continues to be influenced by overall crypto markets. This means that Ethereum’s price will be influenced by overall macro markets, risk sentiment, and Bitcoin’s price. Currently, Ethereum’s price suggests that it is waiting to break out. This comes at a time when Ethereum’s price holds critical support points.
The Ethereum price movements have been significantly influenced by whales. This comes at a time when Ethereum’s price movements have been characterized by significant whale movements. Based on recent blockchain flow patterns, periods of Ethereum moving to exchanges have coincided with short-term price weakness. This suggests that Ethereum’s price movements have been characterized by periods of distribution. This comes at a time when Ethereum’s price movements have been characterized by periods of cold storage during price dips. This suggests that Ethereum’s price movements have been characterized by periods of accumulation. This indicates that Ethereum’s price movements are range-bound. This comes at a time when Ethereum’s price movements have been characterized by periods of consolidation. This suggests that Ethereum’s price movements have been characterized by periods of consolidation.
