Where Are Markets Today?
U.S. and European equity futures opened Monday, 16 February 2026, with a cautiously constructive bias, although the momentum remains subdued due to the US Presidents Day holiday. How are markets performing today? US equity futures are trading slightly higher, while European equity futures are trading sideways or slightly negative. S&P 500 futures are trading 0.2 percent higher, while Nasdaq 100 futures are trading 0.16 percent higher, and Dow futures are trading 0.1 percent higher overnight. European equity index futures are trading sideways or slightly negative as the market positions itself for key European economic data releases later this week.
The main driver of the slightly higher US equity futures is the softer US inflation data released last week. US January consumer inflation data came in softer than expected, confirming the market’s expectation of a gradual easing of financial conditions later in 2026 if disinflation persists. Lower US inflation reduces the upward pressure on real yields and supports equity valuations, especially for sectors that are sensitive to financial conditions, such as technology and consumer discretionary. In addition, the lack of major US economic data releases today has resulted in a lack of volatility in US equity futures, allowing the market to gradually move higher.
In Europe, the overall sentiment is more subdued. Earnings calls out of export-oriented and industrial companies have highlighted continued fragility in demand, while ongoing questions about regional growth momentum continue to impact forward-looking expectations. Moreover, geopolitical risks related to ongoing Iran talks and national security dynamics have kept investors on their toes, particularly in companies with higher sensitivity to global trade and energy dynamics. The combination of lower U.S. inflation and ongoing geopolitical risks has created a dichotomy, with U.S. futures reflecting optimism about rates, while European futures continue to be influenced by growth-related uncertainty.
The overall takeaway is that the markets are entering the week in a consolidative phase, rather than a breakout phase. Markets are grappling with improving inflation trends, earnings dispersion, geopolitical risks, and trading dynamics associated with the holidays. Until higher volume trading resumes, futures will likely continue to trade in a range, with moves influenced by policy dynamics and global risk events, rather than any significant changes in the domestic economy.
Major Index Performance as of Monday, 16 February 2026
- S&P 500: Trading at 6,941.47 – flat as rotation effects counterbalance the pressure from the ‘Magnificent Seven.’
- Nasdaq Composite: Trading at 23,066.47 – under mild pressure as mega-cap stocks experience volatility and AI-capex strategies are recalibrated.
- Dow Jones Industrial Average: Trading at 50,121.40 – benefiting from its industrial and defensive stocks.
- Russell 2000: Trading at 2,669.47 – showing moderate resilience as small-cap stocks contribute incrementally.
The Magnificent Seven and the S&P 500
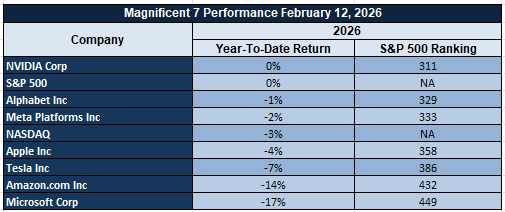
The ‘Magnificent Seven’ – Apple, Microsoft, Nvidia, Amazon, Meta, Alphabet, and Tesla – continue to be the fulcrum around which the indices move. Their capital expenditure commitments, artificial intelligence monetization strategies, and profitability resilience are always under the microscope. The question remains whether the outperformance will spill over into the broader semiconductor space, energy infrastructure, industrial automation, and defense technology sectors. Alternatively, will it continue to be dominated by the hyperscalers?
Drivers Behind the Market Move – Monday, February 16, 2026
The U.S. and European markets are trading through a holiday-thinned session in America, with investors trying to weigh weaker inflation data, increased geopolitical rhetoric, and an empty economic calendar. With no significant data points scheduled to be announced today, investors are focusing on events from last week and the weekend to guide their trading decisions. Below are the key factors that are currently driving market sentiments in both regions.
1. Cooling U.S. Inflation Supports Market Expectations of Rate Cuts
The weaker inflation print in January came in lower than expected, reinforcing expectations that inflation is slowly decelerating in the U.S. economy, paving the way for monetary policy normalization in the latter half of 2026, provided that disinflationary pressures persist in subsequent months. This weaker inflation print is providing support to U.S.-based equity futures, with bond yields benefiting from this positive development, especially in rate-sensitive sectors like technology and consumer discretionary stocks. Nevertheless, investors in Europe are remaining cautious, with growth uneven in the region, awaiting further data points to be announced in the latter half of this week to assess whether disinflation is becoming a broader phenomenon in Europe.
2. Geopolitics Surrounding Iran and Energy Policy
Recent comments on Iran negotiations being “difficult” with a focus on military posture as a bargaining chip have helped maintain a state of geopolitical uncertainty. This, in turn, has seen markets price in the potential for negotiations to take longer, with a possible escalation that could feed into energy supply dynamics. At the same time, the continued policy focus on Venezuela energy relations adds another dimension to oil supply side expectations.
3. Light Economic Calendar Encourages Range-Bound Trading
The lack of major economic data points scheduled for release today has seen trading dynamics driven more by positioning and sentiment rather than hard data points. Investors are now focusing on the upcoming macro data points, which could confirm the disinflationary theme that has thus far emerged from recent data points, or alternatively, create a degree of uncertainty on policy direction. The lack of immediate drivers has seen a quiet trading session, especially with US cash markets being closed, which has seen US futures perform positively while European futures have underperformed.
In conclusion, the combination of lower inflation, geopolitical developments, and a quiet macro calendar has created a stable market environment that is being cautiously watched by investors, who remain focused on whether this consolidation phase can develop into a broader, more sustainable trend.
Digesting Economic Data
The TRUMP Tweets and Their Implications
President Trump’s most recent statements on international relations, particularly with regard to Iran, have created an additional level of geopolitical risk which has already been factored into various markets. The President’s characterization of the Iran nuclear deal as “difficult,” along with his assertion that “fear” can be an important negotiating tool and his reference to military readiness as a negotiating chip, underscores his resolute approach to international diplomacy. The reported build-up of military assets and potential support for military action if talks fail only serve to further underscore this reality. The effect on markets has been to maintain a geopolitical risk premium in oil prices and gold, while at the same time injecting volatility into equity markets and digital assets.
At the same time, renewed focus on Venezuela’s energy relationship with other nations and President Trump’s praise of cooperation with the nation’s interim government create an additional level of international relations. Such cooperation has potential to support global oil supplies; at the same time, President Trump’s resolute approach to Iran serves to create offsetting pressures on oil prices. The White House’s defense of flexibility in tariff policy as a function of national security considerations, along with an assertion that no changes to metal tariffs will be announced unless formally announced, serves to maintain uncertainty with regard to industrials and materials.
Domestically, signaling executive action on voter identification, emphasis on immigration enforcement, and increased messaging on regulatory relief efforts underscore an environment in which politics and economics are inextricably linked. Notions of rising real wage growth amidst easing inflation pressures reinforce affordability narratives that have been a key component of the administration’s overall messaging, interpreted by markets as a supportive environment for consumer sentiment. Nevertheless, the interplay between politics and international affairs commentary increases risk assets’ sensitivity to headline risk, particularly in instances where politics intersects with cultural or electoral themes.
The February 13-15 window represents a brief window in which there was a high concentration of foreign policy, national security, and domestic themes. From a market perspective, it is not that there was a particular policy shift, but rather that there is a cumulative effect from an environment in which geopolitics have been at the forefront. Until negotiations with Iran clarify or trade policy direction changes significantly, geopolitics will remain at the forefront of market risk appetite and capital allocation decisions.
January CPI Cools to 2.4% as Energy Drop Offsets Sticky Services
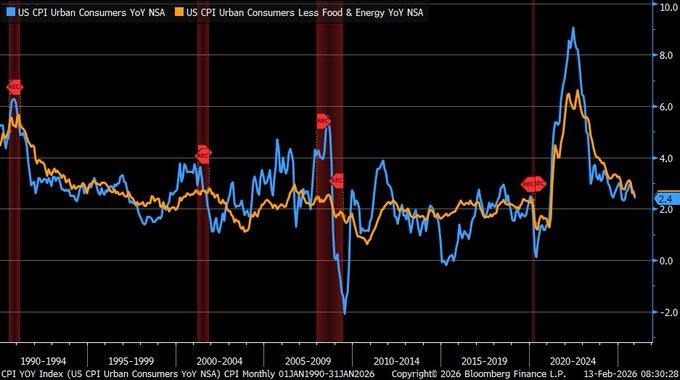
January 2026 CPI inflation eased to 2.4% year-over-year, below the 2.5% consensus and down from 2.7% previously, primarily driven by a sharp 15% decline in gasoline prices. Energy deflation materially offset shelter costs, which rose 2.8%, highlighting the uneven disinflation process. Core CPI held at 2.5%, slightly softer than the prior 2.6%, with monthly gains concentrated in service categories such as airline fares, up 6.5%. From our perspective at Zaye Capital Markets, this data confirms that headline inflation is moving closer to the 2% objective, but services inflation remains structurally firm, limiting the speed of policy easing expectations.
The broader inflation trajectory, now far removed from the 9% peak seen in 2022, reinforces market positioning for potential rate cuts later in 2026. However, we caution that energy-led disinflation is volatile and may not represent sustainable underlying softness. Shelter remains a lagging but critical component, and services inflation tied to wages continues to warrant close monitoring. For equity markets, this environment typically favors duration-sensitive growth stocks, particularly in technology and consumer discretionary, as lower rate expectations improve valuation multiples. Analysts should closely track wage growth data, rental index revisions, and forward energy pricing to assess whether this cooling trend can persist without reacceleration.
Given the shift toward a softer inflation backdrop and potential policy easing, Alphabet Inc. (GOOGL) appears undervalued relative to its long-term earnings power. As a capital-light, high-margin technology platform, its valuation remains sensitive to discount rate assumptions. A sustained decline in inflation expectations could expand multiples meaningfully. We believe analysts should monitor digital advertising demand, cloud revenue growth, and capital expenditure discipline to evaluate earnings durability under a lower-rate regime.
Household Debt Hits $18.8T as 40–49 Age Group Leads Borrowing Surge
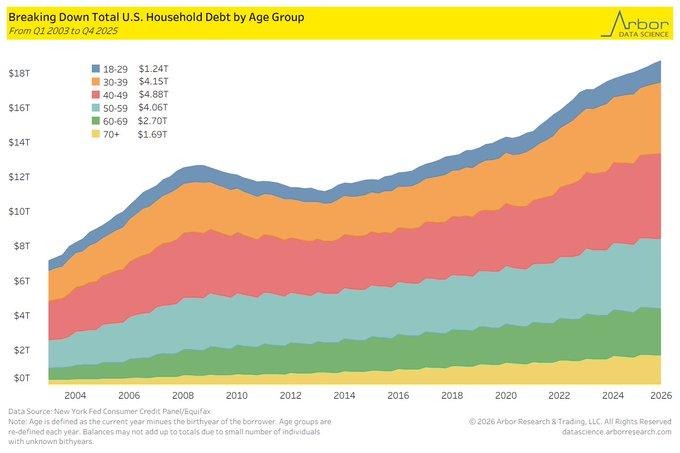
Total household debt rose to $18.8 trillion in Q4 2025 following a $191 billion quarterly increase, with the 40–49 age cohort carrying $4.88 trillion — the largest share among all demographics. This segment, typically in peak earning and family-expense years, has driven much of the mortgage expansion, as total mortgage balances climbed to $13.17 trillion. The steady rise in this group’s debt burden since 2003 reflects structural housing demand and higher property valuations rather than short-term excess. However, early-stage delinquencies ticked higher in Q4, suggesting that sensitivity to financing costs is gradually emerging beneath the surface.
From our perspective at Zaye Capital Markets, this debt concentration creates a two-speed risk profile. On one hand, strong wage growth in this age bracket supports debt servicing capacity, cushioning immediate systemic stress. On the other, this group is disproportionately exposed to mortgage refinancing risk and consumer credit rate resets. If interest rates remain elevated longer than expected, discretionary spending could moderate, particularly in housing-related categories and durable goods. Analysts should closely monitor delinquency roll rates, mortgage refinancing activity, wage growth stability, and regional housing price trends to assess whether household leverage transitions from manageable to restrictive.
In this environment, Home Depot Inc. (HD) appears undervalued relative to its structural earnings resilience. While housing turnover may slow under tighter credit conditions, aging housing stock and necessary home maintenance spending remain durable demand drivers. If rate stability or modest easing materializes later in 2026, refinancing activity could reaccelerate renovation spending. We believe analysts should track same-store sales trends, big-ticket discretionary purchases, and management commentary on consumer credit health to determine the sustainability of earnings momentum.
Home Prices Rise 1.68% YoY as Sales Slow and Supply Stays Tight
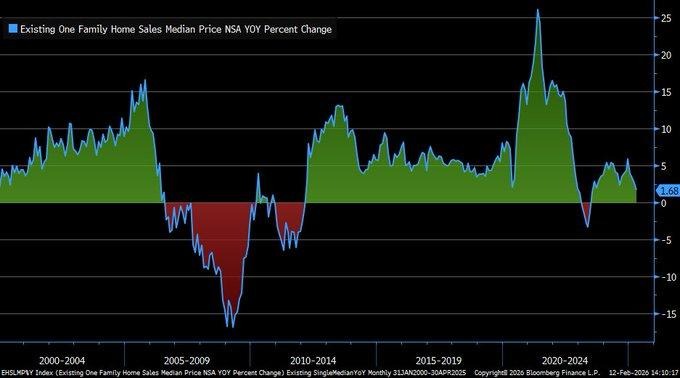
Existing single-family home median prices increased 1.68% year-over-year in January 2026 on a non-seasonally adjusted basis, marking a clear slowdown from the double-digit gains seen in prior years but remaining firmly positive. This price resilience comes despite a 4.3% decline in single-family sales volume, signaling that constrained housing supply continues to underpin valuations. Historically, housing has experienced deep contractions, including declines exceeding 10% post-2008 and rapid expansions above 15% in 2022. The current phase reflects neither boom nor bust, but rather a controlled cooling driven by affordability pressures and limited inventory turnover.
From our perspective at Zaye Capital Markets, this data reveals a structurally tight housing market rather than demand collapse. Regional divergence is becoming more pronounced, with price softness emerging in the South and West while the North and Midwest remain comparatively stable. This uneven cooling suggests localized affordability stress rather than systemic weakness. The broader macro implication is that housing wealth effects may remain intact in select regions, supporting consumer balance sheets and spending confidence. Analysts should monitor months-of-supply metrics, regional mortgage application data, and construction permit trends to assess whether price stability can hold amid slower transaction volumes.
In this environment, Lennar Corporation (LEN) appears undervalued relative to the structural supply imbalance in the housing market. As one of the largest homebuilders with diversified geographic exposure, it stands to benefit from constrained resale inventory that channels buyers toward new construction. If mortgage rates stabilize and regional demand pockets remain firm, order momentum could surprise to the upside. We believe analysts should closely track backlog conversion rates, gross margin stability, and regional pricing power to determine whether earnings resilience can persist through moderated volume conditions.
Jobless Claims Fall to 227K as Labor Market Signals Stabilization
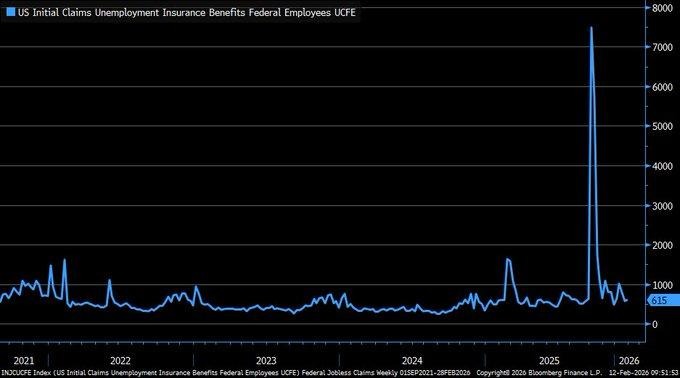
Initial jobless claims declined to 227,000 for the week ending February 7, 2026, down 5,000 from the prior week and continuing a steady retreat from the elevated peaks seen in 2025. While claims remain above the long-term historical average near 200,000, they are significantly below last year’s highs that exceeded 300,000. From our perspective at Zaye Capital Markets, this moderation suggests that labor market stress has eased materially, reinforcing the narrative of economic stabilization rather than contraction. The data indicates layoffs are not accelerating, reducing near-term recession probability and supporting steady consumer income flows.
This stabilization carries important policy implications. A cooling but not collapsing labor market gives policymakers flexibility while inflation trends remain under evaluation. The absence of renewed jobless spikes lowers urgency for aggressive easing but keeps the door open for calibrated rate adjustments later in 2026 if broader inflation metrics continue moderating. For equity markets, steady employment supports consumption, credit quality, and earnings visibility across consumer-facing sectors. Analysts should closely monitor continuing claims, labor force participation trends, and wage growth data to determine whether employment conditions remain balanced or begin tightening again.
In this context, JPMorgan Chase & Co. (JPM) appears undervalued relative to improving labor stability and contained credit risk. A resilient employment backdrop supports loan performance, limits credit loss provisions, and sustains consumer banking profitability. If claims remain stable and wage growth holds, credit quality metrics could outperform conservative expectations embedded in current valuations. We believe analysts should focus on net interest income trends, loan growth momentum, and consumer delinquency data to assess earnings durability under a steady labor environment.
Upcoming Economic Events
No Major Releases Today – Focus Shifts to New Week’s Data Flow
With no high-impact economic releases scheduled today, markets are likely to trade on positioning, technical levels, and broader sentiment rather than fresh macro catalysts. In such sessions, volatility can compress as institutional participants reduce conviction-driven moves ahead of more meaningful data. Liquidity conditions and bond yield movements may remain range-bound, but short-term swings can still occur as traders rebalance exposure. From our perspective at Zaye Capital Markets, low-data sessions often serve as consolidation phases before larger directional moves.
Attention now shifts firmly to the upcoming week, where inflation indicators, labor market readings, and forward-looking activity surveys are expected to provide clearer signals on growth momentum and policy direction. Inflation data will remain central to rate expectations, while employment metrics will determine whether consumer strength remains intact. If incoming numbers show renewed price pressures or labor overheating, markets could reprice toward a tighter policy outlook. Conversely, softer data would likely support easing expectations and lift rate-sensitive sectors.
We advise investors to monitor bond yield trends, sector rotation patterns, and currency stability heading into the new week. Technology and consumer discretionary names remain sensitive to rate expectations, while financials and cyclicals react more directly to growth signals. Periods of limited data should be used strategically to reassess risk exposure and prepare for volatility spikes once high-impact releases return to the calendar.
Stock Market Performance
Indexes Recover from April Lows, But Internal Divergence Persists
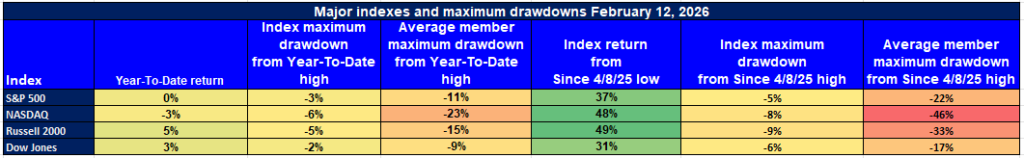
While major benchmarks have staged significant rebounds from the April 8, 2025 lows, year-to-date figures and constituent-level drawdowns reveal that participation remains uneven. At Zaye Capital Markets, we focus not only on headline index returns but also on average member performance, which provides a clearer view of underlying market health. The divergence between index stability and member-level stress continues to define the current structure.
S&P 500: Headline Stability Masks Deeper Member Losses
YTD: 0% | Max YTD drawdown: -3% | Avg. member max drawdown YTD: -11%
Since 4/8/25 low: +37% | Max drawdown since 4/8/25 low: -5% | Avg. member: -22%
The S&P 500 remains flat year-to-date, suggesting a market that has largely offset prior weakness without establishing sustained upward momentum. The -3% maximum drawdown from the YTD high reflects relatively contained volatility at the index level. However, the average constituent tells a different story. An -11% YTD drawdown and -22% drawdown since the April rebound highlight that many stocks have not fully participated in the recovery. This gap underscores concentrated leadership and limited breadth confirmation.
NASDAQ: Powerful Rebound, But Concentration Risk Elevated
YTD: -3% | Max YTD drawdown: -6% | Avg. member max drawdown YTD: -23%
Since 4/8/25 low: +48% | Max drawdown since 4/8/25 low: -8% | Avg. member: -46%
The NASDAQ has delivered the strongest recovery, surging 48% since the April low. Despite this rebound, it remains down 3% year-to-date, reflecting prior volatility. The -6% maximum YTD drawdown suggests higher sensitivity to rate and growth expectations. More notably, the average member has experienced a -23% drawdown YTD and a substantial -46% drawdown since April. This indicates that performance is heavily skewed toward a limited group of large-cap names, while a significant portion of growth stocks remain deeply underwater.
Russell 2000: Small-Cap Gains with Structural Fragility
YTD: +5% | Max YTD drawdown: -5% | Avg. member max drawdown YTD: -15%
Since 4/8/25 low: +49% | Max drawdown since 4/8/25 low: -9% | Avg. member: -33%
The Russell 2000 has advanced 5% year-to-date and rebounded 49% from April lows, signaling renewed appetite for smaller companies. However, its -5% maximum YTD drawdown and -9% drawdown during the recovery phase highlight elevated volatility. The -15% average member drawdown YTD and -33% since April reinforce that many small-cap names remain under pressure despite the index rebound. Liquidity conditions and earnings visibility continue to shape performance dispersion within this segment.
Dow Jones: Defensive Strength, Yet Uneven Participation
YTD: +3% | Max YTD drawdown: -2% | Avg. member max drawdown YTD: -9%
Since 4/8/25 low: +31% | Max drawdown since 4/8/25 low: -6% | Avg. member: -17%
The Dow Jones has risen 3% year-to-date with the shallowest YTD drawdown at -2%, reflecting its defensive composition. Its 31% rebound from April lows suggests measured recovery momentum. However, average member drawdowns of -9% YTD and -17% since April show that even within traditionally stable sectors, participation remains selective.
At Zaye Capital Markets, we continue to monitor breadth expansion as the primary signal for durability. Until average member performance begins converging with headline index gains, disciplined allocation and selective exposure remain essential.
The Strongest Sector in All These Indices
Energy Leads Year-to-Date and Maintains Monthly Momentum
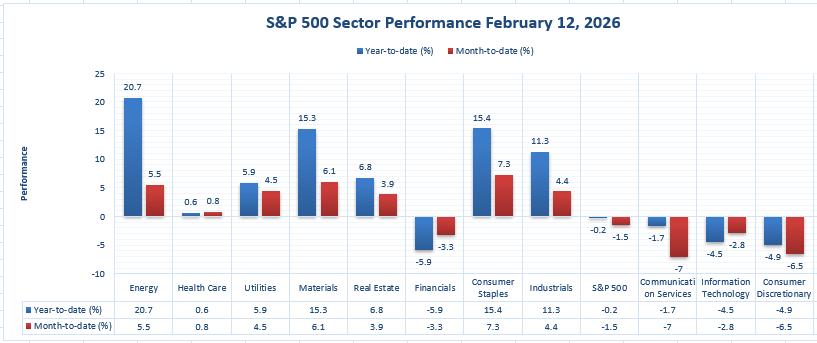
Based strictly on the latest sector performance data, Energy stands as the strongest sector across the S&P 500 landscape. Year-to-date, Energy has advanced 20.7%, the highest return among all sectors displayed. On a month-to-date basis, it has gained 5.5%, reinforcing sustained upside momentum rather than a one-off spike. No other sector matches this combined strength across both time frames. At Zaye Capital Markets, we interpret this as a signal of continued capital rotation toward hard-asset and pricing-power segments of the market.
For comparison, Consumer Staples has posted a 15.4% year-to-date gain with a 7.3% month-to-date increase, while Materials stands at 15.3% year-to-date and 6.1% month-to-date. Industrials follow with 11.3% year-to-date and 4.4% month-to-date gains. While these sectors show resilience, none exceed Energy’s 20.7% year-to-date performance. Even traditionally defensive areas such as Utilities (5.9% YTD, 4.5% MTD) and Health Care (0.6% YTD, 0.8% MTD) remain well below Energy’s trajectory.
By contrast, several sectors remain in negative territory year-to-date, including Financials (-5.9%), Communication Services (-1.7%), Information Technology (-4.5%), and Consumer Discretionary (-4.9%). Month-to-date weakness is particularly visible in Communication Services (-7.0%) and Consumer Discretionary (-6.5%). Against this backdrop, Energy’s 20.7% year-to-date and 5.5% month-to-date gains clearly position it as the dominant performer across the indices represented in the chart. At Zaye Capital Markets, we continue to monitor whether this leadership broadens or remains concentrated within commodity-sensitive names.
Earnings
Yesterday’s Earnings Recap – 13 February 2026
- Safran SA reported Full Year 2025 adjusted revenues of €31,329 million, an increase of 15% over the prior year, with recurring operating income increasing by 26% to €5,197 million, or 16.6% of sales. Net income, Group share, was €3,174 million, an increase of 3.5%. EPS, both basic and diluted, was €7.60, with organic revenue growth at 14.8%. The Company proposed a dividend of €3.35, an increase of 16%. Free cash flow grew by 23% to €3,921 million.
- Enbridge Inc. reported Full Year 2025 GAAP earnings attributable to common shareholders of C$7.1 billion, or C$3.23 per common share, an increase over C$5.1 billion, or C$2.34 per share, reported in 2024. Adjusted earnings were C$6.6 billion, or C$3.02 per share, an increase of 9% and 8% respectively over 2024. Adjusted EBITDA increased by 7% to C$20.0 billion, up from C$18.6 billion reported in 2024. Cash provided by operating activities was C$12.3 billion, with a guidance range of C$20.2–20.8 billion for adjusted EBITDA in 2026, and a 3% increase in the dividend.
- TC Energy Corporation reported Full Year 2025 comparable EBITDA of C$11.0 billion, an increase over C$10.0 billion reported in 2024. Comparable earnings were C$3,654 million, or C$3.51 per common share, an increase over C$3,865 million, or C$3.73 per share, reported in 2024. Net income attributable to common shares was C$3,612 million, or C$3.47 per share, with segmented earnings at C$8.0 billion, consistent with 2024 levels. Comparable EBITDA for the fourth quarter was C$3.0 billion, with comparable earnings at C$1.0 billion, or C$0.98 per share. The Company increased its quarterly dividend by 3.2% to C$0.8775, or C$3.51 on an annual basis, with a comparable EBITDA outlook of C$11.6–11.8 billion for 2026.
- Tokio Marine Holdings, Inc. has released its adjusted net income forecast for FY2025. The company has predicted its adjusted net income to reach ¥1.11 trillion. The company also predicts its adjusted return on equity at 20.5%, along with its dividend per share at ¥211. The company’s recent nine-month business results up to December 31, 2025, indicate an increase in its full-year business projections. The company’s strong underwriting and capital management are driving its earnings momentum toward its fiscal year-end in March 2026.
Today’s Earnings Preview – 16 February 2026
- BHP Group Ltd’s upcoming earnings release will take place in an environment of volatile commodity prices and demand. The company’s earnings sustainability will depend on its revenue’s sensitivity to iron ore and copper price changes. The company’s capital management discipline and its dividend payout strategy will also impact its earnings sustainability.
- Bridgestone Corporation’s upcoming earnings release will offer valuable information on the trends in global automotive demand. The company will release its earnings report with emphasis on its revenue growth trends by region and raw materials’ impact on its revenues. The company will also report its trends in operating margins and its product mix of commercial and consumer tires.
- Sonoco Products Company’s upcoming earnings release will offer valuable information on the demand conditions in the packaging industry. The company’s earnings sustainability will depend on its organic sales growth trends and its pricing power. The company’s raw materials management and its free cash flows will also impact its earnings sustainability.
Stock Market Overview – Monday, 16 February 2026
The United States stock markets are opening the week with a complex array of economic data, ranging from the slowing of inflation momentum to strong employment data, concentrated stock market volatility among the mega-cap stocks, and accelerating structural trends in artificial intelligence, semiconductor, defense tech, and energy infrastructure stocks. Although the stock markets are trading at relatively higher levels, there is significant variability in the underlying stocks. Capital is shifting, not expanding, and stability in the overall stock market indices belies significant dispersion in the stocks. At Zaye Capital Markets, we are not only focused on direction but also on the quality of participation, which is essential for sustainability, not just stability.
Stock Prices
Economic Indicators and Market Drivers
The recent slowdown in inflation rates has further reinforced the market’s perception of policy flexibility in the latter half of 2026. However, stable employment data are keeping any significant repricing of rate cuts at bay. The bond markets continue to remain volatile, and the stock market multiples, particularly those of artificial intelligence stocks, are being tested against significant capital expenditure pressures. The stock markets are recalibrating the artificial intelligence growth potential versus capital expenditure pressures. In addition, there is significant relevance of the availability of energy, particularly in the context of power infrastructure.
Latest Stock News
$RKLB Rocket Lab is planning another hypersonic test mission on its HASTE rocket, which will be launched no later than late February, marking the fourth hypersonic launch in under six months, cementing Rocket Lab’s reputation as a repeat customer for testing next-gen weaponry. In parallel, the interstage for Neutron has arrived at the test stand, where ~1,000 tonnes of pressure will be used to qualify the design for launch readiness. From the perspective of investors, the key items to monitor will be consistency of launch cadence, conversion of defense backlogs, and whether this qualification work will accelerate the Neutron launch schedule.
$ONDS Ondas has won a new multi-million-dollar deal for its Iron Drone Raider system in Europe, which follows successful testing at a major airport, demonstrating repeat purchasing behavior for the counter-UAS solution, which is becoming more in demand as a permanent solution for autonomous counter-UAS defense, especially in Europe. The market implication for investors is that testing has provided valuable feedback, which is now translating into new orders, which could be a positive for investors if this trend continues.
SpaceX The company is considering a dual-class share structure for a potential IPO, which could be launched this year, allowing for outsized voting control for a select few investors. The implication for public investors is that, from a corporate governance perspective, this type of share structure can be a powerful tool for long-term strategy execution, but at the cost of shareholder input.
Stargate UAE Stargate UAE is being touted as a fast-tracked data center build for AI, with a target of 5GW capacity within a larger campus for AI infrastructure. The implication for investors is that the demand for hyperscale infrastructure for AI is being constrained by power supply and construction speed, so the key players will be those that can source the necessary energy, land, and permitting.
$AMZN Its cloud segment again indicates that AI compute supply is still constrained, which suggests that spending will continue through 2027 if demand continues to outpace supply. Meanwhile, its advertising segment is still growing at a ~23% yoy rate and is at an $85B revenue run rate, which again suggests that pools of profitability are diversifying beyond just its retail segment. The tension point for the market is still how much additional profitability is being earned after accounting for the next wave of spending.
$PLTR / Anthropic The growth of frontier AI model use within operational environments continues to expand, further emphasizing the notion that platform providers can build “infrastructure layers” that transcend the product itself, especially within high-security environments. The relevant investor model remains centered on contract renewal and expansion from pilot environments.
$TSM Semiconductor supply chain leadership remains at the heart of the broader AI cycle, with advanced node capacity acting as the “choke point” for the most critical compute environments. The market model implies that demand visibility first appears within high-performance computing order trends before trickling downstream into equipment, networking, and data center build-out beneficiaries.
Positioning signals (no individual names) A major investment firm revealed new positions of ~$35M in $AVGO and ~$25M in $TSLA within the Q4 filing process, further emphasizing the notion that “selective re-risking” is occurring despite the elevated levels of mega-cap volatility. Notably, a prominent macro investor’s commentary highlighted the “conviction-first” approach that can be applied to thematic cycles, citing AI leadership as an example of why waiting for “perfect clarity” can cause an investor to “miss the move.”
HERE ARE THE TOP 15 PERFORMERS OF 2026
- $SNDK +164%
- $WDC +63%
- $BE +61%
- $TWST +55%
- $MU +44%
- $APLD +44%
- $AEHR +43%
- $DOCN +42%
- $AMAT +38%
- $LRCX +38%
- $ENPH +36%
- $NXT +34%
- $ON +33%
- $CRML +33%
- $ASML +31%
The Magnificent Seven and the S&P 500

The ‘Magnificent Seven’ – Apple, Microsoft, Nvidia, Amazon, Meta, Alphabet, and Tesla – continue to be the fulcrum around which the indices move. Their capital expenditure commitments, artificial intelligence monetization strategies, and profitability resilience are always under the microscope. The question remains whether the outperformance will spill over into the broader semiconductor space, energy infrastructure, industrial automation, and defense technology sectors. Alternatively, will it continue to be dominated by the hyperscalers?
Major Index Performance as of Monday, 16 February 2026
- S&P 500: Trading at 6,941.47 – flat as rotation effects counterbalance the pressure from the ‘Magnificent Seven.’
- Nasdaq Composite: Trading at 23,066.47 – under mild pressure as mega-cap stocks experience volatility and AI-capex strategies are recalibrated.
- Dow Jones Industrial Average: Trading at 50,121.40 – benefiting from its industrial and defensive stocks.
- Russell 2000: Trading at 2,669.47 – showing moderate resilience as small-cap stocks contribute incrementally.
As Zaye Capital Markets, we continue to take a disciplined view. The market is dominated by concentration risks, infrastructure constraints, power issues, and capital cycles. We continue to focus on companies with strong balance sheets, resilient cash flows, structural exposures, and capital allocation strategies. The market needs to broaden out and volatility needs to compress before we take risks. Selectivity is not just necessary – it’s essential.
Gold Price: Is Gold Consolidating Near $5,000 on Geopolitical Risk and Cooling CPI?
The price of gold is trading at around $4,988 per ounce, with the April gold contract trading at $5,006 per ounce. This is as the price consolidates just below the psychological $5,000 threshold, which was breached last week. The recent retreat in the price of gold can be attributed to profit-taking, particularly after inflation data showed that the January inflation rate cooled to 2.4% year-over-year, further supporting the possibility of policy flexibility later in 2026. President Trump’s comments on Iran negotiations being difficult, with military posture being used as leverage, and his willingness to support military action if negotiations fail have increased geopolitical risks. In addition, the recent focus on Venezuela’s energy relations, coupled with the reaffirmation of the administration’s flexible tariff strategy based on national security, further increases geopolitical risks. In the past, geopolitical rhetoric, coupled with ambiguity, has increased the flow of gold as a safe-haven asset. With no economic data being released today, the price of gold is trading based on position dynamics.
The recent drop in inflation rates has lessened the burden on real yields, which has lowered the opportunity cost of holding non-yielding assets such as gold. In addition, the drop in price growth has further increased the possibility of restrictive monetary policies being relaxed later in 2026, further supporting the price of gold. In addition, geopolitical risks, which have increased due to the recent comments by President Trump on Iran, have further increased support for the price of gold. In summary, the recent drop in inflation rates, coupled with the increase in geopolitical risks, has created a dual support scenario for the price of gold, with the first being the recent drop in inflation rates, which has lowered the opportunity cost of holding non-yielding assets such as gold, coupled with the increase in geopolitical risks, which have further increased support for the price of gold.
Oil Prices: Are Oil Prices Caught Between Iran Tensions, OPEC Supply, and Softening Inflation Signals?
The current price of Brent crude is trading at US $67.72 per barrel, while the price of West Texas Intermediate (WTI) crude is trading at US $62.86 per barrel. This keeps the price of oil trading within a defined range. The price movements of crude oil over the past few sessions can be characterized as a tug-of-war between the overall uncertainty of the supply side of the equation and the overall caution of the demand side of the equation from a macroeconomic perspective. This comes as President Trump’s comments on the Iran talks being “difficult” and the administration’s willingness to use military posture as leverage in the talks have put the geopolitical premium back into the price of crude oil. Furthermore, the overall focus on the relationship between the US and Venezuela continues to add to the narrative that the global oil supply remains sensitive from a geopolitical perspective. However, the price movements of crude oil are also limited due to the overall expectation that the OPEC+ alliance is poised to gradually add more supply back into the global market, as well as the IEA’s projection that global oil production growth is poised to outpace demand growth in 2026.
The impact of the latest drop in consumer prices, announced yesterday, is also having a bearing on market sentiment, with moderating inflation pressures curbing growth expectations, thus dampening demand for energy consumption. While lower inflation rates ease the burden on monetary policy, they also represent a deceleration in economic growth, thus limiting an increase in crude prices if demand growth is negatively affected. In the absence of any major economic releases scheduled for today, oil prices are largely influenced by positioning and geopolitical factors. If future data confirms stronger growth in industrial activity or global demand, oil prices could test higher resistance levels. However, if reports confirm oversupply in the market, stemming from OPEC decisions on output, or weaker demand from IEA reports, Brent and WTI could test lower levels. We are currently in a phase where there is a balance between supply-side pressures, limiting any strong rallies in prices, and geopolitical tension, supporting prices from below.
Bitcoin Prices: Is Bitcoin Consolidating Near $66,000 as Macro and Geopolitical Risks Build?
Bitcoin is currently trading at around US $66,000, with prices holding in a tight consolidation range between the mid-$65,000s and high-$68,000s, unable to sustain a move past the coveted $70,000 mark. Market participants are awaiting a catalyst to resume their uptrend, with prices currently in a phase of consolidation rather than acceleration. ETF flows have been negative for a second day in a row, with whale transactions indicating increased sell-offs to centralized exchanges, while options data shows increased downside hedging activity. Leverage in derivatives is down, with funding rates normalized, indicating that the market is back to a state of neutral, with the earlier liquidation wave having reset speculative position. According to technical analysts, Bitcoin is currently trading below all key trend indicators, with prices required to move past $70,000 to shift from consolidation to uptrend acceleration. Trading volumes have been lower compared to averages in January, indicating that participants are awaiting a catalyst to resume their uptrend.
The recent statements made by President Trump on the Iran negotiations being “difficult” and the military posture being used as leverage in the talks, while also re-asserting the nation’s security positioning, have resulted in an increase in geopolitical risk perceptions across global markets. Although Bitcoin is not a traditional safe-haven asset like gold, during periods of political uncertainty and global tensions between countries, there is an increased interest in the asset as a measure of overall portfolio diversification strategies. Furthermore, the cooling of the CPI data released yesterday has also had an effect on the overall sentiment of the market, as it has strengthened the case for eventual monetary flexibility later on in 2026. However, since there are no major economic data points scheduled for today, the price action of the asset is dependent on the performance of the overall equity markets, especially the Nasdaq Index, as well as the overall macro environment instead of fundamental data points. The current state of the market can be characterized as one that is balancing short-term technical pressures while maintaining long-term fundamental strengths such as the record stability of the network hashrate and the lack of change in corporate treasury holdings. Therefore, the asset is expected to continue trading at the $66,000 level until there is a clear indication of the next directional move from the overall market environment.
ETH Prices: Is Ethereum Consolidating Around $2,000 Levels as ETF Flows, Whale Positions Change?
As of Monday, i.e., 16th February 2026, the price of Ethereum has stabilized at around $1,980, trading within a tight trading range of $1,950 to $2,020, as the market consolidates below the key $2,000 psychological level. This is a natural consolidation phase for the broader crypto market, which has seen a decline in the initial weeks of February. Trading volumes currently remain lower than January levels, with derivative leverage also being reset. Spot ETF flow data for the recent sessions has seen alternating periods of inflows and outflows, which indicates that institutional investors remain neutral rather than being bullish on the digital asset. At the same time, on-chain data for the week has seen considerable whale action, with large-scale transfers being made to and from centralized exchanges. It has also seen selective buying at support levels by long-term investors, while other large investors have been selling into strength, which has led to a consolidation phase.
In terms of sentiment, the Ethereum market is being driven by the same macro factors that are driving the Bitcoin market, which includes inflation data, rate market positioning, and Iran-U.S. relations, which have affected the broader national security theme. Yesterday’s lower-than-expected inflation data has provided a minor boost to the market, which has helped ease the pressure on real yields, a macro theme that is structurally supportive for non-yielding assets like Ethereum. However, with no new macro drivers in the market today, Ethereum continues to trade in line with the broader market, which has seen mixed equity market action. ETF investors remain sensitive to volatility, while whale investors seem to be adopting a wait-and-see approach, with a lack of aggressive buying above the key $2,000 levels, which means that Ethereum will remain in consolidation mode unless ETF flows turn strongly positive or whale investors accelerate their buying above the key $2,000 levels.
