Where Are Market Today?
European and U.S. equity futures are opening on a weaker footing, extending the downside momentum from the previous session as inflation fears tighten their grip on market sentiment. U.S. futures are modestly lower, with Dow futures down 0.15%, while S&P 500 and Nasdaq futures are both slipping by around 0.1%–0.15%. European futures are following the same direction, reflecting a synchronized global reaction to rising macro risks. The primary reason behind this softer opening is the combination of stronger-than-expected inflation data and a sharp surge in oil prices, both of which are forcing investors to reassess risk exposure and near-term market direction.
The Inflation backdrop has shifted meaningfully following the latest producer price data, which came in above expectations and signaled that cost pressures within the economy remain persistent. At the same time, energy markets are amplifying this concern, with Brent crude trading above $111 per barrel and WTI approaching $100. This creates a compounding effect where businesses face higher input costs while consumers deal with rising energy expenses, increasing the risk of sustained inflation. As a result, expectations for interest rate cuts are being pushed further out, leading to higher discount rates across equity markets and placing downward pressure on valuations, particularly in growth-heavy sectors.
Geopolitical developments are further reinforcing this cautious tone. The ongoing tensions in the Middle East and risks surrounding key energy supply routes are adding another layer of uncertainty, directly influencing oil prices and indirectly shaping inflation expectations. Markets are increasingly pricing in the possibility that these disruptions may persist, which could keep energy prices elevated for longer. This environment raises concerns around a stagflation scenario, where growth slows while inflation remains high—an outcome that typically weighs heavily on equity markets due to its impact on both corporate earnings and investor confidence.
Despite the current weakness, underlying fundamentals such as resilient corporate earnings and stable consumer activity continue to offer some level of support. However, in the near term, markets are clearly prioritizing macro risks over structural strengths. With key economic data releases ahead, including unemployment claims and manufacturing indicators, investors are positioning cautiously, waiting for clearer signals on growth and inflation. At Zaye Capital Markets, we maintain that until inflation shows consistent signs of easing and geopolitical risks stabilize, both European and U.S. markets are likely to remain under pressure, with sentiment driven primarily by macroeconomic uncertainty rather than company-specific performance.
Major Index Performance as of Thursday, 19 March 2026
- S&P 500: Trading at 6,624.70, down 1.4%, reflecting broad weakness following inflation concerns.
- Nasdaq Composite: Trading at 22,152.42, down 1.5%, as large-cap technology stocks continue to face pressure.
- Dow Jones Industrial Average: Trading at 46,225.15, down 1.6%, marking a sharp pullback amid rising yields and geopolitical uncertainty.
- Russell 2000: Trading at 2,478.64, Magnificent down 1.6%, highlighting continued sensitivity in small-cap stocks to tighter financial conditions.
The Magnificent Seven and the S&P 500
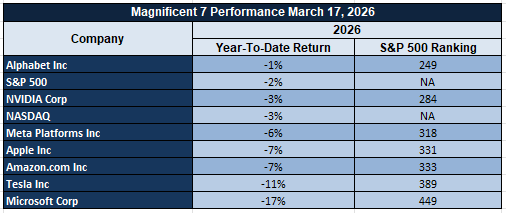
The “Seven” — Apple, Microsoft, Nvidia, Amazon, Meta, Alphabet, and Tesla — are increasingly acting as a drag on the broader market after previously driving gains. This group’s sensitivity to interest rates is now becoming more evident, as higher yields compress valuations and reduce appetite for high-growth names. At the same time, rising capital expenditure commitments in artificial intelligence and ongoing supply chain constraints are beginning to pressure margins and near-term earnings expectations. While Nvidia has shown relative resilience due to strong demand visibility, the broader group remains under pressure, exposing the lack of widespread market participation. Until leadership broadens beyond these names, overall market performance is likely to remain uneven.
Drivers Behind the Market Move – Thursday, March 19, 2026
As U.S. and European markets navigate through a complex mix of inflation pressures, geopolitical escalation, and critical economic releases, investor sentiment remains cautious and reactive. The combination of rising input costs, energy-driven inflation risks, and policy uncertainty is shaping a fragile environment where markets are struggling to find clear direction.
- Inflation Pressures and Shifting Rate Expectations
The latest producer price data has reinforced concerns that inflation remains persistent, coming in above expectations and signaling that cost pressures across the production chain are not easing as anticipated. This has led to a repricing of interest rate expectations, with markets increasingly anticipating that monetary easing may be delayed. At the same time, forward-looking indicators such as rising services price expectations suggest that inflation risks are broadening beyond goods into the wider economy. This environment is placing pressure on equity valuations, particularly in growth-oriented sectors, as higher interest rates increase the cost of capital. From a valuation perspective, we are identifying selective opportunities in high-quality technology and consumer names that have been oversold on rate fears. Analysts should closely monitor upcoming labor market data and manufacturing indicators to assess whether inflation persistence will translate into slower economic activity.
- Geopolitical Risks and Energy Market Disruptions
Geopolitical developments continue to play a central role in shaping market direction, particularly through their impact on energy markets. Recent policy signals and strategic objectives tied to ongoing military operations have increased uncertainty around key energy supply routes, driving oil prices sharply higher. While temporary measures such as allowing foreign vessels to transport fuel aim to ease short-term disruptions, they also highlight the severity of the underlying risks. Elevated oil prices are feeding directly into inflation expectations, creating additional pressure on both consumers and businesses. This dynamic is particularly impactful for European markets due to their higher reliance on imported energy, while also influencing global risk sentiment. Within this environment, energy producers and companies with strong pricing power in resource-linked sectors appear relatively undervalued. Analysts should monitor developments around energy supply coordination and production responses, as these will determine whether current price levels are sustained.
- Upcoming Economic Data and Market Sensitivity
Markets are now highly focused on today’s economic calendar, with key releases expected to provide further clarity on the strength of the economy. Data points such as unemployment claims and manufacturing activity will offer real-time insights into labor market resilience and industrial momentum. Stronger-than-expected data could reinforce the higher-for-longer interest rate narrative, adding pressure to equities, while weaker data may increase concerns about slowing growth and support defensive positioning. In Europe, central bank decisions and policy statements will also be critical, as any shift in tone could influence both currency and equity markets. This creates a high-sensitivity environment where even small deviations from forecasts can trigger significant market reactions. From an investment standpoint, we are identifying mispricing in defensive sectors and high-quality growth companies with strong balance sheets, as volatility creates selective entry opportunities. Analysts should remain focused on how incoming data aligns with inflation trends and policy expectations, as this will drive the next directional move in global markets.
In summary, the convergence of persistent inflation pressures, elevated geopolitical risks, and a heavy economic data calendar is shaping market conditions today. Investors are approaching the market with caution, leading to subdued and mixed futures as they await clearer signals on both economic direction and policy response.
Digesting Economic Data
The Trump Tweets and Its Implications
The latest communication signals reflect a clear escalation in geopolitical posture, particularly around the Middle East, with multiple statements outlining military objectives, strategic options, and funding commitments exceeding $200 billion tied to ongoing operations. The emphasis on eliminating missile capabilities, naval strength, and regional proxies, alongside maintaining all strategic options, introduces a heightened level of uncertainty into global markets. At the same time, the explicit threat toward critical energy infrastructure and calls for international cooperation to secure key shipping routes signal that energy supply risks are not only present but actively being monitored at the highest level. This combination reinforces a market environment where geopolitical risk is no longer a background factor but a primary driver of asset pricing, particularly across commodities, currencies, and safe-haven assets.
At the same time, policy responses aimed at stabilizing short-term disruptions—such as the 60-day waiver allowing foreign vessels to transport fuel and goods—highlight an attempt to manage immediate supply chain pressures without resolving the underlying conflict. This creates a dual-layer market reaction. On one side, such measures help prevent immediate spikes in energy prices and logistical bottlenecks. On the other side, they confirm that disruptions are significant enough to require intervention, reinforcing the structural risk premium across energy markets. The messaging around encouraging allies to invest more heavily in oil and gas further supports a longer-term shift toward energy security, suggesting that fossil fuel demand and production strategies may remain elevated even as markets transition over time.
Beyond the Middle East focus, developments around international relations—particularly the postponement of the Beijing visit and criticism of allied leadership—introduce additional layers of geopolitical complexity. These signals point to potential shifts in global coordination, trade dynamics, and diplomatic alignment, all of which can influence investor sentiment and capital flows. Markets typically respond to such developments through increased volatility, as uncertainty around global cooperation reduces visibility for multinational operations and cross-border investments. At the same time, reaffirmations of internal leadership confidence and institutional stability are designed to offset some of this uncertainty, although the broader tone remains one of strategic repositioning rather than de-escalation.
From a market impact perspective, the combined effect of these communications is a shift toward a more defensive and risk-aware investment environment. Rising geopolitical tension, coupled with policy interventions and evolving global alliances, is reinforcing demand for safe-haven assets while increasing volatility across risk-sensitive sectors. The absence of a clear resolution path, combined with ongoing strategic signaling, suggests that markets will continue to price in elevated uncertainty across multiple asset classes. At Zaye Capital Markets, we interpret these developments as a continuation of a fragmented global landscape, where policy decisions, military developments, and economic strategy are increasingly interconnected, requiring investors to remain adaptive and closely monitor both geopolitical signals and their direct transmission into financial markets.
Factory Orders Edge Higher, Core Manufacturing Signals Resilience
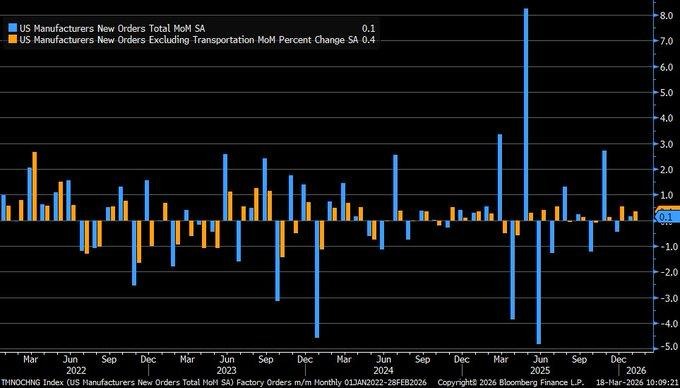
The current economic situation is characterized by an important stabilization signal from the latest available economic data, with January orders rising by 0.1%, as expected, and representing an increase from last month’s 0.4% decline. Although this economic data is low, the overall situation suggests that manufacturing activity is finding support after experiencing some volatility driven by weaker global demand and sector-specific disruptions. This stabilization signal is particularly important given the mixed performance of some of the transportation-related industries, where auto and aircraft orders have been erratic and have not reflected the actual underlying trend of the overall sector.
If we look at this situation more carefully, we will see that an important signal comes from core orders, excluding transport orders, rising by 0.4%, beating expectations of 0.3%. This shows that underlying orders for machinery and equipment remain strong, despite experiencing some volatility. The situation suggests that businesses are gradually returning to their capital expenditure plans, especially for automation, infrastructure, and supply chain resiliency. However, this recovery is still modest rather than robust and suggests that businesses remain cautious about stepping up their activity levels due to ongoing concerns about global demand and financing conditions.
In such an environment, we believe Caterpillar Inc. (CAT) is undervalued based on its positioning within the industrial and capital goods cycle. Caterpillar is a leading manufacturer of construction and mining equipment and is directly leveraged to an improvement in capital spending and infrastructure. Caterpillar is also exposed to the energy, construction, and resources sectors, which provide a diversified set of demand drivers. Additionally, investments in automation and efficiency improve their margin profile. Analysts should be focused on Caterpillar’s order backlog trends, global infrastructure spending signals, commodity price stability, and capital expenditure intentions in key industries. These factors are critical in assessing whether this environment is leading to a sustained industrial recovery, which benefits capital goods leaders.
PPI Surprise Signals Rising Cost Pressures, Challenges Rate Cut Outlook
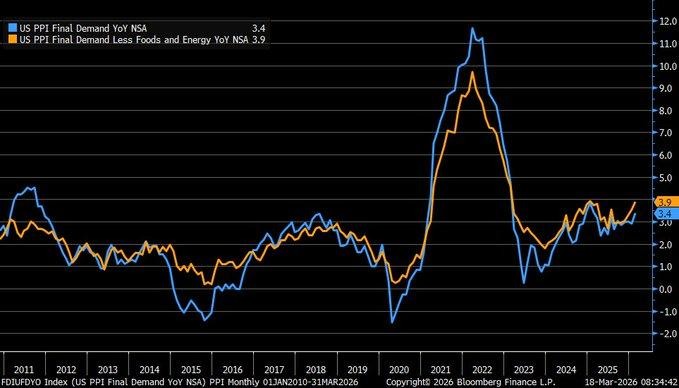
We are observing a clear upside surprise in the producer price indices, with February’s PPI rising by 3.4% year-over-year, beating expectations of 3.0% as well as the prior reading of 2.9%. More importantly, we see that the core reading is now at 3.9%, beating expectations of 3.7%. The takeaway is that underlying inflation at the producer level is indeed accelerating rather than decelerating. We note that this is a clear change in trend from the disinflationary pressures that we saw through mid-2025, when the core reading was more around 2.5%. The takeaway is that cost pressures are indeed building within supply chains, suggesting that businesses are indeed facing upward pressures in terms of costs.
The implications of this are significant because we see that with producer inflation reaccelerating, we are less likely to see rate cuts in the near term because policymakers are unlikely to cut interest rates in this scenario. On the other hand, we see that this is also a stagflationary scenario because we see that economic growth is still decent, but inflation is still running hot. Market behavior is indeed reflecting this change in scenario, with initial risk-off behavior being contained as we see sector rotation rather than broad-based selling. We see that defensive sectors such as healthcare, consumer staples, and utilities are indeed being favored, with rate-sensitive/high-duration assets being under pressure due to a recalibration in interest rate expectations.
In this context, we have shortlisted Procter & Gamble Co. (PG) as an undervalued stock in the current inflationary scenario. As a consumer staples company, it enjoys the benefit of pricing power, which allows the company to raise prices in response to increased input costs without any significant impact on demand. Moreover, with a diverse product portfolio in essential consumer products, the company is able to maintain a consistent top-line performance during periods of economic volatility. Therefore, it is important that analysts track the pricing power of the company in passing on increased input costs, as this is an important indicator of the company’s ability to sustain its profitability performance. In an environment where producer inflation is on the rise and interest rate markets are experiencing volatility, companies with consistent cash flows and defensive characteristics are expected to perform relatively better.
Helium Supply Disruption Points to Undervalued Risk to Semiconductor Output
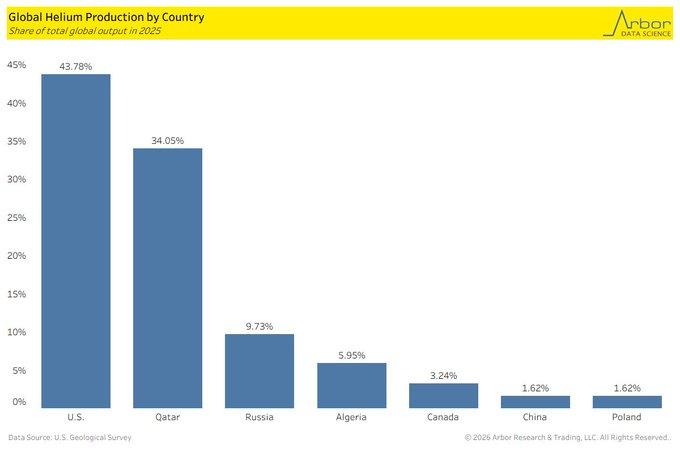
We are witnessing the beginning of a critical but underpriced risk emerging within the global semiconductor supply chain, as a result of disruptions within global helium supplies. Qatar is responsible for producing 34% of global helium output, but has seen this output disrupted as a result of escalating geopolitical tensions that halted a significant LNG-linked helium output in early March. Helium is a critical input within the global semiconductor supply chain because of its non-substitutable use within fabrication processes, particularly with respect to cooling advanced lithography equipment and ensuring ultra-clean environments within fabrication plants. Helium is not easily substitutable or replicable through synthetic means, so disruptions within helium output are immediately impactful on the global supply chain.
The effects of this disruption are already being seen within helium pricing, as helium has seen a 50% plus increase within a week’s trading period. The implications of this are significant because this points to a critical tightening within helium supplies that could extend overall semiconductor output by as much as six to twelve months. Historical analysis has seen helium shortages previously cause significant delays within wafer output. The overall implication is that while energy markets are currently focused on risks emanating within global oil supplies, this parallel supply shock could quietly exert upward pressure on the global tech space, particularly as overall demand for advanced chips continues to grow as a result of artificial intelligence buildouts.
In this context, we believe that ASML Holding NV (ASML) is an undervalued stock despite the near-term issues in the supply chain. ASML is a leading supplier of advanced lithography tools that are essential in the semiconductor manufacturing process. Therefore, it is at the heart of the long-term semiconductor demand that is fueled by the increasing demand for artificial intelligence and the expansion of digital infrastructure. Therefore, despite the near-term issues in the supply chain that may be fueled by the shortage of helium, which is used in the semiconductor manufacturing process, it is important to note that such issues are an endorsement of the long-term demand for advanced semiconductor fabrication capacity and advanced semiconductor manufacturing equipment.
NY Fed Survey Indicates Increasing Cost Expectations in the Services Sector
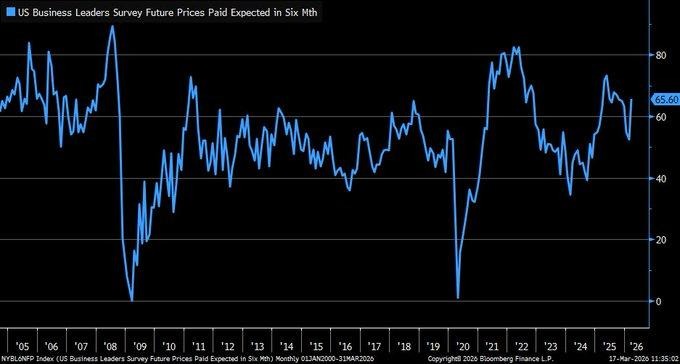
What we are seeing here is a dramatic shift in the inflation expectations of the services economy, as indicated by the latest business survey, which has recorded prices paid expectations rising to 65.5 for the next six months, with the biggest monthly increase since 2022. The significance of this is compounded by the fact that the services economy represents more than 70% of the overall economic activity, which means that the cost pressures in this segment have a tendency to sustain over a longer period of time. The rise from the lowest point after 2023 indicates that businesses are now bracing themselves for increasing costs, driven by wage pressures, business expenses, and demand for services.
The forward-looking nature of this data also presents another level of concern as the companies are now projecting inflation at levels higher than 4% until the end of 2026, which suggests that price stability may not be achieved in the near future. This also presents a level of concern from the macroeconomic perspective as other factors such as the stable labor market and the reduction in core inflation suggest that the economy is improving gradually. As such, the disparity between the realized inflation data and the forward-looking data presents a level of concern regarding the direction that the economy may take in the near future as the cost pressure in the services sector may delay any meaningful easing of the financial conditions.
In this context, we believe that the stock of Mastercard Inc., or MA, is undervalued in the current context. As the company operates as a global payments network, the company experiences nominal expenditure growth, which means that as the prices of the products and services increase, the transaction volumes also increase proportionally. The asset-light business model of the company also presents a level of comfort as the cost pressure increases in the near future due to the high level of operating margins that the company maintains. As such, the analysts are advised to keep a close eye on the trends related to the transaction volumes as this would be the key factor in determining the future performance of the company as the inflation expectations are high in the current context.
Pending home sales signal weak demand, early signs of stabilization
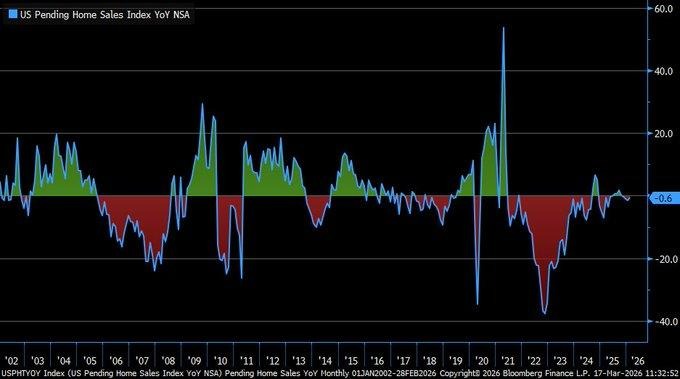
We are witnessing continued weakness in demand as indicated by the 0.6% year-over-year decline in pending home sales in February. This indicates ongoing affordability pressures due to high home prices and still-high borrowing costs. Although this marks a modest improvement from the more severe year-over-year decline seen in January, it nevertheless confirms that the housing market continues to face headwinds as buyers adjust to the rising cost of financing. This, as a leading indicator of future home sales, indicates that home sales will likely remain soft in the near future, supporting our view that housing will likely remain a headwind to economic growth.
However, early signs of stabilization are beginning to emerge as indicated by the month-over-month increase of 1.8% in pending home sales. This indicates that buyers are gradually reentering the market as mortgage rates fall below the 7% threshold. This indicates that demand is very sensitive to financing costs and responds to even small changes in mortgage rates. In comparison to the surge from the period between 2020 and 2022, the current numbers are much lower; however, as the mortgage interest rate models suggest that the rate may stabilize closer to 6.5%, the housing activity may begin to recover over the next 12 to 24 months.
In this context, we are of the opinion that D.R. Horton Inc., or DHI, is an undervalued stock within the context of the current housing cycle. As one of the largest homebuilders with a significant emphasis on the entry-level and affordable housing markets, the company is well-positioned to benefit from the improving housing market as the affordability improves over the next couple of years. Analysts should also look at the mortgage interest rate trends, order growth, cancellation trends, and price strategies as these are likely to impact the recovery in the housing market over the next couple of years. As the housing market is slowly improving but still faces challenges, the best stocks to consider are the ones that are operationally flexible and have significant exposure to the first-time buyer market.
Services Sector Signals Automation Shift as Investment Outpaces Hiring
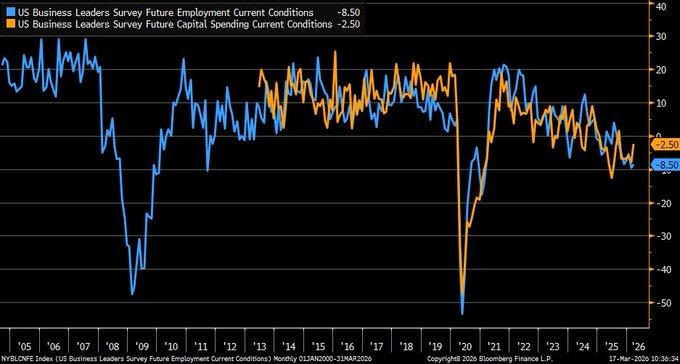
We are witnessing a clear divergence in forward-looking business behavior in the services sector, as capital spending expectations have improved to -2.5 after moving out of deeper levels of contraction, while employment expectations have deteriorated further to -8.5. While both series remain in negative territory, we should note that the change in direction is more significant, as this suggests that businesses are increasingly favoring investment in automation technologies over hiring more workers. This is part of a broader set of structural changes we are witnessing in labor markets as businesses increasingly look to automation as a means to deal with rising costs without having to significantly increase labor.
The implications of this are more significant than just business sentiment, as this signals a deeper change in labor markets. We should note that this is part of a historical pattern as capital expenditure tends to recover more quickly than labor during economic cycles. The more significant gap this time suggests that we are witnessing a deeper shift away from labor as a means to grow output, as we are witnessing reports that businesses are able to maintain output levels despite tightening labor markets, suggesting that automation is becoming a key driver of productivity growth. The lack of hiring expectations suggests that wage growth may not be as robust, with consumer income growth potentially being constrained if labor markets do not grow in line with capital expenditure.
In this context, Rockwell Automation Inc., or ROK, emerges as a stock that is undervalued in this changing scenario. ROK is a company that focuses on the business of industrial automation and control systems as well as digital transformation solutions that enable businesses to achieve greater efficiency and reduce the need to rely on labor costs to achieve the same. As the business environment continues to favor capital expenditure over labor costs, the prospects for automation technology are likely to remain robust, and this stock can be seen as one that is likely to benefit from the changing business environment and not just the cyclical recovery that the business environment is likely to witness. Efficiency-based capital expenditure is likely to replace the traditional labor expansion strategy in the business environment.
Upcoming Economic Events
GBP Claimant Count Change, Average Earnings Index 3m/y, Monetary Policy Summary, MPC Official Bank Rate Votes, Official Bank Rate, Unemployment Claims, Philly Fed Manufacturing Index, New Home Sales, Main Refinancing Rate, Monetary Policy Statement, ECB Press Conference
As we move deeper into a data-heavy week, markets are entering a phase where direction will be shaped less by headlines and more by the interaction between labor conditions, wage pressures, and central bank decision-making. The current environment remains fragile, with growth signals showing pockets of resilience while inflation dynamics continue to challenge policy flexibility. This creates a setup where even small deviations from expectations can trigger outsized market reactions across currencies, equities, and bond yields. We are particularly focused on how labor market data aligns with policy signals, as this combination will determine whether financial conditions tighten further or begin to ease.
GBP Claimant Count Change & Average Earnings Index
Labor market conditions remain a primary driver of policy expectations.
- If claimant count change comes in lower than forecast, it would signal fewer individuals relying on unemployment benefits, reinforcing the view of a tight labor market. When combined with higher-than-expected wage growth, this would strengthen inflation concerns, as rising incomes can sustain consumer demand and delay price normalization. In this scenario, interest rate expectations would likely shift higher, supporting financial stocks while pressuring interest rate-sensitive sectors such as real estate and high-growth equities.
- On the other hand, if claimant counts rise above expectations and wage growth softens, it would indicate easing labor conditions, reducing inflation pressure and potentially opening the door for policy easing, which would support broader equity markets.
Monetary Policy Summary, MPC Votes & Official Bank Rate
Central bank communication will be critical in shaping market direction.
- If the official bank rate is held higher than expected or if voting patterns show increased support for tighter policy, markets are likely to interpret this as a signal that inflation risks remain elevated. This would push bond yields higher and weigh on equity valuations, particularly in sectors dependent on cheap financing.
- However, if policymakers adopt a more cautious or dovish tone, even without cutting rates, markets may respond positively as expectations for future easing increase. The split of votes will be particularly important, as it provides insight into internal policy debates and the likelihood of future shifts.
Unemployment Claims & Philly Fed Manufacturing Index
Short-term economic momentum will be assessed through labor and manufacturing data.
- A lower-than-forecast unemployment claims figure would reinforce the strength of the labor market, supporting consumer spending but also raising concerns about sustained wage-driven inflation. This could limit the potential for near-term policy easing.
- Conversely, a higher-than-expected reading would signal emerging weakness, potentially triggering a shift toward defensive sectors as growth concerns rise. For manufacturing, a stronger-than-expected Philly Fed reading would suggest improving industrial activity and support cyclical stocks, while a weaker print would reinforce concerns about slowing demand and pressure industrial and materials sectors.
New Home Sales
Housing data remains one of the most interest rate-sensitive indicators.
- If new home sales exceed expectations, it would suggest that falling mortgage rates are beginning to stimulate demand, providing support for homebuilders and related industries such as construction materials and home improvement. This would also signal improving consumer confidence in large-ticket purchases.
- However, if sales come in below forecast, it would confirm that affordability challenges persist despite lower rates, reinforcing the view that housing will continue to weigh on economic growth and limit upside in housing-related equities.
Main Refinancing Rate, Monetary Policy Statement & ECB Press Conference
Policy direction from the euro area will play a key role in global market alignment.
- If the main refinancing rate is higher than expected or if the policy statement emphasizes ongoing inflation risks, financial conditions are likely to tighten, supporting the currency but pressuring equity markets. A hawkish tone during the press conference would reinforce this dynamic, particularly if policymakers signal limited willingness to ease policy in the near term.
- Conversely, a more accommodative stance or lower-than-expected rate outlook would support risk assets by easing borrowing conditions and improving liquidity. The language used in forward guidance will be especially important, as markets are highly sensitive to any indication of future policy shifts.
Stock Market Performance
Indexes Rebound from April Lows, But Weak Breadth Signals Fragility
We are witnessing a strong recovery in all major equity markets since the low on April 8th, but we are also seeing underlying weakness in the markets, as indicated by the overall market structure. While the indexes are reflecting a recovery trend, the year-to-date numbers are mixed, and the drawdowns, both for the indexes and stocks, are indicating that the participation in the markets is still low. This underlying weakness in the markets, as indicated by the overall structure, is a clear sign that the current trend in the markets is not as strong as it appears, and it is prone to changes in the macro environment.
Here is a summary of the latest stock market performance for key indexes:
S&P 500: Headline Stability, But Limited Participation
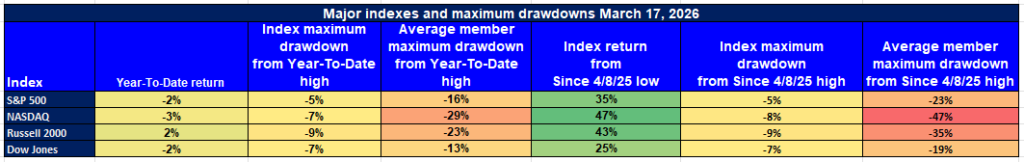
YTD: -2% | +35% off April low | -5% from YTD high | Avg. member: -16%
The S&P 500 index is reflecting a recovery trend, as indicated by the 35% rise since the low in April, but it is down 2% year to date. While the 5% drop from the year-to-date high indicates stability in the index, the average loss of 16% for the members indicates that the rise in the index is largely driven by a small group of stocks.
NASDAQ: Strong Rebound, But Deep Underlying Weakness
YTD: -3% | +47% off April low | -7% from YTD high | Avg. member: -29%
The NASDAQ index has reflected the strongest recovery, as indicated by the 47% rise since the low in April, but it is down 3% year to date. While the 7% drop from the year-to-date high indicates stability in the index, the average loss of 29% for the members indicates underlying weakness in the index, reflecting a recovery trend driven largely by a small group of stocks.
Russell 2000: Strong YTD Performance, Yet Vulnerability of Small Caps
YTD: +2% | +43% off April low | -9% from YTD high | Avg. member: -23%
The Russell 2000 is the standout performer with a 2% gain year-to-date, coupled with a 43% rise from April lows, which is a welcome sign of improvement in small cap sentiment. However, the 9% drop from the year-to-date high, as well as the average company’s 23% decline, indicate that small cap stocks are still under pressure, especially due to the worsening of financial conditions and lower earnings visibility.
Dow Jones: Defensive Strength, Limited Upside
YTD: -2% | +25% off April low | -7% from YTD high | Avg. member: -13%
The Dow Jones has a defensive profile with a 25% rise from April lows, although the year-to-date performance is flat at -2%. The 7% drop from the year-to-date high is a reflection of the overall weakness in the market, while the average company’s 13% decline points to some underlying weakness, especially in the value stocks that form the backbone of the Dow Jones.
We at Zaye Capital Markets remain cautious on the sustainability of this rebound. While momentum from April lows is strong, the lack of broad participation and persistent average stock declines indicate that market strength is still concentrated. We continue to favour high-quality companies with strong earnings visibility and balance sheet strength, while closely monitoring breadth indicators for confirmation of a more durable and inclusive market recovery.
The Strongest Sector In All These Indices
Energy Leads Sector Performance with the Clearest Strength Profile
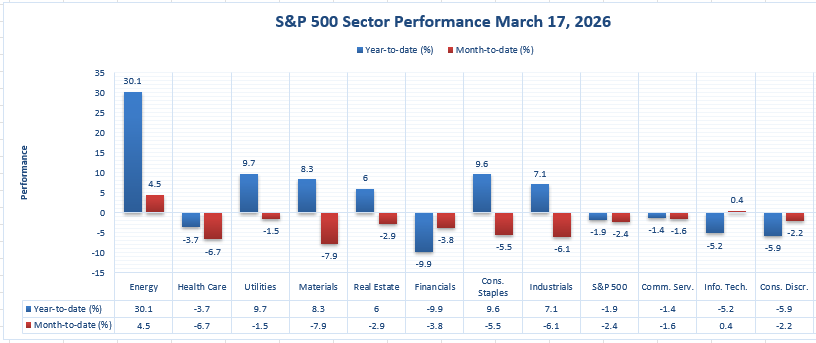
We are calling out Energy as the strongest sector in this overall market landscape based on hard numbers alone, as represented by the numbers in this chart. Of all the sectors represented in this chart, Energy has the highest year-to-date gain at 30.1% and a month-to-date gain of 4.5%, making it the only sector that has a double-digit advantage over all other sectors on a year-to-date basis while still being in positive territory on a month-to-date basis. The importance of this is that we are not just talking about year-to-date performance within this current year, but we are also talking about month-to-date performance, as opposed to other sectors that are still in positive territory on a year-to-date basis but are already in negative territory on a month-to-date basis.
This can be seen more clearly when one examines the next best year-to-date performers alongside Energy. Utilities are up 9.7 percent year-to-date but down 1.5 percent month-to-date. Consumer Staples are up 9.6 percent year-to-date but down 5.5 percent month-to-date. Materials are up 8.3 percent year-to-date but down 7.9 percent month-to-date. Industrials are up 7.1 percent year-to-date but down 6.1 percent month-to-date. Finally, Real Estate is up 6 percent year-to-date but down 2.9 percent month-to-date. This tells us that although there are other sectors and industries that are performing well over the year-to-date timeframe, Energy is the only sector that is performing well over the month-to-date timeframe as well. Even the S&P 500 itself is down 1.9 percent year-to-date and down 2.4 percent month-to-date.
From the perspective of Zaye Capital Markets, this tells us that Energy is the best-performing sector within the market at the moment. All the other sectors are performing more or less equally but are not doing as well as Energy. Health Care is down 3.7 percent year-to-date and down 6.7 percent month-to-date. Financials are down 9.9 percent year-to-date and down 3.8 percent month-to-date. Information Technology is down 5.2 percent year-to-date but up 0.4 percent month-to-date. Consumer Discretionary is down 5.9 percent year-to-date and down 2.2 percent month-to-date. Communication Services is down 1.4 percent year-to-date and down 0.6 percent month-to-date. When one sector is up 30.1 percent year-to-date and the rest are down or only marginally positive, then one can say that the sector leadership is narrow and concentrated. Therefore, from the perspective of Zaye Capital Markets, the best sector within the sector chart above is Energy.
Earnings
Yesterday’s Earnings (18-Mar-2026) – Mixed Signals Across Cyclical and Consumer Names
- Micron Technology (MU) continues to demonstrate strong momentum driven by data center and artificial intelligence demand. Recent figures show revenue reaching $9.30 billion in a prior comparable quarter, with GAAP net income at $1.89 billion and non-GAAP net income at $2.18 billion. This follows full-year revenue of $25.11 billion, confirming a recovery cycle in memory pricing. The key factor remains sustained demand from AI infrastructure, with analysts needing to closely monitor pricing trends, supply discipline, and margin expansion to assess the durability of this upcycle.
- Prudential plc (PUK) delivered a strong full-year performance, reinforcing stability in insurance and asset management flows. New business profit reached $2,782 million, while adjusted operating profit after tax stood at $2,772 million. IFRS profit rose sharply to $4,119 million, with earnings per share at 154.2 cents. The company also increased its dividend to 26.60 cents, supported by a strong free surplus ratio of 221%. The focus here remains on capital generation, regional growth exposure, and sustainability of profit expansion, particularly across its key Asian markets.
- Jabil Inc. (JBL) reflects continued strength in diversified manufacturing, although detailed recent quarterly figures remain more limited. Historical performance indicates consistent revenue growth supported by demand in cloud infrastructure, industrial applications, and electronics manufacturing services. The key factor for analysts is forward demand visibility, margin stability, and exposure to high-growth segments such as AI and digital infrastructure, which will determine whether earnings momentum can be sustained in a mixed global demand environment.
- Williams-Sonoma (WSM) highlights a more cautious consumer backdrop, with comparable brand revenue declining by 1.6% despite maintaining strong profitability. Gross margin remains elevated at 46.5%, while diluted earnings per share reached $8.79, reflecting effective cost control and pricing strategy. The company continues to show resilience through margin expansion despite weaker demand trends, but analysts should closely watch consumer spending patterns, inventory management, and housing-related demand, as these will drive future performance.
Today’s Earnings (19-Mar-2026) – Key Signals from Global Demand and Consumer Strength
- Alibaba Group Holding Limited (BABA) will be closely watched for signals on consumer demand recovery and e-commerce growth trends. The key focus will be on revenue growth stability, cloud segment performance, and margin recovery, particularly as competitive pressures remain elevated and macro conditions continue to influence spending patterns across its core markets.
- Accenture plc (CAN) will offer a clear read on enterprise spending, especially in digital transformation and cost optimization projects. Investors should focus on booking trends, pipeline strength, and pricing power, as these indicators will reveal whether corporate clients are maintaining or delaying technology investments in the current environment.
- FedEx Corporation (FDX) will serve as a proxy for global trade and logistics activity. Shipment volumes, pricing trends, and cost control measures will be critical in assessing whether global demand is stabilizing or still under pressure, particularly as supply chains continue to adjust to evolving economic conditions.
- Darden Restaurants, Inc. (DRI) will provide insight into consumer spending patterns within the dining sector. Same-store sales growth, traffic trends, and margin performance will be key indicators of consumer confidence and discretionary spending strength, especially as cost pressures and pricing strategies continue to influence demand behavior.
Stock Market Overview – Thursday, 19 March 2026
U.S. equity markets are trading under pressure as investors react to rising inflation signals, elevated energy prices, and reduced confidence in near-term rate cuts. The latest policy tone has reinforced uncertainty, while geopolitical tensions continue to feed into commodity markets, creating a difficult backdrop for risk assets. At Zaye Capital Markets, we are observing a market that is no longer driven purely by growth expectations but is now being shaped by cost pressures, rate sensitivity, and selective capital rotation.
Stock Prices
Economic Indicators and Geopolitical Developments
Today’s market tone reflects a combination of stronger-than-expected producer inflation and ongoing geopolitical tensions impacting key energy routes. Rising energy costs are feeding directly into inflation expectations, while central bank caution is reducing the likelihood of near-term easing. This has pushed bond yields higher, tightening financial conditions and putting pressure on equity valuations, particularly in growth-heavy segments. At the same time, mixed economic data across labor, housing, and manufacturing continues to create uncertainty around the strength of the underlying economy, leading to more defensive positioning across markets.
Latest Stock News
- $NVDA | Nvidia remains at the center of the artificial intelligence cycle, with its latest Rubin architecture highlighting significantly higher memory requirements, reinforcing demand for high-bandwidth memory and DRAM across the ecosystem. At the same time, the company has secured approval to sell H200 chips into China while adapting chip variants for broader market access, supporting international demand despite regulatory constraints. These developments come as hyperscalers accelerate infrastructure buildouts, intensifying supply bottlenecks and strengthening Nvidia’s strategic positioning within the AI hardware stack.
- $AMD | AMD is actively addressing supply constraints by engaging in high-level discussions with Samsung to secure high-bandwidth memory supply, a critical component for next-generation AI chips. The outcome of these negotiations will be key in determining AMD’s ability to compete effectively in the accelerating AI hardware market, where supply limitations remain one of the biggest constraints on growth.
- $MSFT $GOOGL $AMZN $META | The largest technology platforms are increasingly shifting toward vertical integration in artificial intelligence, investing heavily in custom chip development and infrastructure to reduce reliance on external suppliers. This strategic pivot is driving a surge in capital expenditure, raising investor concerns about near-term margins while reinforcing long-term competitive positioning. At the same time, intensified competition for AI talent is evident, with major hiring moves and regulatory scrutiny around acquisitions potentially shaping future innovation cycles.
- $AAPL | Apple continues to face pressure alongside other large-cap technology names as valuation sensitivity increases in a higher-rate environment. Investor focus remains on demand stability, product cycles, and the company’s positioning within the evolving artificial intelligence landscape.
- $TSLA | Tesla is expanding its vertical integration strategy with plans for an advanced AI chip fabrication initiative, alongside a confirmed $4.3 billion battery manufacturing partnership aimed at scaling electric vehicle production. These developments highlight Tesla’s push to control critical components across both hardware and energy storage, although execution and timeline visibility remain key factors for investors.
- $PLTR | Palantir continues to strengthen its position within the artificial intelligence space, supported by strong growth expectations and expanding adoption of its AI platform across government and commercial clients. The company remains a key beneficiary of enterprise and institutional demand for data-driven decision systems, even as broader market rotations impact sentiment.
- $HIMS | Hims & Hers is positioning itself for a major shift in the weight-loss treatment market, with expectations of significant price reductions in GLP-1 therapies as supply improves. The company’s strategic alignment with branded treatments and broader distribution capabilities could drive demand expansion, although pricing dynamics will remain a critical variable.
The Magnificent Seven and the S&P 500

The “Magnificent Seven” — Apple, Microsoft, Nvidia, Amazon, Meta, Alphabet, and Tesla — are increasingly acting as a drag on the broader market after previously driving gains. This group’s sensitivity to interest rates is now becoming more evident, as higher yields compress valuations and reduce appetite for high-growth names. At the same time, rising capital expenditure commitments in artificial intelligence and ongoing supply chain constraints are beginning to pressure margins and near-term earnings expectations. While Nvidia has shown relative resilience due to strong demand visibility, the broader group remains under pressure, exposing the lack of widespread market participation. Until leadership broadens beyond these names, overall market performance is likely to remain uneven.
Major Index Performance as of Thursday, 19 March 2026
- S&P 500: Trading at 6,624.70, down 1.4%, reflecting broad weakness following inflation concerns.
- Nasdaq Composite: Trading at 22,152.42, down 1.5%, as large-cap technology stocks continue to face pressure.
- Dow Jones Industrial Average: Trading at 46,225.15, down 1.6%, marking a sharp pullback amid rising yields and geopolitical uncertainty.
- Russell 2000: Trading at 2,478.64, down 1.6%, highlighting continued sensitivity in small-cap stocks to tighter financial conditions.
At Zaye Capital Markets, we maintain a cautious stance. The current environment is defined by narrow leadership, persistent inflation risks, and elevated rate sensitivity. We continue to favour high-quality companies with strong pricing power and stable cash flows, while closely monitoring macro signals and breadth indicators for confirmation of a more sustainable and broad-based market recovery.
Gold Price: Why Gold Prices Stay Elevated Amid Inflation, War Risks, Policy Shift
Spot gold is currently trading at $4,850.06 per ounce (XAUUSD), holding firmly near elevated levels as markets continue to absorb a powerful mix of geopolitical escalation and persistent inflation pressure. The latest developments surrounding military operations, rising defense spending projections, and threats to critical energy infrastructure have reinforced global uncertainty, pushing investors toward safe-haven assets. At the same time, policy actions such as temporary shipping flexibility to stabilize fuel supply highlight that disruptions are real but not fully contained. This combination creates a layered risk environment where markets are not reacting to a single event but to an ongoing chain of instability. As a result, gold demand is being driven by institutional positioning rather than short-term speculation, with capital flowing into assets that can preserve value amid uncertainty. In parallel, stronger-than-expected producer inflation data and rising services cost expectations are signaling that inflation is not easing as smoothly as previously anticipated, reinforcing gold’s role as a hedge against purchasing power erosion.
At the same time, the interaction between inflation and interest rate expectations is shaping gold’s near-term direction. Elevated inflation readings are reducing confidence in immediate policy easing, which is keeping yields relatively high and creating intermittent pressure on gold. However, the broader macro setup is becoming increasingly complex. If upcoming economic data—such as labor market strength, wage growth, and central bank decisions—comes in stronger than expected, it could temporarily limit gold’s upside by pushing rate expectations higher. On the other hand, if data weakens while inflation remains elevated, the market could shift toward a prolonged high-inflation, low-growth environment, which historically supports sustained gold strength. Yesterday’s economic data already contributed to this narrative by reinforcing the idea that inflation remains sticky while growth signals remain mixed. This creates a structural backdrop where gold is supported from multiple directions: geopolitical uncertainty, persistent inflation, and policy constraints. The result is a market where gold is not just reacting to events but is being accumulated as part of a broader defensive allocation strategy, suggesting that current levels reflect a deeper shift in how investors are positioning within the global financial system.
Oil Prices: Why Oil Prices Swing With War Risk, Supply Tightness, Data Shifts
Crude oil is currently trading at $96.4 per barrel for WTI and $111.3 for Brent as of March 19, 2026, reflecting a market increasingly dominated by geopolitical risk premiums and supply-side uncertainty rather than purely demand-driven fundamentals. The ongoing escalation around key energy transit routes, particularly the Strait of Hormuz, continues to inject instability into global oil flows, with markets pricing in the possibility of disruption to a meaningful portion of supply. Recent policy actions—including temporary shipping flexibility measures—are attempting to stabilize near-term logistics, but they do not eliminate the structural risks tied to military operations, energy infrastructure threats, and broader regional tensions. Messaging around energy security and calls for increased fossil fuel production further confirm that supply concerns are not temporary but part of a wider strategic shift. At the same time, disciplined production dynamics from major exporters and limited immediate spare capacity are reinforcing a tight supply backdrop, ensuring that even small disruptions translate into outsized price reactions. This explains why oil continues to hold elevated levels despite intermittent pullbacks, as the market remains highly sensitive to every geopolitical development.
From a macro standpoint, yesterday’s stronger-than-expected inflation data has reinforced the role of energy as a key driver of broader price pressures, supporting oil through expectations of sustained cost inflation across the economy. However, this also introduces a feedback loop where higher oil prices contribute to tighter financial conditions, influencing growth expectations. Today’s economic data will be critical in shaping short-term direction. Stronger labor market readings, resilient wage growth, and firm manufacturing data would support demand expectations and likely push oil prices higher, as consumption outlook remains intact. Conversely, weaker data—particularly in housing or employment—could signal demand softening, which may cap upside temporarily but is unlikely to fully offset the ongoing supply risk premium embedded in prices. Inputs from major energy organizations continue to indicate that while demand remains relatively stable, supply flexibility is constrained, reinforcing a structurally tight market environment. At Zaye Capital Markets, we see oil positioned in a high-sensitivity phase where geopolitical escalation, inflation persistence, and macroeconomic data surprises are interacting simultaneously, creating sustained volatility and making directional conviction dependent on both supply disruptions and demand confirmation.
Bitcoin Prices: Why Bitcoin Moves With Fed Policy, War Risk And Liquidity Shifts
Bitcoin is currently trading around $70,890 as of March 19, 2026, with recent price action showing a mild decline of approximately 0.52% over the past 24 hours and intraday fluctuations between roughly $70,889 and $71,200. This price behavior reflects a market that is not collapsing but instead consolidating under macro pressure. The broader geopolitical backdrop—characterized by escalating military positioning, rising defense spending expectations, and continued uncertainty around key global conflict zones—is creating a risk-sensitive environment where capital initially rotates toward traditional safe-haven assets such as gold. Unlike gold, however, Bitcoin does not always benefit immediately from geopolitical stress, as it still trades with a strong correlation to liquidity conditions and investor risk appetite. At the same time, rising energy prices linked to these tensions are adding another layer of complexity, as they increase operational costs for mining activity and influence broader sentiment within the digital asset ecosystem. This creates a scenario where Bitcoin is caught between its long-term narrative as an alternative store of value and its short-term behavior as a liquidity-driven asset.
From a macro perspective, yesterday’s economic data—particularly the upside surprise in inflation—has reinforced expectations that interest rates may remain elevated for longer, which is typically a headwind for Bitcoin due to tighter financial conditions and reduced liquidity. The decision to keep rates unchanged further amplified this dynamic, triggering initial selling pressure before a stabilization phase as markets recalibrated expectations. Looking ahead, today’s economic data will play a decisive role in shaping near-term direction. Stronger-than-expected labor market data, firm wage growth, and resilient economic indicators would likely reinforce higher-for-longer rate expectations, limiting upside potential in the short term. Conversely, weaker growth signals combined with persistent inflation could shift market expectations toward future policy easing, which historically supports Bitcoin through improved liquidity and renewed risk appetite. This creates a dual-path environment where Bitcoin remains highly sensitive to macro signals rather than operating in isolation. At Zaye Capital Markets, we see Bitcoin positioned within a broader macro transition phase, where geopolitical risk, inflation persistence, and monetary policy expectations are interacting simultaneously, creating volatility but also reinforcing its relevance as part of a diversified allocation strategy in a rapidly evolving financial landscape.
Ethereum Prices: Why Ethereum Price Reacts To ETF Flows, Whales And Liquidity
Ethereum is currently trading around $3,850–$3,950 as of March 19, 2026, showing relative stability compared to broader crypto market volatility, but still operating within a macro-driven consolidation phase. Price action over the past week reflects a balance between institutional positioning and cautious sentiment tied to interest rate expectations and global risk conditions. Recent developments show that Ethereum is increasingly influenced by institutional capital flows, particularly through spot ETF-related activity and structured investment exposure, where inflows and outflows have remained mixed rather than directional. This indicates that large investors are actively managing exposure rather than exiting positions, creating a controlled trading range. At the same time, Ethereum continues to benefit from its foundational role across decentralized finance, staking, and tokenized ecosystems, which provides underlying demand support even as macro pressures weigh on sentiment. However, elevated interest rates and tighter liquidity conditions are limiting aggressive upside, as capital allocation decisions remain sensitive to yield dynamics and broader financial conditions.
Whale activity remains a key driver of short-term price movement, with recent on-chain data showing large holders actively rotating positions depending on market conditions. Accumulation phases have been observed during price dips, suggesting continued long-term conviction among major holders, while periodic distribution during rallies is contributing to short-term volatility and preventing sustained breakouts. This pattern highlights a market where smart money is strategically positioning rather than capitulating, reinforcing the idea of consolidation rather than structural weakness. Additionally, the interaction between Ethereum and Bitcoin remains important, as broader crypto sentiment continues to influence flows across digital assets. From a macro standpoint, Ethereum is highly sensitive to liquidity conditions shaped by inflation data and interest rate expectations. Stronger economic data and higher-for-longer rate expectations could cap upside in the near term, while any shift toward easing conditions or improved liquidity could unlock renewed demand. At Zaye Capital Markets, we see Ethereum positioned within a transitional phase where institutional flows, whale behavior, and macro conditions are converging, creating volatility but also reinforcing its structural role within the digital asset ecosystem.
