Where Are Market Today?
European and U.S. stock futures are opening flat today, suggesting that the markets are struggling to build on the gains made on Monday. As of this morning, S&P 500 stock index futures are flat, Nasdaq stock index futures are up 0.2%, and Dow stock index futures are down 0.3%, dragged down by deep after-hours losses in the healthcare sector. Meanwhile, FTSE 100 and DAX stock index futures are flat, suggesting a flat opening in Europe. The lack of direction in the markets today isn’t because earnings are weak. In fact, the earnings season so far has been excellent, with three out of four S&P 500 companies reporting better-than-expected earnings. The markets are flat today because investors are cautious ahead of the crucial Federal Reserve meeting scheduled this week. On Monday, the Dow closed higher by 314 points, and the S&P 500 closed higher by 0.5%.
One of the largest drags occurred towards the end of Monday’s session, as the Centers for Medicare and Medicaid Services proposed a lackluster 0.09% increase in Medicare Advantage payments for 2027. This led to significant declines in health insurance companies like Humana, down 12%, and CVS Health, down 10%. UnitedHealth’s decline in after-hours trading also weighed on Dow futures. This selling pressure in the healthcare space has spilled over into the broader equity market, particularly as this sector represents a significant weight within US and European indices. With tech darlings like Meta, Tesla, Microsoft, and Apple reporting this week, this could continue to fuel the Nasdaq, but this sector-specific risk may halt the advance of more diversified indices like the S&P 500 and Dow Jones.
On the international front, President Trump’s late-night announcement of proposed increases in tariffs for South Korean automobiles, pharmaceuticals, and lumber has created a fresh level of uncertainty for international trade. President Trump s proposal to increase tariffs from 15% to 25% stems from South Korea’s legislative delays in ratifying a trade deal. This fresh policy risk comes at a time when international supply chains have begun to normalize. European markets, particularly Germany’s DAX and France’s CAC 40, will continue to respond to changes in trade tensions, particularly for automobiles. This fresh news will likely weigh on industrials and exporters, and this may prompt a fresh level of risk-off investing in European equities, particularly in sectors like utilities and staples.
Moving forward, the first policy announcement of the year by the Federal Reserve will be a major market mover. Although the Fed is expected to hold interest rates steady at 3.5% to 3.75%, investors will be looking for any hints on when the Fed will begin to cut interest rates. Although the CME FedWatch tool shows that there will be two interest rate cuts in 2026, the Fed’s forward guidance could be the difference-maker for the markets’ near-term momentum. Meanwhile, the markets are also awaiting the release of the Consumer Confidence Index and the Case-Shiller Home Prices today, both of which could influence the markets’ direction depending on the response of consumers and housing markets to the current economic headwinds. At Zaye Capital Markets, we believe that the unchanged futures today are simply a sign of short-term indecision rather than a trend change, and the markets are holding their breath rather than stepping back.
Major Index Performance as of Tuesday, 27 Jan 2026
- Nasdaq: Trading around 23,601, modestly higher on investor appetite for select tech earnings and valuation resets
- S&P 500: Trading near 6,950, supported by cyclical strength and safe-haven inflows in metals and financials
- Russell 2000: Trading near 2,660, mixed performance showing relative small-cap resilience amid economic noise
- Dow Jones: Trading near 49,412, buoyed by defensive and industrial components
The Magnificent Seven and the S&P 500
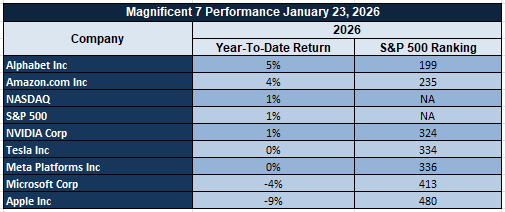
The Magnificent Seven, i.e., Apple, Microsoft, Nvidia, Amazon, Meta Platforms, Alphabet, and Tesla, have started 2026 with a mixed performance profile. Alphabet and Amazon are slightly positive year to date, while others are flat or underperforming. Tesla and Meta are struggling with margin pressure and weakening AI trade. This group, which has historically driven most of the S&P 500’s gains, is now a drag. This has raised concerns about dependency and the need to see sector leadership driven by earnings.
Drivers Behind the Market Move – Tuesday, January 27, 2026
The U.S. and European markets are moving cautiously ahead of major central bank announcements and critical corporate earnings, and investors are currently processing a mix of geopolitical events, tariff surprises, and initial indicators of stabilizing manufacturing activity. All of these factors are contributing to a tug-of-war that will ultimately determine market sentiments and directions in both regions.
1. Tariff Escalation and Trade Tensions with South Korea
President Trump’s announcement late Monday night to impose a 25% tariff, up from 15%, on South Korean autos, lumber, and pharmaceutical products caught investors off guard. The U.S. administration cited South Korea’s failure to promptly pass a pending trade agreement as a reason to impose a higher tariff. The move, however, raises questions about international cooperation in trade relations, which will likely affect market sentiments in the coming days. The U.S. market reacted to the news with a mixed bag, with Dow futures falling while Nasdaq futures managed to hold their ground slightly positive. The tariff increase, however, will likely affect European auto manufacturers with ties to South Korea and pharmaceutical companies with international operations. The U.S. market’s reaction to the news indicates a split market sentiment, with some investors expecting a positive outcome and others anticipating a negative market reaction. The tariff increase will likely be a major headwind, considering that trade tensions were slowly dissipating, and the global economy was showing early signs of improvement.
2. Healthcare Selloff and Sector Rotation Ahead of Earnings
Shares of major health insurance providers in the United States have fallen significantly during extended trading hours following a proposal by the Centers for Medicare & Medicaid Services to raise rates by a minimum of 0.09% for 2027 Medicare Advantage payments. The shares of Humana have fallen by over 12%, while CVS Health has lost nearly 10% during extended trading hours. The sharp decline in these shares has pulled down Dow futures. However, the optimism surrounding technology stocks remains intact, with Microsoft, Meta, and Apple set to announce their earnings results later this week. Around 90 S&P 500 companies are expected to announce their results this week, with 75% beating expectations so far. This gives bulls a chance to stand on firm ground, even though the overall market is witnessing a rotation towards defensive stocks.
3. Fed Watch, Manufacturing Data, and Policy Sensitivity
The overall market is on edge ahead of the Federal Reserve rate decision scheduled to be announced on Wednesday. The Fed is expected to keep interest rates unchanged at 3.5% to 3.75%. However, all eyes will be on changes to their statement and press conference that may indicate rate cuts later this year. The Dallas Fed Manufacturing Index came in at -1.2, beating forecasts of -8.5. The overall data suggests early signs of stabilization. New orders, production, and employment rose to positive readings, while price pressures increased. The overall market is witnessing a cautious trend due to rising political tensions and funding debates.
To conclude, it can be said that the overall trading narrative on the day is being driven by a three-way collision course involving tariff escalation, sector-driven volatility, and Federal Reserve sensitivity. While US and European futures are mixed, they reflect uncertainty about whether the economy can sustain its pace in the face of rising political tensions.
Digesting Economic Data
The TRUMP Tweets and Their Implications
The statements emanating from the White House this week on various issues, including domestic security, immigration, financial negotiations, and cultural issues, all point to a coordinated escalation of politics, which has significant implications for investors and markets. The announcement of the “largest tax refund season in history” appears to be a populist stimulus ahead of the midterm elections and is likely intended to energize Trump’s voter base and shift public opinion to issues of economic relief. The Trump administration’s call for increased federal deportations, direct appeals to Congress to eliminate sanctuary cities, and the deployment of Border Czar Tom Homan to Minneapolis to address immigration issues signal a renewed hardline stance on immigration. The Minneapolis shooting response has become the focal point of Trump’s law and order initiative. The deployment of federal agents, Trump’s public disagreement with Minnesota officials, and the connection of armed protesters to the Minneapolis shooting by GOP officials point to a calculated federal response to the situation. The White House’s messaging on this issue has been to emphasize a “defensive” posture while reasserting a multi-point plan to stabilize Minneapolis. The mixed messaging, embracing investigations while distancing themselves from their staff’s comments, appears to be an attempt to manage a media backlash and control the federal response to the situation. The administration’s need to control the messaging is also evident in Trump’s Twitter attacks on NFL rule changes, a low-cost initiative to generate cultural debate and control the national conversation.
What makes these developments market relevant, however, isn’t simply the content—but the concentration of political firepower within a narrow window. The administration’s efforts to combat violence come concurrent with efforts to press Congress to appropriate emergency funding and threaten the stall of DHS operations. This adds an additional layer of fiscal risk, increasing the probabilities of delayed spending flows, further polarization in budget negotiations, and downgrades in consumer and business confidence. The immigration crackdown and shutdown threat come as investors are already dealing with an economic slump and rising safe-haven flows into assets such as gold and cash equivalents. The market implications are obvious: the more shrill the federal rhetoric on immigration and border enforcement, the more likely the safe-haven flows become.
From an international perspective, the administration’s “open but firm” stance towards Iran underscores the geopolitical complexity of the situation. With U.S. officials continuing to reaffirm their stance towards Iran and the backchannel diplomacy, and business leaders uncomfortably responding to federal immigration enforcement efforts in Minnesota, international observers are once again concerned about the risks of U.S. domestic unrest spilling over into foreign policy. As international media continues to focus on the criticism of the administration’s strategy, the risk premium of political miscalculation continues to rise—now not merely in terms of election risk, but in terms of international alliances and trade flows.
Dallas Fed Manufacturing: Signs of Stabilization
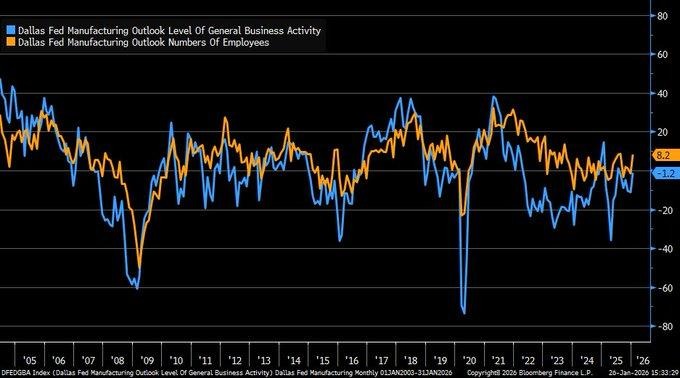
The latest Dallas Fed Manufacturing Index, published towards the end of January 2026, saw a small but important upside surprise that’s currently impacting short-term macro forecast assumptions. The headline figure rose to -1.2, substantially higher than the -8.5 estimate and an important increase from the previous month’s -11.3, which itself saw downward revisions from -10.9. Although the headline figure still technically indicates a contracting manufacturing sector, the size of the move and strength in key components are important signs that the Dallas Fed region’s manufacturing activity is moving towards stabilization. In terms of forward-looking indicators, new orders, production, shipments, and employment all turned positive, indicating early-cycle strength that’s been absent in recent months. From a regional macro perspective, this is the strongest sign in over a year that Texas-based manufacturing activity may be moving from recession-like conditions into expansion.
However, inflationary pressures are also re-emerging, as evidenced by inflationary pressures in prices paid and prices received, which ticked higher. This is an indication of cost pressures continuing in the supply chain, and this will likely catch the eye of the Fed as they continue to debate the timing of normalization of interest rates. Therefore, the inflationary pressures indicate that, although demand is increasing, pricing pressures are not abating, and this will have significant implications for the Fed’s window of opportunity for raising rates. From an investment standpoint, this raises the specter of “sticky inflation within growth pockets,” and this will likely keep interest rates higher for longer. Analysts should pay close attention to the correlation of this data with national data, including the ISM Manufacturing PMI, and subsequent Fed survey data, including the Philly and Empire State surveys, which will likely have a similar tone.
At Zaye Capital Markets, we continue to believe that Emerson Electric Co. (EMR) is undervalued in this environment. As an industrial automation and process control company, they are ideally positioned to take advantage of a rebound in manufacturing orders, particularly if labor costs continue to be an issue for employers and they continue to invest in automation. Therefore, this data has a high correlation with regional rebounds, including the Dallas Fed survey. Analysts should pay close attention to order backlogs, pricing discipline, and real capital investment signals in the coming weeks and months to determine if this is a trend or an aberration.
Business Investment Signals Durable Growth
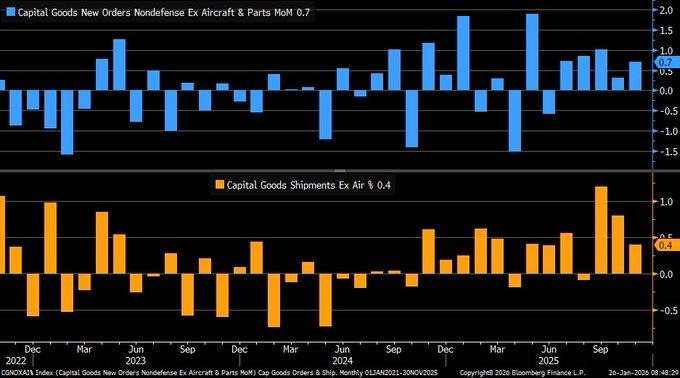
Core capital goods orders rose 0.7% month over month in November 2025, accelerating from the prior reading and extending the expansion streak to five consecutive months. This trend points to sustained business confidence and a willingness by companies to commit capital despite uneven global conditions. The broader rebound in durable goods orders was amplified by transportation demand, but the underlying takeaway remains the same: firms are still investing in productive capacity, suggesting that balance sheets remain healthy and longer-term demand assumptions have not materially weakened.
Shipments of core capital goods increased at a more measured pace, advancing 0.4% after a stronger October gain. We view this moderation not as a sign of slowing demand, but rather as evidence of timing effects tied to logistics and supply-chain normalization. Importantly, shipments continue to move higher alongside orders, reinforcing the idea that investment plans are translating into real economic activity. This combination of rising orders and steady shipments supports the view that manufacturing output remains resilient, even as companies remain selective in scaling production.
Given these dynamics, we see Caterpillar as undervalued. As a key supplier of heavy machinery tied to construction, mining, and industrial investment, the company stands to benefit directly from sustained capital spending cycles. Its global footprint and aftermarket services position it well to convert incremental equipment demand into recurring revenue. Analysts should closely track order backlogs, dealer inventory levels, and margin trends tied to pricing discipline. Monitoring whether capital goods orders continue to broaden beyond transportation will be critical in assessing the durability of this investment-led expansion.
Heavy Data Week Tests Rate Outlook
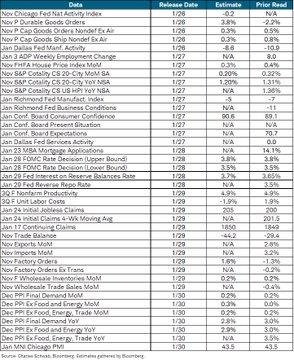
The upcoming data-heavy week concentrates market attention on policy signals, inflation trends, and household confidence, creating a compressed window for reassessing economic direction. A cluster of high-impact indicators—including interest-rate guidance, price pressures at the producer level, and sentiment readings—sets the stage for potential repricing across equities and rates. With expectations already embedded in markets, even modest deviations from forecasts could carry outsized influence, particularly in sectors sensitive to financing costs and demand durability.
We view the balance of risks as skewed toward mixed but stabilizing outcomes. Inflation-related indicators are expected to show moderation rather than acceleration, while activity data such as capital goods orders and jobless claims may signal resilience without overheating. This combination reinforces a “higher-for-longer but closer-to-neutral” policy narrative, where restrictive conditions gradually ease without a sharp pivot. For markets, the key issue is not a single release but whether multiple data points collectively confirm slowing price pressure alongside steady economic momentum.
In this environment, we see Home Depot as undervalued. As a company closely tied to housing turnover, renovation demand, and consumer confidence, it stands to benefit disproportionately from even incremental clarity on rate stability. Valuations already reflect caution around borrowing costs, leaving room for upside if macro data supports easing financial conditions. Analysts should focus on forward guidance tied to housing-related spending, same-store sales trends, and sensitivity to rate-driven demand shifts. Monitoring how consumer confidence aligns with real spending behavior will be critical in determining whether discretionary-linked equities can re-rate.
Upcoming Economic Events
President Trump Speaks, Consumer Confidence, Richmond Manufacturing Index
As markets enter a sensitive stretch defined by policy signals and confidence-driven data, the upcoming events carry outsized importance for short-term positioning and medium-term expectations. Investors are no longer reacting to isolated headlines but are instead assessing whether economic momentum, sentiment, and policy direction remain aligned. This week’s calendar offers a concentrated test of that alignment, with communication from political leadership, insight into household psychology, and a fresh read on regional manufacturing activity all arriving within a narrow window.
President Trump Speaks
President Trump’s remarks remain a critical catalyst for market sentiment, particularly when they touch on economic priorities, trade direction, and financial conditions.
- If the speech emphasizes growth support, easing financial pressure, or confidence in domestic economic strength, markets may interpret this as a stabilizing signal, potentially lifting equities and supporting rate-sensitive sectors. Such a tone would reinforce expectations that policy actions remain geared toward sustaining expansion rather than restraining it.
- On the other hand, if the message highlights inflation risks, trade friction, or a more confrontational economic stance, investors could grow cautious, triggering volatility and a rotation toward defensive assets. Analysts should closely evaluate whether the speech provides concrete policy cues or timelines, as actionable guidance tends to carry far more weight than broad rhetoric.
Consumer Confidence
Consumer confidence is a key forward-looking indicator for spending behavior, which remains a primary engine of economic activity.
- A reading that exceeds forecasts would suggest households feel secure about income stability and employment prospects, reinforcing expectations for steady consumption. This outcome would likely support discretionary and services-oriented stocks, as it signals resilience in demand.
- Conversely, a weaker-than-expected print would raise concerns that rising costs or uncertainty are beginning to weigh on sentiment, potentially leading consumers to delay spending. In that case, markets may reassess growth assumptions, placing greater emphasis on defensive sectors and companies with pricing power and stable cash flows.
Richmond Manufacturing Index
The Richmond Manufacturing Index offers a timely snapshot of regional industrial conditions, capturing trends in production, orders, and business sentiment.
- A stronger-than-forecast result would point to improving operational momentum among manufacturers, supporting the broader narrative of industrial stability and encouraging risk-taking in cyclical sectors. It would also reinforce confidence that investment and production pipelines remain intact.
- If the index falls short of expectations, it may signal softening demand or margin pressure at the factory level, prompting caution toward industrial and materials-linked equities. Analysts should watch whether any weakness appears transitory or consistent with broader manufacturing data, as that distinction will shape how markets interpret the signal.
Taken together, these events will help determine whether confidence, production activity, and policy direction are reinforcing one another or beginning to diverge. How markets respond will depend not just on the data itself, but on the story it collectively tells about economic durability and risk appetite.
Stock Market Performance
Indexes Push Higher from April Lows, But Drawdown Gaps Reveal Fragile Breadth
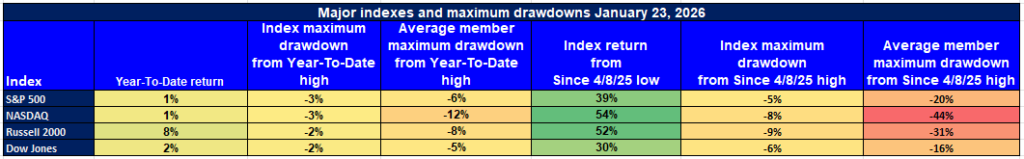
Equity benchmarks have staged a strong rebound since the 4/8/25 low, yet year-to-date progress remains modest across several indexes. The bigger message in this table is not the headline rally, but the persistent gap between index-level resilience and average member drawdowns—an ongoing signal that leadership is still concentrated and broader participation remains uneven.
Here’s our read of the latest performance across key indexes:
S&P 500: Small YTD Gain, Strong Rebound Since Low
YTD: +1% | Max drawdown from YTD high: -3% | Avg. member: -6%
Return since 4/8/25 low: +39% | Max drawdown since low: -5% | Avg. member: -20%
We see a stable index profile, but the average stock is clearly carrying more stress than the headline suggests. Analysts should watch whether average member drawdowns begin narrowing, because that would confirm healthier breadth behind the rally.
NASDAQ: Biggest Rebound, Weakest Internal Damage
YTD: +1% | Max drawdown from YTD high: -3% | Avg. member: -12%
Return since 4/8/25 low: +54% | Max drawdown since low: -8% | Avg. member: -44%
This is the clearest “index strength versus member pain” setup in the table. Analysts should focus on whether participation improves beyond a narrow group of leaders, because the average member drawdown remains severe despite the strong rebound.
Russell 2000: Best YTD, But Volatility Still Embedded
YTD: +8% | Max drawdown from YTD high: -2% | Avg. member: -8%
Return since 4/8/25 low: +52% | Max drawdown since low: -9% | Avg. member: -31%
Small caps show the strongest year-to-date gain, but the deeper post-low drawdown profile and weaker average member performance suggest choppy undercurrents. Analysts should watch whether average member drawdowns improve alongside the index, which would signal stronger risk appetite and a more durable broad-based move.
Dow Jones: Steadier Profile, Cleaner Risk Containment
YTD: +2% | Max drawdown from YTD high: -2% | Avg. member: -5%
Return since 4/8/25 low: +30% | Max drawdown since low: -6% | Avg. member: -16%
We view this as the most contained drawdown structure in the group, with less internal damage than the growth-heavy benchmark. Analysts should watch for continued stability in average member drawdowns, because that would reinforce the case for steadier leadership rather than a fragile, narrow rally.
At Zaye Capital Markets, we remain selective: the rebound is real, but the drawdown dispersion between indexes and average members suggests the market is still leaning on leadership concentration rather than broad participation.
The Strongest Sector in All These Indices
Energy Leads Year-to-Date, While Materials Drives the Latest Momentum
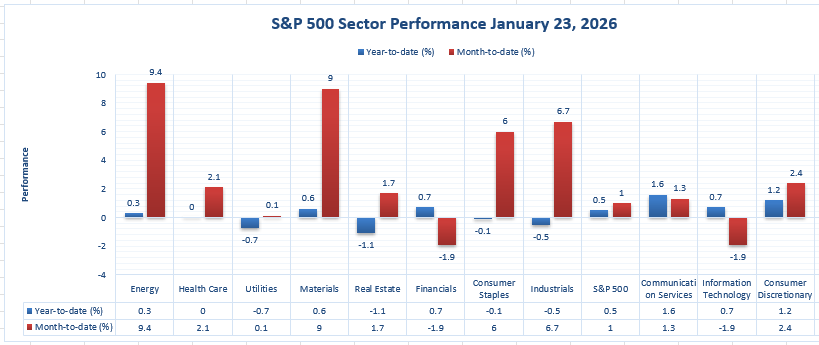
At Zaye Capital Markets, we interpret this sector snapshot as a clear example of split leadership between sustained performance and short-term momentum. On a year-to-date basis, Energy stands out as the strongest sector, while Materials is capturing the most immediate upside on the latest trading session. This reinforces our view that leadership remains selective, with strength concentrated in areas tied to pricing power, physical demand, and real-economy activity rather than broad-based market participation.
Energy: The strongest year-to-date sector
Year-to-date: 10.1% | 1/23/2026: 0.6%
Energy leads all sectors with a 10.1% year-to-date gain, the highest figure on the chart. The additional 0.6% advance on 1/23/2026 confirms that leadership remains intact rather than fading. This level of outperformance is especially notable when compared with the broader S&P 500, which is up just 1.0% year-to-date. The gap highlights how heavily overall market returns are being supported by a narrow group of sectors, with Energy carrying a disproportionate share of index strength.
Materials: The strongest sector on the day
1/23/2026: 0.9% | Year-to-date: 10.0%
Materials posted the strongest single-day performance at 0.9%, while also sitting just behind Energy on a year-to-date basis at 10.0%. This combination is important, as it signals both momentum and durability. Unlike sectors showing short bursts without follow-through, Materials is exhibiting strength across timeframes. In contrast, several areas remain under pressure year-to-date, including Financials at -3.3% and Information Technology at -1.3%, reinforcing that current sector leadership is narrow and conviction-driven rather than broad and indiscriminate.
Earnings
Earnings Recap – Tuesday, 26-Jan-2026 (Recap)
At Zaye Capital Markets, we reviewed earnings released on Monday, January 26, 2026, which reinforced a market environment where execution quality continues to matter more than broad macro narratives. Results across industrials, banking, and insurance reflected resilience, though the strength remained selective rather than uniform.
- Steel Dynamics, Inc. reported earnings of 1.82 USD per share, exceeding the 1.70 USD estimate, delivering a +6.81% surprise, with a market capitalization of 25.31 billion USD. This upside surprise points to disciplined cost control and operational efficiency despite uneven steel pricing and mixed end-market demand. The result suggests margins remain defensible, with investors now focused on shipment volumes, pricing trends, and visibility around construction and industrial demand.
- Western Alliance Bancorporation delivered a solid fourth quarter and full-year 2025, reporting a 12.6% rise in quarterly earnings to 2.59 USD per share and net income of 293.2 million USD. Growth was driven by strong loan and deposit expansion, improved pre-provision net revenue, and disciplined cost management, while asset quality metrics remained stable. We also note positive momentum in non-interest revenue, reinforcing improving financial fundamentals as interest income stays elevated.
- W.R. Berkley Corporation reported earnings of 1.13 USD per share, matching the 1.13 USD estimate, resulting in a +0.21% surprise, with a market capitalization of 25.42 billion USD. While the beat was modest, the absence of downside is meaningful in a sector sensitive to claims volatility. The results suggest underwriting discipline remains intact, with investors watching premium growth and margin stability closely.
- Brown & Brown, Inc. posted earnings of 0.93 USD per share, above the 0.90 USD estimate, representing a +2.98% surprise, with a market capitalization of 27.18 billion USD. The earnings beat reflects continued fee resilience and operating leverage. Going forward, the sustainability of growth will depend on the balance between organic expansion and acquisition-driven contributions.
Earnings Preview – Wednesday, 27-Jan-2026 (Preview)
- For Wednesday, January 27, 2026, a heavy earnings slate is set to test sector leadership, margin durability, and guidance credibility across healthcare, aerospace, industrials, transportation, luxury goods, and utilities.
- UnitedHealth Group Incorporated is expected to draw investor focus on medical cost trends, enrollment stability, and margin guidance. The market will closely watch whether healthcare utilization remains manageable and whether forward guidance supports earnings visibility into the year ahead.
- RTX Corporation will be assessed through the lens of backlog conversion, defense demand visibility, and cost execution. Investors will focus on whether margin progress is keeping pace with revenue growth and whether supply-chain pressures continue to ease.
- Boeing Company (The) remains a critical earnings release, with attention centered on delivery volumes, cash flow trajectory, and operational execution. Guidance around production cadence and balance-sheet improvement will be key drivers of sentiment.
- HCA Healthcare, Inc. will be evaluated on patient volumes, pricing discipline, and labor cost trends. Investors will focus on whether margin pressures are stabilizing and whether demand remains resilient across care services.
- LVMH-Moët Hennessy Louis Vuitton will provide insight into global luxury demand, particularly consumer spending behavior across regions. Commentary around pricing power and inventory management will be central to the market’s reaction.
- Union Pacific Corporation is expected to shed light on freight volumes, pricing dynamics, and operating efficiency. Rail traffic trends and margin discipline will be closely watched as indicators of broader economic throughput.
- NextEra Energy, Inc. will be assessed on renewable project execution, regulated utility performance, and capital allocation discipline. Investors will focus on earnings visibility and long-term growth consistency amid evolving energy demand patterns.
Stock Market Overview – Tuesday, 27 Jan 2026
The US stock market opened on Tuesday with a cautiously optimistic tone, as investors are trying to balance positive expectations for corporate earnings against geopolitical risks and policy uncertainty. Despite this, the major stock market indexes have shown relative strength, although key sectors have seen mixed breadth, with safe-haven assets like gold and banking stocks benefiting while growth and AI stocks have faced pressure. At Zaye Capital Markets, we believe that the current market is one where macro catalysts, policy expectations, and leadership are all important drivers of the market, particularly as we approach the middle of the corporate earnings and Fed decision-making process.
Stock Prices
Economic Indicators and Geopolitical Developments
The tone in the stock market today is driven by a mix of positive expectations for corporate earnings and ongoing geopolitical risks. Investors are preparing for major tech and corporate earnings releases this week, which could lead to higher volatility, while geopolitical risks related to US-China tariff policies and funding issues continue to weigh on the market and drive safe-haven demand for precious metals and other traditional havens. The sharp move higher in precious metals as alternative value stores is a key part of the market tone, although the major stock market indexes have shown relative strength. As rate expectations and policy uncertainty remain front and center, key sectors have seen mixed breadth, and risk pricing is being driven by macro catalysts and geopolitical risks.
Latest Stock News
The Trump administration announced plans to hold Medicare reimbursement rates steady in 2026, a move that is well below market expectations and sent health insurers sharply lower. $UNH, or UnitedHealth, fell about 8% after hours as investors adjust their revenue expectations related to Medicare Advantage plans.
$MSFT, Microsoft, announced its Maia 200 AI inference chip, built with $TSM’s 3nm process, now deployed in Microsoft’s U.S. Central data centers. This puts Microsoft in a stronger position to capture a greater share of the exploding AI inference market.
The cloud infrastructure market continues to be a race to scale: Azure demand is running ahead of Microsoft’s ability to scale, just like $AMZN’s AWS and $GOOGL’s Cloud. The faster they deploy, the greater share they will win in AI services.
$AMZN’s ad business, currently a $65B business and growing at 24%, is acting as a stabilizer ahead of earnings, as it allows them to monetize users at the point of purchase, unlike digital ads, which are more cyclical in nature.
OpenAI’s goal is to achieve ~$60 CPMs within ChatGPT, significantly higher than $META’s sub-$20 CPMs. The reason $META can achieve sub-$20 CPMs at scale is because they will be able to monetize AI users, which will be a premium to traditional digital ad revenue.
$NVDA, NVIDIA, is investing $2B in $CRWV, CoreWeave, to co-build 5+ GW of AI factories by 2030, as GPU rental prices surge after OpenAI’s release of Claude Opus 4.5. The upside here will be to smaller infrastructure players like $NBIS, $IREN, and $CIFR, as supply remains constrained.
$IONQ, IonQ, is purchasing chipmaker $SKYT, a ~$1.8B or $35/share deal, which will provide a domestic chipmaker that’s essential to scale within U.S. federal and defense contracts. This will instantly make them a U.S.-based quantum chipmaker, a huge strategic move to deploy within the U.S.
$RKLB, Rocket Lab, announced that it has completed a reusable 14-meter “Hungry Hippo” fairing, which will be deployed to Launch Complex 3 in Virginia. This will be the first commercial fairing designed to deploy a payload and then return to Earth, a huge step forward in vertical integration within launch hardware.
The Magnificent Seven and the S&P 500

The Magnificent Seven, i.e., Apple, Microsoft, Nvidia, Amazon, Meta Platforms, Alphabet, and Tesla, have started 2026 with a mixed performance profile. Alphabet and Amazon are slightly positive year to date, while others are flat or underperforming. Tesla and Meta are struggling with margin pressure and weakening AI trade. This group, which has historically driven most of the S&P 500’s gains, is now a drag. This has raised concerns about dependency and the need to see sector leadership driven by earnings.
Major Index Performance as of Tuesday, 27 Jan 2026
- Nasdaq: Trading around 23,601, modestly higher on investor appetite for select tech earnings and valuation resets
- S&P 500: Trading near 6,950, supported by cyclical strength and safe-haven inflows in metals and financials
- Russell 2000: Trading near 2,660, mixed performance showing relative small-cap resilience amid economic noise
- Dow Jones: Trading near 49,412, buoyed by defensive and industrial components
According to Zaye Capital Markets, this market is balancing selective risk-on with caution. The market conditions are favorable to maintain disciplined positioning around earnings, risk assets with strong margin clarity, and diversification to assets that are less sensitive to political and regulatory changes.
Gold Price: Why Gold Prices Are Rising on Political Risk and Economic Signals?
Currently, the spot price of gold is holding steady at about $5,070 per ounce, near record highs as investors are factoring in high levels of political risk and macroeconomic risk sensitivity. The latest series of announcements from the White House, covering domestic security initiatives, immigration policies, the urgency of government spending, and diplomatic pressure, have all contributed to an environment of political tension. This environment is supportive of the price of gold as a safe haven asset within the overall financial ecosystem. The economic events scheduled to occur today, including the President’s announcements, consumer confidence data, and the Richmond manufacturing index, are all contributing to near-term price volatility. If consumer confidence or regional manufacturing data is lower than expected, this would reinforce the narrative of lower economic growth and would support the price of gold as investors seek safe haven from economic headwinds. If economic data is stronger than expected, this would cap the price of gold but would not be enough to reduce the price of gold given the current levels of political tension. Yesterday’s economic data is continuing to drive the overall sentiment that is supportive of the price of gold. The overall mix of economic data, including robust capital investment data, mixed labor data, and mixed consumer confidence data, is creating an environment where the sustainability of economic growth is being questioned. In this environment, the price of gold is benefiting from the overall convergence of political risk, economic growth risk, and overall portfolio risk as investors seek safe haven from economic headwinds. The price of gold is currently reflecting the overall environment of political tension, economic uncertainty, and overall risk sensitivity. The current price of gold is not just reflecting the current environment but is also reflecting the overall uncertainty with regard to fiscal policy, economic confidence, and geopolitical risks.
Oil Prices: Why Oil Prices React to Trump’s Policies, OPEC Cuts, and Demand Data
Currently, the price of oil is stuck in a tight but tense range, with WTI crude priced around $60.39 per barrel and Brent crude priced around $65.31 per barrel. This is due to the tug of war between supply and demand factors. The OPEC+ group is reportedly sticking with their output cuts through March 2026, which is supporting the price of oil after a series of supply disruptions, including the outage in the Kazakh Tengiz field and the severe winter storms in the US that impacted refining operations in key regions in the US Gulf Coast. Although the International Energy Agency is still predicting that the demand for oil will rise by 930,000 barrels per day in 2026, the supply is increasing much faster than the demand. This is creating tension in the price of the commodity. The latest series of statements emanating from the White House, including Trump’s push for strict border policies, the threat of policies that support sanctuary cities, and the aggressive push for immigration policies, are all creating tensions in the price of the commodity. Oil is a macro barometer that is sensitive to all these factors.
Meanwhile, oil traders are closely monitoring the latest U.S. macro data for further guidance on the trends of consumption. The latest data on durable goods, which showed strength in capital spending but weakness in consumer confidence and jobs, introduced further ambiguity. The demand side of the equation still appears to be quite weak, and energy investors are being cautious about fully committing to crude until there is further clarity on whether the economy warrants the increase in consumption. The key economic data releases today are Consumer Confidence and the Richmond Manufacturing Index. These releases will provide further guidance on the strength of demand for industrial goods. If the data disappoints, the fears of slowing growth may return and weigh on crude prices. On the other hand, if the data surprises to the upside, crude prices may receive some support, at least in the short term, if the data translates into further increases in transportation and industrial fuel demand. The latest political developments in the United States, including the risk of a government shutdown and foreign policy brinksmanship, have reinforced the volatility profile of crude prices. This is especially true as the projections of OPEC+ and the IEA start to diverge. Oil prices are currently trading in a range, but the underlying volatility indicators suggest that any surprise, whether it is geopolitical or economic, may trigger a sharp move.
Bitcoin Prices: Why Bitcoin Is Struggling Below $90K Despite ETF Flows and Fed Caution
Bitcoin’s price currently stands at 88,589, rising slightly after rebounding from one-month lows of 86,000. The price continues to face immense volatility, and there’s no sign of any breakout. The price is still heavily influenced by various factors, including macro pressures, mixed institutional sentiment, and rising political risks. Spot Bitcoin ETF outflows were observed in the latest trading session on January 26. This has put downward pressure on the price. Despite this, some institutional investors are calling Bitcoin undervalued following the recent sell-off. Analysts are observing consolidation near key support levels. Liquidation pressures are easing somewhat. The market volume remains stable amidst the price dip. This indicates some buying activity at lower prices. This has not been enough to overcome the overall market sentiment. The prices are still trading in a wide and choppy range of 86,000 and 93,000. The crypto market strategists have stated that the prices are still sensitive to market liquidity. This comes amid the Federal Reserve’s upcoming decisions. The decisions are likely to clarify their rate direction for Q1. This will have implications for all risk assets. The prices are still volatile and have shown no signs of any breakout. The market is keeping an eye on the options flows and the January 30th window.
In addition to this, a string of high-pressure statements from President Trump on domestic policy has created a wave of political risk that is deterring risk-takers from high-beta assets across financial markets. While Bitcoin has benefited from this risk-off sentiment as a store of safe-haven risk, it has also displayed caution as risk assets are being taken out of safe-haven positions and being moved to more defensive positions. Yesterday’s economic data has created more uncertainty and volatility in financial markets, with capital goods orders increasing while consumer sentiment was lower and jobless trends were mixed. This has created a sideways movement in Bitcoin prices as traders are unwilling to open positions before today’s economic data release, which includes the CB Consumer Confidence Index and the Richmond Fed Manufacturing Index. A worse-than-expected result will accelerate a downside move as liquidity dries up and fear mounts, while a better result will trigger a short-term upside move as risk-takers become more confident. Even then, Bitcoin faces technical resistance from a recent ETF-driven selloff and a wave of caution from risk-takers.
ETH Prices: What Whale Buying and ETF Outflows Reveal About Ethereum Price Trends
Currently, the price of Ethereum is trading at $2,939, with intraday price volatility keeping the asset stuck at levels below the critical $3,000 resistance mark. So far, ETH has mounted multiple rallies this month, with the latest attempt at breaking through resistance coming on January 15. Unfortunately, each attempt has ended with the price stuck at critical supply levels, with each attempt at rallying being followed by increased selling pressure that has turned what started off as a momentum play into a temporary bull trap. More recently, on-chain data has emerged as an increasingly significant factor in determining the price trends of ETH and other cryptocurrencies. Whale accounts have been buying large amounts of ETH, with data indicating that one whale recently bought 20,013 ETH worth $59 million. Other similar whale buying patterns have emerged, indicating that the whales are accumulating large amounts of ETH at critical levels. Unfortunately, despite the positive sentiment that has emerged from whale accounts, Ethereum ETFs have recorded outflows, with the January 26 trading session witnessing consistent outflows from Bitcoin and Ethereum ETFs as market participants liquidate large-cap crypto exposure due to policy uncertainty, rate sensitivity, and macro hedging preferences. ETH finds itself at a critical juncture, with significant support emerging from whale accounts and long-term holders, while at the same time struggling with liquidation and ETF outflows that have resulted in the price trading at levels between $2,850 and $3,050.
These technical and positioning dynamics are now being complicated by the political and economic developments that are creating additional uncertainty in the near-term outlook for ETH. The renewed focus on immigration crackdowns, federal enforcement activities, and shutdown prevention efforts from the White House, combined with Trump’s aggressive push on domestic crime policy, has contributed to risk-off behavior in the overall financial markets. Yesterday’s mixed economic data out of the United States, which saw strong capital goods investment but weaker consumer sentiment, has done little to calm the nerves of investors. Today’s consumer confidence and manufacturing sentiment data will be crucial in determining the near-term outlook for ETH as we head into the week’s end. If economic data surprises to the downside, it could be interpreted as economic stagnation, causing investors to de-risk their crypto portfolios, which could have bearish implications for ETH prices near support. Alternatively, if economic data is interpreted as showing strength in industrial or consumer sectors, we could see a near-term rotation back into ETH as a high beta growth proxy, especially considering the fact that whales are already stepping in to buy supply below $3,000. The near-term outlook for Ethereum is one of a battle between structural accumulation and outflows, with macroeconomic catalysts now determining which side is winning the battle.
