Where Are Markets Today?
European and U.S. stock futures are trading near flat to mixed levels, indicating that the market is preparing for the opening bell on Tuesday. This comes at a time when trade tensions and uncertainty surrounding technology sectors continue to impact market dynamics. Futures contracts for the Dow Jones Industrial Average, S&P 500, and Nasdaq 100 indices are trading higher by around 0.1%, indicating that investors might be looking to stabilize the market after witnessing significant losses on Monday, when all major U.S. indices closed sharply lower due to risk-off sentiment. This near-flat opening suggests that investors remain uncertain and that the market is vulnerable to external factors rather than exhibiting any significant market bias.
The main reason for this near-flat opening is that renewed trade tensions and trade policies have impacted investor sentiment. Recently, President Trump threatened to impose higher tariffs on global nations under different trade laws after the U.S. Supreme Court struck down his authority to impose emergency tariffs. This renewed fear of trade tensions and its subsequent impact on global economic growth, production costs, and international supply chains has impacted traditional risk assets and technology and software sectors, while also driving safe-haven assets higher. Along with this, investors are also concerned about artificial intelligence disruption risk, which has impacted sectors that might be vulnerable to slowing economic growth.
Another contributing factor to the market dynamics is the varying market and capital flow trends across regions. Although European markets are seeing record levels of investments in equities, especially in banking, resources, and defense, which are part of a larger diversification drive, the US markets are dealing with a challenge of leadership weakness and risk reduction due to significant losses in mega-cap tech stocks. The flat levels of European and US futures are a reflection of a balance between fresh investments in these relatively lower rate-sensitive segments and risk reduction due to the risk of policy actions that could curb demand growth. The technical levels of these markets are showing a wait-and-watch approach, with market players waiting for a signal from upcoming macroeconomic releases and earnings announcements to confirm market direction.
Furthermore, the near-flat levels of the futures market are a reflection of the larger cross-asset market trends, such as the recent jump in oil prices to their highest levels in seven months due to geopolitical tensions, which are a reflection of the larger market uncertainty and are influencing risk appetite across equities, commodities, and bonds.
Major Index Performance as of Tuesday, 24 Feb 2026
- Nasdaq Composite: ~22,400, down over 1% as tech and growth stocks give back recent gains.
- S&P 500: Modestly lower as selling pressure across the market persists.
- Russell 2000: ~2,607.33, extending recent small-cap selling pressure.
- Dow Jones Industrial Average: ~48,000, weighed down by selling pressure in the cyclical and financial sectors.
The Magnificent Seven and the S&P 500

The Magnificent Seven, consisting of Apple, Microsoft, Nvidia, Amazon, Meta, Alphabet, and Tesla, continue to dominate market direction for the S&P 500 index. Nvidia dominates AI infrastructure flows, and the others are being tested on their margins and ability to be monetized. Any significant weakness in these names, especially within the core group of the Magnificent Seven, is exerting pressure on the S&P 500 and the Nasdaq Composite, highlighting the importance of these seven stocks on market direction.
Drivers Behind the Market Move – Tuesday, February 24, 2026
As U.S. and European markets continue to work their way through renewed trade rhetoric, macro data risk, and sector-specific volatility, positioning for investors today is one of caution rather than conviction, with futures trading near flat after yesterday’s significant moves. The trade rhetoric, mixed economic data, and rotations out of concentrated technology sectors continue to drive asset class performance for both U.S. and European investors.
1. Trade Policy Escalation and Tariff Uncertainty
President Trump’s recent comments that nations “playing games” on trade will be subjected to higher tariffs, coupled with suggestions of additional license fees and alternative trade law usage, have once again injected uncertainty into global supply chains. The administration’s consideration of additional national security tariffs under Section 232 on batteries, industrial chemicals, power grid, and telecom equipment has added to concerns about cost pressures and margin compression for both U.S. and European businesses. This environment is supportive of defensive sectors while exerting pressure on trade-sensitive technology, industrial, and manufacturing sectors.
2. Mixed Economic Signals and Data Event Risk
The mixed regional data and subdued tone from consumers yesterday did little to change the narrative of a lackluster economic growth story. The focus today on US Conference Board Consumer Confidence and the Richmond Manufacturing Index adds another level of event risk. A soft reading will only heighten concerns of an economic slowdown, which will further pressure the shares of cyclical names. A strong reading will likely stabilize the market, but the focus will quickly turn to the rate debate. The parallel hearings for the GBP Monetary Policy Report will also introduce global rate narrative risk, which will impact currency dynamics between the US and European markets.
3. Technology Repricing and Sector Rotation
Global equity markets remain under the influence of the recent underperformance of large-cap technology and software names due to the disruption concerns arising from AI and earnings sensitivity. The significant declines seen in the US and global tech indices the previous day were a clear representation of the repricing of high-duration assets due to the pressure from policy and macro factors. The rotation of capital into the energy, defense, and value sectors also remains intact, as the focus shifts to earnings and balance sheet quality. The European markets have also seen some relative support from the banking and resource sectors, which has helped mitigate the negative impact from the US technology sector. This sector rotation is the key reason behind the flatness seen in the futures, which are not showing significant upside momentum.
In summary, the market movements seen today have been driven by the escalation of US tariff policy, mixed economic momentum, and sector-specific volatility. The investor environment remains one of policy and macro sensitivity, and the flatness seen in the futures is a representation of the market awaiting further confirmation from the economic data and earnings reports.
Digesting Economic Data
The TRUMP Tweets and Its Implications
The President’s declarations of National Angel Family Day and the renewed focus on immigration enforcement suggest a refined stance on domestic issues focused on border security and immigration reform. The President’s comments on the “largest mass deportation force ever assembled” and the need to increase the severity of “Kate’s Law” for those illegally reentering the U.S. reinforce the administration’s legislative agenda to tighten immigration controls. From a financial perspective, these statements may impact labor market expectations, particularly for industries dependent on immigrant labor such as agriculture, construction, and service industries. Tighter labor dynamics may be reflected in wage pressures within these industries, which could be factored into inflation sensitivity for these employers. At the same time, the administration’s statements on border security as a measure of U.S. strength contribute to the overall political certainty narrative.
The trade commentary within the President’s statements has the most direct cross-asset implications. The President’s comments on “countries playing games” on trade and the U.S. imposing higher tariffs on these countries, the suggestion of potential license fees to be imposed on these countries, and the President’s statements on using alternative trade laws “in a much more powerful way” suggest the administration’s willingness to escalate tariff leverage beyond prior statements. Typically, these statements are seen to have inflationary implications over the short term but negative economic implications over the long term. The tariffs on sectors such as batteries, industrial chemicals, power grids, and telecom equipment that are part of the potential Section 232 tariffs on imports to the U.S. based on national security concerns have direct implications for U.S.-based businesses using these inputs.
The renewed focus on the Supreme Court justices with regard to their rulings on tariffs, as well as the concern over the potential implications of any court decision with regard to birthright citizenship, adds an element of tension to the environment. The renewed commentary on the relationship between the branches of the U.S. government has the potential to recalibrate the risk associated with the execution of policy. The renewed commentary with regard to the need for Mexico to take a more active stance with regard to the cartel environment, as well as the recent military raids, adds an element of increased focus on the relationship between the U.S. and its southern neighbor. The increased focus on homeland defense has the potential to add an element of stability to the defense industry.
Finally, the administration’s decision to take a more active stance with regard to foreign funding of universities with the assistance of the State Department and with oversight of the National Security Council adds an additional element to the policy environment that extends beyond trade to other areas of the economy. The increased focus on compliance with regard to foreign funding has the potential to add an element of risk to the environment with regard to the relationship between the U.S. and other nations with regard to the technology sector. The renewed focus on the potential for new tariffs under Section 232 with regard to certain sectors of the economy adds an element of protectionism to the environment that has the potential to add an element of risk to the environment with regard to trade relationships with other nations.
Texas Manufacturing Moves Back Into Expansion, But Investment Hesitates
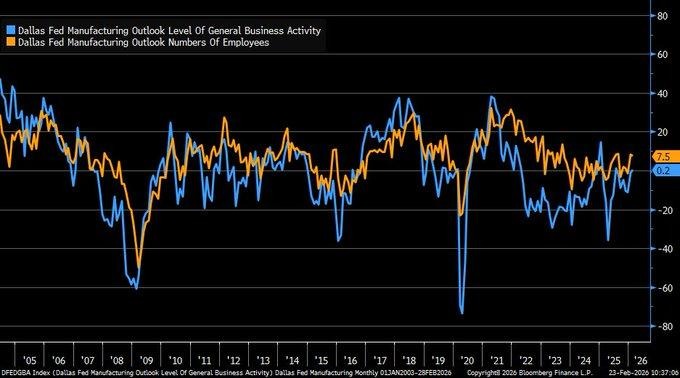
The manufacturing index, as reported by the Dallas Fed for February 2026, rose to +0.2 from -1.2 in the preceding month, beating market expectations and signaling a return to expansion for Texas manufacturing activity. Although the increase might not seem significant, the psychological impact of this improvement from contractionary territory to expansionary territory, after experiencing considerable volatility throughout 2025, is considerable. Production levels remained strong at 12.5, and the new orders level was unchanged at 11.1, indicating an improvement in demand pipelines rather than a weakening of the same. Texas manufacturing is an important bellwether for the manufacturing sector, given its exposure to energy equipment, machinery, and intermediate goods production, making it an early indicator of the sector’s sentiment. The stability in the demand pipeline, indicated by the unchanged level of new orders, suggests that clients are continuing to stick to their schedules despite the tightening of financial conditions and global demand crosswinds.
However, the underlying components show a different picture. Shipments have eased to 9.9, employment has weakened to 7.5, and capital expenditures have turned negative at -0.4. The weakening in the capex component is significant, as a sustained industrial recovery requires investments in plants, automation, and productivity improvements. Companies are apparently comfortable meeting existing demand but are not committing new capital for expansion. Past trends suggest this type of activity either precedes a stronger recovery if the national purchasing data confirms the trend, or it suggests a plateau if the demand picture deteriorates.
For equity markets, Emerson Electric Co. (EMR) seems undervalued relative to its long-term exposure to the automation theme and its cash generation ability. The company benefits from the spending trend driven by efficiency, even in a cautious approach to capital spending, as companies invest in productivity rather than expanding employment rolls. Analysts need to watch regional output trends, which gradually improve while employment trends are contained, and the exposure to the automation theme, especially durable goods orders, machinery spending, energy equipment spending, and forward-looking capital spending intentions to confirm if this stabilization marks the beginning of a new industrial recovery cycle.
Upcoming Economic Events
GBP Monetary Policy Report Hearings, CB Consumer Confidence, Richmond Manufacturing Index
As we move into a busy session filled with economic data, investors are gearing up for key events that could alter their expectations around economic growth, interest rate direction, and overall risk appetite. Central bank communication out of the United Kingdom will influence currency and interest rate markets, while consumer confidence and regional manufacturing activity will provide forward-looking data on consumer demand and industrial activity. As we continue to navigate an environment where equity markets remain sensitive to interest rate direction and earnings estimates, even small surprises around these key events could impact sector rotation. Below, we outline how surprises around these events could impact financial markets.
GBP Monetary Policy Report Hearings
Monetary policy hearings can often move financial markets based upon changes in tone, emphasis, and forward-looking guidance.
- If monetary officials take a hardline approach, indicating ongoing price pressures and economic activity, then financial markets could interpret this as a sign to continue high interest rate levels. This should continue to propel the pound, increase government bond yields, and weigh on rate-sensitive equities such as real estate and utilities.
- Conversely, if officials indicate slowing economic activity, easing inflation pressures, and concerns over financial stability, then expectations of rate cuts could increase. This should weigh on the pound, decrease government bond yields, and favor equities with exposure to domestic demand. Analysts should focus on inflation pressures, wage growth, and financial stability risks.
CB Consumer Confidence
Consumer confidence is an important metric that will continue to monitor household sentiment and their appetite to spend, especially considering that household consumption is one of the largest contributors to overall economic activity.
- An above-consensus reading will reinforce the thesis that household balance sheets and labor markets remain healthy and robust. An above-consensus reading will likely boost consumer staples, retail, and overall cyclical stocks, while potentially pushing bond yields higher as investors bet on less easing in the near term.
- Conversely, an underwhelming reading will likely cause investors to become cautious of household spending and potential discretionary spending slowdowns. In that case, consumer staples and utility stocks will likely benefit, while bond markets will rally as recession fears intensify.
Richmond Manufacturing Index
Regional manufacturing surveys often give early indications of overall industrial trends and direction.
- An above-consensus reading will likely indicate that manufacturing conditions continue to stabilize, and that order flows and capital goods demand may finally begin to pick up. An above-consensus reading will likely boost industrials, materials, and transportation stocks, while alleviating recession fears in general.
- Conversely, an underwhelming reading will likely cause investors to become cautious of industrial conditions and potential capital goods demand slowdowns. In that case, machinery and equipment stocks will likely suffer, while bond markets rally as recession fears intensify. Analysts will want to monitor new orders, employment, and capital expenditures as confirmatory evidence of industrial conditions and their direction.
Stock Market Performance
Indexes Rebound from April 8 Lows as Breadth Remains Uneven
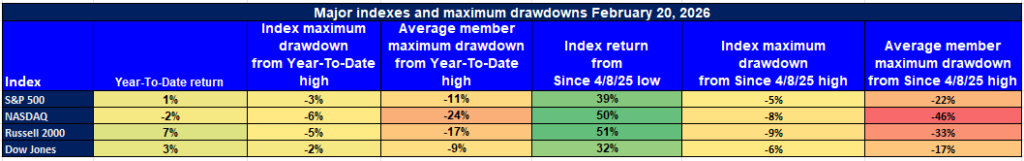
The stock markets have recorded a significant recovery since their lows on April 8, 2025. Despite this, their performance over the current year has been uneven. At Zaye Capital Markets, we believe that this difference in index performance and constituent performance is what defines the current market structure. Below is a breakdown based on strict figures alone:
S&P 500: Modest YTD Gain, Strong Recovery Since April
YTD: +1% | -3% from YTD high | Avg. member: -11%
Since 4/8/25 low: +39% | -5% max drawdown | Avg. member: -22%
The S&P 500 stock market index has recorded a 1% gain in current performance, with a small pullback of 3% from its current high. However, the average stock in the S&P 500 has recorded a pullback of 11% from its current high. In addition, it has recorded a 39% gain since April 8, 2025, with an average stock in the S&P 500 having recorded a 22% fall.
NASDAQ: Strongest Rebound, Deepest Internal Damage
YTD: -2% | -6% from YTD high | Avg. member: -24%
Since 4/8/25 low: +50% | -8% max drawdown | Avg. member: -46%
Despite its 50% move from its April low, NASDAQ is down 2% YTD. The average stock is down 24% from its YTD high and 46% from its low in April. Growth stocks continue to hide their underlying stress.
Russell 2000: YTD Positive, Yet Highly Volatile
YTD: +7% | -5% from YTD high | Avg. member: -17%
Since 4/8/25 low: +51% | -9% max drawdown | Avg. member: -33%
Small caps have had their strongest YTD performance of +7% this year, outpacing the rest of the major averages. However, we see 17% average members down from their YTD highs and 33% down from their low in April, indicating high volatility within economically sensitive stocks.
Dow Jones: Defensive Stability with Controlled Drawdowns
YTD: +3% | -2% from YTD high | Avg. member: -9%
Since 4/8/25 low: +32% | -6% max drawdown | Avg. member: -17%
We see stability in the Dow Jones as its YTD is up 3% with only a 2% decline from its YTD high. Since its low of 4/8/25, Dow Jones is up 32%. However, its average members down by 17% indicate less severe stress within its constituents.
At Zaye Capital Markets, we continue to monitor key metrics such as average members recovered and average members down as key indicators of overall market health and strength of an overall rally.
The Strongest Sector In All These Indices
Energy Leads Year-to-Date, Remains a Top-Tier Performer Month-to-Date
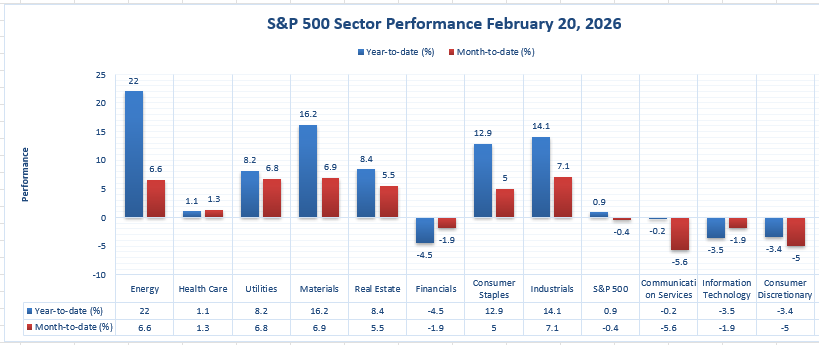
Our read of the sector performance chart is simple. The sector that stands out as having the strongest performance is, without question, Energy. The sector has risen 22.0% year-to-date, making it the best performer across all sectors. It has risen 6.6% month-to-date, putting it in the leadership group even if it is not the best performer month-to-date. The combination of a 22.0% year-to-date gain and a 6.6% month-to-date gain confirms our view that Energy’s strength is not abating. It is still one of the most heavily supported sectors.
When we compare Energy’s year-to-date and month-to-date gains with those of the next best sector, Materials, we see just how much stronger Energy is. Materials is up 16.2% year-to-date and has risen 6.9% month-to-date. Industrials are up 14.1% year-to-date and have gained 7.1% month-to-date. Consumer Staples are up 12.9% year-to-date and have gained 5.0% month-to-date. Utilities are up 8.2% year-to-date and have gained 6.8% month-to-date. Real Estate is up 8.4% year-to-date and has gained 5.5% month-to-date. Meanwhile, there are several sectors down year-to-date, including Financials, down -4.5%; Communication Services, down -0.2%; Information Technology, down -3.5%; and Consumer Discretionary, down -3.4%.
If we take a broader view of the benchmark index, we can see that the S&P 500 is up just 0.9% year-to-date and is down -0.4% month-to-date. With all of these figures, we can see clearly that Energy’s year-to-date gain of 22.0% and month-to-date gain of 6.6% make it, without question, the strongest sector.
Earnings
Earnings Recap – February 23, 2026
- Domino’s Pizza, Inc. (DPZ) Revenue for the most recent fiscal year, i.e., Q4 2025, was reported at $1,535.7 million, which reflected an increase of 6.4% year-over-year, and the net income was reported at $181.6 million, which reflected an increase of 7.2% year-over-year. The diluted EPS was reported at $5.35, which reflected an increase from the previous year’s earnings per share of $4.89. The income from operations also reflected an increase of 8.0% year-over-year, reaching $295.7 million. The global retail sales, excluding foreign exchange, reflected an increase of 4.9%. The revenue for the fiscal year 2025 was reported at $4.94 billion, and the net income was reported at $601.7 million. The diluted EPS was reported at $17.57. The increase in operating income and earnings per share indicates that the company is poised to deliver earnings compounding, provided that the sales momentum is sustained.
- Diamondback Energy, Inc. (FANG) Revenue for the most recent fiscal year, i.e., Q4 2025, was reported at $3.38 billion, which reflected a year-over-year decline of 9%. However, the operating results were strong, as the average oil production was 512.8 MBO/d, and the production was 969.1 MBOE/d. The net cash provided by operating activities was reported at $2.3 billion, which resulted in the production of $1.0 billion of free cash flow, adjusted for $1.2 billion, and the actual cash capital expenditures were $943 million. The adjusted earnings per share was reported at $1.74, which was below the consensus. The GAAP earnings included non-recurring items. The operating cash flow was reported at $8.8 billion, and the free cash flow was reported at $5.5 billion, adjusted for $5.9 billion, and the actual cash capital expenditures were reported at $3.5 billion.
- ONEOK, Inc. (OKE) Quarterly revenue for Q4 was $9.07 billion, an increase of 29.5% year over year, while diluted EPS was $1.55, beating expectations and up from $1.57 a year ago. Net income attributable to ONEOK for full year 2025 was $3.39 billion, with adjusted EBITDA of $8.02 billion, up 18% year over year, and diluted EPS of $5.42, up 11% excluding prior year items.
- Hims & Hers Health, Inc. (HIMS) Quarterly revenue for Q4 was $617.8 million, an increase of 28% year over year, including online revenue of $609.1 million. Net income was $20.6 million, down from $26.0 million last year, while EPS of $0.08 beat expectations. For full year 2025, revenue increased to $2,347.6 million, or about $2.35 billion, up 59% year over year, while net income was $128.4 million and adjusted EBITDA was $318 million. Subscribers exceeded 2.5 million, up 13% year over year.
Earnings Due Preview – February 24, 2026
- Home Depot, Inc. (HD) Investors will be looking at comparable sales performance, revenue growth trends, operating margin resiliency, and forward guidance on housing and renovation spend.
- HP Inc. (HPQ) Investors will be looking at revenue performance by segment, gross margin, operating expenses, and cash flow. Average selling prices, enterprise stability, and share repurchase will be key metrics to analyze HP’s earnings and forward capital return capacity.
- NRG Energy, Inc. (NRG) The key metrics will include retail electricity demand trends, hedging effectiveness, stability of operating income, and debt management. The investment community will be evaluating how exposure to commodity prices and electric power contract structure are impacting stability in operating results.
- Cipher Mining Inc. (CIFR) The key metrics will include an increase in hash rate, operational efficiency metrics, management of energy costs, and capital allocation strategy. An increase in mining output and balance sheet positioning will be critical to evaluating sensitivity in investment community valuations due to changes in digital asset prices.
- American Tower Corporation (AMT) The key metrics will include revenue growth in property, international tower leasing activity, churn rates, and AFFO growth. Capital expenditure discipline and demand trends will be critical to evaluating investment community outlook.
- Standard Chartered PLC (STAN) The key metrics will include trends in net interest income, credit quality metrics, capital ratios, and exposure to growth in emerging markets. Currency exposure and loan growth dynamics in emerging markets will be critical to evaluating the durability of investment results.
Stock Market Overview – Tuesday, 24 Feb 2026
US stock markets are trading on weaker ground today amid concentrated weakness in mega caps, healthcare volatility, and sector-level AI-related stock repricings. Though capital expenditure in infrastructure stocks is strong, underlying stock level volatility in software, healthcare, and fintech stocks is causing dispersion beneath the headline markets. At Zaye Capital Markets, we are witnessing markets no longer trading in tandem. We are witnessing selective capital flows into cash flow stories and capital-intensive infrastructure stocks. Breadth is still precarious, and sector leadership is narrowing.
Stock Prices
Economic Indicators and Geopolitical Developments
Markets are trading amid underlying trade-related rhetoric and AI-related national security concerns and underlying enterprise technology adoption rates. Hyperscaler-related capital expenditure is providing underlying support to the markets. Geopolitical-related AI-related themes and underlying defense-related innovation themes are providing underlying support to the markets. Rate-related concerns are still underlying but are no longer the primary drivers of stock prices.
Latest Stock News
- $NVO shares fell by 15% following the failure of its next-generation obesity treatment, CagriSema, to meet the primary endpoint of its Phase 3 clinical trial against $LLY’s obesity treatment, Zepbound. The decline has sparked investors’ concern regarding the long-term viability of its obesity treatments pipeline, assumptions around its peak sales potential, and its competitive position within the GLP-1 combinations space.
- $CRWD has seen its shares fluctuate as investors weigh the impact of artificial intelligence on cybersecurity platforms. The company’s management has been vocal against the assumption that artificial intelligence will become a replacement for cybersecurity platforms. The company has argued that endpoint security solutions, identity management solutions, and cloud security solutions become increasingly important as AI adoption increases across the enterprise space. The question investors are asking is whether artificial intelligence will become a replacement for cybersecurity platforms. The answer to this question is no. The issue investors are concerned about is the complexity of enterprise infrastructures.
- $UBER has announced the launch of its platform called “Uber Autonomous Solutions.” The platform will integrate autonomous vehicle partners across the globe. The strategic importance of the announcement is huge because the company doesn’t have to own autonomous vehicles to be successful; it has to be the platform that integrates autonomous vehicles. The question investors are asking is whether the launch will have a positive impact on its business because it will be the platform that integrates autonomous vehicle partners across the globe.
- OpenAI has signed multi-year enterprise agreements with $ACN, BCG, Capgemini, and McKinsey to productionize AI agents within enterprise workflows. The enterprise business currently accounts for around 40% of OpenAI’s business and is growing towards 50% by the end of the year. The strategic implication for the markets is that AI monetization is shifting towards enterprise models instead of consumer models, reinforcing the importance of cloud infrastructure, security architecture, and systems integration services.
- $JPM outlined a multi-year optics upcycle benefiting $LITE, $COHR, and $GLW as hyperscaler capex extends through 2027. 800G+ datacom has a 40%+ compound growth rate, meaning optical transceivers will scale multiple times per GPU deployment. As $NVDA increases compute density, optics demand will compound per rack and cluster. The world is realizing AI infrastructure monetization is not just about semiconductors but the entire networking value chain.
- $ASML is increasing EUV source power to 1,000W, aiming to deliver a throughput of approximately 330 wafers per hour. This roadmap means nearly 50% more chip output will be produced per tool by 2030. The fundamental idea here is that ASML’s margins will increase due to productivity gains in advanced node fabs. The increase in throughput means a lower cost per wafer and a higher return on investment for leading-edge semiconductor manufacturers. The world is discussing how this technological progression extends ASML’s pricing power and moat in lithography.
- $PYPL stock trading halted as takeover speculation mounts following recent stock decline. Strategic acquisition interest has initiated a floor stock value discussion, especially as PYPL continues to restructure and focus on transaction margin expansion. The world is discussing whether current stock multiples represent a private equity or strategic buyer opportunity as PYPL continues to restructure.
- SOFI has dipped below the $23 billion market capitalization threshold needed to qualify for the S&P 500, which has delayed the prospect of inclusion into the index. The relevance of this news is important, as it would generate incremental demand through passive flows from index inclusion. SoFi, despite the dip in market capitalization, has gained 1 million members in one quarter, which represents the largest member growth increase ever for the company, and has seen member growth compound annually by 50% over the past 5 years.
- NVDA has partnered with PANW and AKAM to bring accelerated computing with AI into operational technology security infrastructures. The partnership is designed to bring real-time threat detection into critical infrastructure environments. This partnership represents the progression of AI compute from cloud-based testing into more industrialized and infrastructure-based applications. The market is interpreting this as a positive for the idea that AI infrastructure spend is extending from hyperscalers into security-critical enterprise environments.
- AMZN is committing $12 billion to data centers in Louisiana, which includes significant upgrades to local water infrastructure. Hyperscalers are increasingly committing capital to regional water infrastructure, as compute growth requires environmental and resource scaling to match server deployments. The capital commitment represents a high degree of confidence in the long-term demand curve for AI.
- IONQ has been selected for the Missile Defense Agency’s SHIELD IDIQ contract, which has a program ceiling of $151 billion. The relevance of this news is important, as it puts IonQ into the funnel for future defense task orders related to quantum computing, sensing, and communication technologies. The relevance of this news is important, as it puts IonQ into the funnel for future defense task orders related to quantum computing, sensing, and communication technologies.
- $30 million was secured by ASTS as part of a prime contract from the Space Development Agency for the HALO Europa Track 2 contract. This is the first prime contract win by AST SpaceMobile USA, and it also validates the direct-to-device approach by BlueBird for use in tactical military communications. It further illustrates the thesis that space connectivity is not limited to broadband applications.
- $IBM fell by over 10% as a result of the launch of an AI tool that could transform COBOL code into contemporary programming languages by the AI startup Anthropic. This directly affects the legacy modernization consulting business of IBM. The question of whether AI-driven automation affects the pricing of revenue streams that were traditionally based on manual code transition cycles is being reassessed in the market, and this is a repricing of the long-term risk of margin pressure.
The Magnificent Seven and the S&P 500
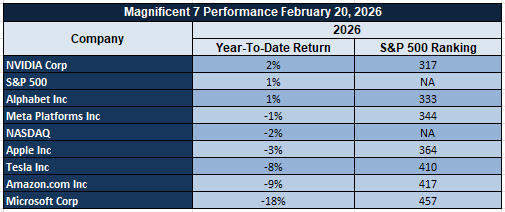
The Magnificent Seven, consisting of Apple, Microsoft, Nvidia, Amazon, Meta, Alphabet, and Tesla, continue to dominate market direction for the S&P 500 index. Nvidia dominates AI infrastructure flows, and the others are being tested on their margins and ability to be monetized. Any significant weakness in these names, especially within the core group of the Magnificent Seven, is exerting pressure on the S&P 500 and the Nasdaq Composite, highlighting the importance of these seven stocks on market direction.
Major Index Performance as of Tuesday, 24 Feb 2026
- Nasdaq Composite: ~22,400, down over 1% as tech and growth stocks give back recent gains.
- S&P 500: Modestly lower as selling pressure across the market persists.
- Russell 2000: ~2,607.33, extending recent small-cap selling pressure.
- Dow Jones Industrial Average: ~48,000, weighed down by selling pressure in the cyclical and financial sectors.
We at Zaye Capital Markets are selective, and infrastructure, defense-related innovation, optics, and compute-related ecosystems continue to attract structural capital, with software and biotechnology segments seeing a valuation recalibration. Breadth expansion needs to be seen as a key indicator before a broad-based rally can be sustained.
Gold Price: How are Geopolitical Rhetoric and Upcoming Economic Data Driving the Price of Gold Today?
Currently, on Tuesday, 24 Feb 2026, gold prices are trading at higher levels beyond the critical $5,000 per ounce mark, with gold prices recently trading at $5,189.99 per ounce before correcting slightly on profit-taking and a strong dollar following a strong rally to multi-week highs on the back of recent macro and geopolitical events. The safe-haven demand for gold has been driven by the current state of heightened uncertainty caused by U.S. political rhetoric such as the administration’s renewed trade threat warnings, tariff signals under Section 232 of U.S. trade law, and overall security and funding issues for foreign nations. These factors are driving gold’s valuation landscape by increasing its premium at a time of rising risk assets’ volatility. The overall mixed signals emanating from equity markets based on yesterday’s regional manufacturing data are driving gold’s safe-haven appeal at a time of rising risk assets’ volatility, even as investors weigh profit-taking against safe-haven flows.
The interplay of upcoming economic data such as the GBP Monetary Policy Report Hearings, U.S. Conference Board Consumer Confidence, and the Richmond Manufacturing Index against the backdrop of U.S. tariff policy commentary is expected to influence gold’s ecosystem. For instance, weaker than expected consumer or manufacturing data could fuel expectations of slower economic growth and lower real rates, driving gold’s safe-haven appeal higher. Conversely, positive economic data may temper gold’s upside potential but is expected to have little impact on gold’s safe-haven appeal at a time of rising U.S.-China trade tensions and overall geopolitical tensions. Inflation expectations, rate path speculation, and risk sentiment based on trade and economic indicators will be some of the key factors driving gold’s price dynamics going forward.
Oil Prices: Why Are Oil Prices Fluctuating Amid Trade Threats and Global Supply Signals?
As of Tuesday, 24 Feb 2026, Brent crude is trading near $72 per barrel while West Texas Intermediate (WTI) is hovering around $66–$67 per barrel, holding close to recent multi-month highs despite intraday volatility. Oil’s movement reflects a layered interaction between geopolitical rhetoric, macroeconomic expectations, and forward supply projections. Recent presidential comments warning that countries “playing games” on trade will face higher duties, alongside signals of potential new national security tariffs under Section 232, have reintroduced uncertainty into global trade flows. Markets interpret tariff escalation risk as potentially inflationary in the short term — supportive for commodity pricing — but growth-negative over time, which introduces volatility into crude demand expectations. Simultaneously, commentary regarding border security, foreign policy posture, and defense of the homeland reinforces geopolitical risk premiums that tend to underpin oil prices through precautionary positioning. Traders are therefore pricing a geopolitical buffer into crude benchmarks even as underlying supply-demand fundamentals remain broadly balanced.
Yesterday’s economic data contributed to this fragile equilibrium. Mixed regional manufacturing readings and cautious sentiment indicators signaled that industrial momentum is stabilizing but not accelerating decisively, limiting both aggressive bullish and bearish positioning in crude. If growth indicators soften further, demand forecasts may moderate, capping upside. However, stronger-than-expected U.S. Consumer Confidence or Richmond Manufacturing Index data today would reinforce the narrative of resilient economic activity, supporting refined product demand and sustaining crude above current levels. Conversely, weaker data could amplify slowdown concerns and pressure near-term demand expectations, prompting short-term pullbacks. From a structural standpoint, guidance from OPEC regarding disciplined production management and the IEA’s projections of rising non-OPEC supply continue to frame the medium-term balance, but near-term price direction remains driven by trade rhetoric, macro data surprises, and positioning dynamics rather than physical inventory stress.
Bitcoin Prices: Why is Bitcoin Trading Below $65,000 Amid Trade Escalation and Macro Pressure?
As of Tuesday, 24 Feb 2026, Bitcoin is trading in the mid-$60,000s, ranging between $64,000 and $66,000. The cryptocurrency experienced a brief drop to below the $65,000 mark amid trade-related uncertainty and macro pressure. The drop represents the sharpest drop of about 4% in the last 24 hours. President Trump issued fresh trade threats to nations “playing games” on trade, stating they would face higher tariffs. Additionally, Trump mentioned potential new national security tariffs and license fees to trading partners. The recent trade-related and macro-related pressure experienced in global markets has impacted Bitcoin prices. Although Bitcoin is considered to offer protection against global instability and risks, in the current state of liquidity, it trades as a high beta risk asset. Trade escalation and geopolitical positioning have negatively impacted equities and growth assets globally. Bitcoin prices are no exception to this and have mirrored global risk sentiment. Technical indicators also indicate a weekly support level breach and potential drop to the $62,800 mark. Hedge funds have reportedly been the first to cut exposure to Bitcoin through exchange-traded funds.
The mixed results from yesterday’s economic indicators, such as the mixed regional manufacturing indicators and cautious consumer trends, further dampened risk appetite, which has yet to provide a bullish catalyst for digital assets. A weaker economic growth rate naturally impacts speculative investment flows, especially as conditions become increasingly tighter due to rising volatility in traditional markets. However, extreme fear levels in the crypto markets indicate a defensive positioning rather than euphoric levels, with the $60,000 level acting as a new focal point. Today’s scheduled Consumer Confidence and Richmond Manufacturing Index results will have a direct bearing on the short-term direction of Bitcoin. Stronger results will likely stabilize Bitcoin prices as they positively impact risk appetite and recession fears, while weaker results will likely continue to negatively impact prices, especially as ETF outflows continue to increase. The Bitcoin ecosystem is no longer driven by narratives of regulatory clarity but rather driven by conditions such as rising liquidity levels, geopolitical risks, and macro growth rates.
ETH Prices: What’s Driving Ethereum’s Price to Trade Around $1,800 Amid Whale Selling and Changes in ETF Flows?
Currently, on Tuesday, 24 Feb 2026, Ethereum, or ETH, is currently trading in the range of $1,800 and $1,850, holding near multi-week lows as it fails to reclaim the important psychological price point of $1,900. The price action over the past few sessions can be attributed to the macro pressures on the entire digital asset market, accompanied by considerable on-chain actions from whales, which can be deemed as selling pressures rather than buying pressures, as indicated by considerable transactions from high-balance addresses on the blockchain over the past few sessions. In the past week, it has been indicated that whales are selling considerable amounts of Ethereum, which has been contributing to the price action, thereby adding to the selling pressures in the market, which is currently reflected by the price action, as there has been considerable selling by whales, thereby adding to the selling pressures in the market, which is currently reflected by the price action, as there has been considerable selling by whales, thereby adding to the selling pressures in the market, which is currently reflected by the price action, as there has been considerable selling by whales, thereby adding to the selling pressures in the market, which is currently reflected by the price action, as there has been considerable selling by whales, thereby adding to the selling pressures in the market, which is currently reflected by the price action, as there has been considerable selling by whales, thereby adding to the selling pressures in the market, which is currently reflected by the price action, as there has been considerable selling by whales, thereby adding to the selling pressures in the market, which is currently reflected by the price action, as there has been considerable selling by whales, thereby adding to the selling pressures in the market,
From an ecosystem level, the positioning of Ethereum reflects its sensitivity to cross-asset macro conditions as well as its internal capital flows. The mixed bag of economic data released yesterday, which saw manufacturing indicators sending mixed signals and consumer trends being more cautious, has maintained risk-off positioning in high-beta assets like Ethereum. As macro conditions become more uncertain, ETH tends to be more of a liquidity-driven asset than a defensive play, which explains the recent break below short-term support levels. However, there have been observations of opportunistic buying at lower levels by certain whale addresses, which does not necessarily mean that there is no distribution happening at the whale level. The recent stability in ETF flows also indicates that there has been no significant outflow of assets at the institutional level, even though flows have been choppy. For today’s session, the macro data points to watch would be the US Consumer Confidence numbers as well as manufacturing data out of various regions. Strong numbers could potentially help ETH stabilize above $1,800 levels, while weaker numbers could result in ETH falling to its next levels of support.
