Where are markets today?
European and US equity future markets are set to open higher, continuing on from the previous day’s session as investors react to a reduction in geopolitical concerns and a shift in focus back to macro fundamentals. Futures markets’ strength is based on relief rather than euphoria, with markets re-calibrating after a period in which uncertainty has been elevated. Some risk has been mitigated due to a retreat from tariff escalation and diplomatic formulations surrounding Arctic events.
A key reason for the rise in futures is the geopolitical easing and clarity on trade. The fact that plans to impose tariff actions on Europe will not go ahead, coupled with the ongoing indication that Arctic and Greenland matters will be addressed via alliances and not military action, has helped to alleviate concerns regarding supply chain and trade retaliation risks. This is especially helpful for European stocks and global systemically important U.S. equities, helping to stabilize markets after a tumultuous beginning to the week.
Another important factor is the return of macro and earnings to the forefront of pricing. With risk of political shock passing, investors are turning their attention once again to inflation trends, the labor market, and earnings. Expectations surrounding the forthcoming inflation number, as well as jobless claims, have sparked tentative optimism, particularly as earnings trends have been showing strength that is broadening beyond just the leaders among the mega-cap stocks. This is leading to an improvement in market internals, as well as the view that the rally is becoming healthier, albeit patchy.
Notwithstanding the positive sentiment, markets are tactically positive rather than structurally so. Both European markets and the US markets are still poised to end the week slightly lower, thus emphasizing the volatility and sensitivity to data that persists. The strength in the futures markets at this point in time is more a function of relief, positioning, and dip-buying rather than a clear risk-on shift in sentiment. Investors are awaiting guidance from inflation numbers before making a structural commitment.
Major Index Performance as of Tuesday, 20 Jan 2026
- Nasdaq: Trading at 23,225, supported by large-cap technology but highly sensitive to valuation compression.
- S&P 500: Trading at 6,905, stabilising after recent volatility with narrow leadership.
- Russell 2000: Trading at 2,698, showing relative resilience as investors rotate selectively into smaller-cap exposure.
- Dow Jones: Trading above 49,000, benefiting from its defensive and industrial composition.
The Magnificent Seven and the S&P 500
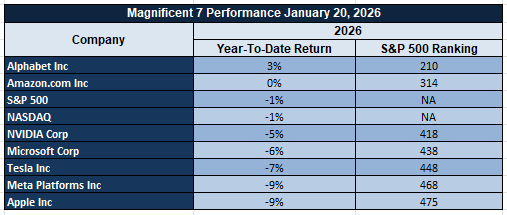
The S&P 500 is still dominated by the Magnificent Seven, where high valuations and a bout of profit-taking has resulted in disproportionate bear pressure compared to the rest of the market. Since these stocks drive a disproportionate amount of the recent market advances, their drag is what is holding back market-level advances. Until a reversal in these stocks or a diversification of leadership, advances at the index level will likely be limited.
Factors Driving the Market Shift – Thursday, January 22, 2026
Meanwhile, as the U.S. and European markets process the quick-changing combinations of geopolitical messages and economic data, the current market mood is one in which relief at avoiding the potential for further escalation is being paired with a renewed emphasis on achieving further clarity on inflation and growth. Although markets are now trending higher, conviction is selective.
- Geopolitical De-Escalation Around Greenland and Europe Eases Risk Premiums
However, the recent statements that have defined a framework for diplomacy on the issue of Greenland, the rejection of the use of military options, and the willingness to move away from threats of new tariffs against Europe have diminished the tail risk associated with the geopolitical environment. This has helped create a relief rally for U.S. and European stocks, especially for those that are more globally systemically significant, such as the industrial, financial, and energy sectors. Yet the criticism from European partners and the harsh rhetoric against Europe indicate that the tensions are not gone, just tempered.
2. Policy Messaging Reshapes Sector Positioning, Not Broad Market Direction
The policy messaging of energy dominance, leadership in AI and technology, development of the crypto markets, and fiscal discipline is fueling rotation at the sector level rather than index buying. The record levels of oil and gas production messaging is limiting the price upside of energy prices while being supportive of confidence on the supply side. However, the constant mention of AI and technology and crypto positioning is actually supportive of the long-term themes of innovation-related assets.
3. Upcoming Economic Data Refocuses Markets on Inflation and Growth Validation
However, with the geopolitical fears being assuaged, the spotlight is once again on the major economic releases of the day: the Final GDP, the unemployment claims, the GDP price index, and the Core PCE. These indicators are of prime significance to rate expectations in the short term. The markets are set to be cautious, with hopes pegged to the taming of the inflation numbers without a marked deceleration in the pace of economic growth.
In short, today’s market action is a function of risk re-pricing rather than conviction. Relief from geopolitical headlines has helped to reduce risks on the downside, though markets await economic data confirmation before committing to a trade in US and European stocks.
Digesting Economic Data
The Trump Tweets and Its Implications
The current communication on Greenland and Arctic policy definitely signals a turn in diplomatic language rather than a threatening one. Such announcements that highlight a framework of a deal with partners, a clear rejection of the use of force, and constant mentions of a shared vision of security definitely help to mitigate the risks associated with geopolitical tensions, at least in the short term. However, the ambiguous response of the Europeans and concerns regarding the use of coercion indicate that the risks associated with geopolitical tensions are certainly not eliminated; instead, these risks are reshaped.
The trade and economic rhetoric further cements the dual-track message. While pulling back from tariff talk to Europe relieves concerns of supply chain disruption and growth impacts in the near term, this is positive for risk. On the other hand, the constant message of economic strength, better inflation trends, and shrinking trade deficits is meant to anchor confidence in homegrown demand. Markets view this message cum narrative as positive in the near term but ultimately dependent on incoming data rather than consistency of message. Thus, this message has lowered tail risks but has not entirely dissipated macro uncertainty.
Also, the positioning of policies regarding energy, tech, and crypto considers more long-term effects. Focus on a record level of oil and gas production continues to underpin the view of abundant supplies and thereby limits price gains even amidst geopolitical tensions. On the other hand, the positioning of AI and tech as the strategic foundation and the presentation of new crypto regulations to pursue global leadership also underpin more long-term investment themes related to innovation and digital assets. For the markets, there is a split effect: cyclical assets respond positively to lower trade friction, and the attention of the growth sectors comes from policy support rather than short-term stimulus.
On balance, the tone of global leadership is accompanied by a degree of controlled risk messaging. While diplomatic tone in international relations mitigates sudden shock risk, tensions in global politics and aggressive language against Europe maintain a degree of underlying geopolitics. For investors, the impact is not a risk-on message but a rebalancing toward strategic positioning. Markets are grounded in fundamentals of economics, earnings, and liquidity and utilize these policy statements largely in a contextual and not a catalytic manner.
Precious Metals Rally Signals Policy and Risk Shift
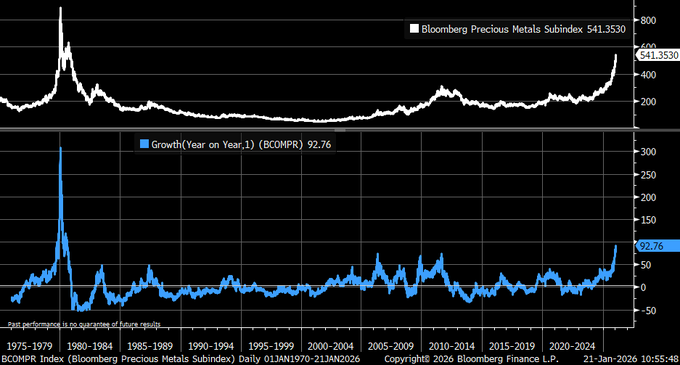
The prices of precious metals have moved quickly in the last year, with the increases in gold and silver futures contracts comparable to some of the best historic advances ever recorded. Such a strong advance is not necessarily a result of market speculation but is more a result of a set of overall market factors coming together. The pressures on prices, along with increasing geopolitical tensions and trade disputes, have led investors and institutions to turn to assets that serve as a hedge against money and financial market risks. Additionally, demand for these metals has not been limited to private investors but has also included official accumulation, thereby creating a structural demand for both metals.
One of the main forces pushing this trend has been the growing outlook for lower policy rates, lowering the cost of non-yielding assets. Simultaneously, trade policies and escalations of tariffs have brought back concerns regarding supply chains, currency, and cross-border flows. The strong performance of Silver over gold illustrates its unique character of being both a hedge and an industrial metal, benefitting from strong fabrication demand expectations along with safe-haven flows. But it is important to remember that markets with such strong price movements are prone to high levels of potential volatility.
In this setting, we view Newmont Gold Corporation as undervalued. The company is well placed to generate free cash flow from the rise in realized prices, rather than from volume, given their production base. The company is well placed to generate free cash flow from the rise in realized prices, rather than from volume, given their production base. The company is well placed to generate free cash flow from the rise in realized prices, rather than from volume, given their production base. The company is well placed to generate free cash flow from the rise in realized prices, rather than from volume, given their production base. The precious metals equities with strong balance sheets are in a stronger position compared to the leveraged producers in the event of increased volatility.
Pending Home Sales Signal Housing Reset
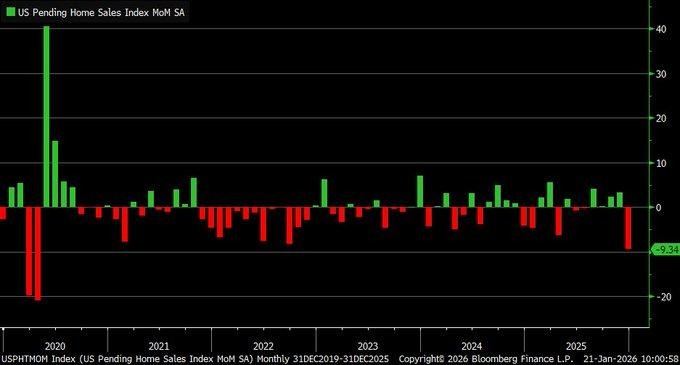
Existing home sales fell sharply in December, with this being the strongest monthly fall in a number of years and reflecting how sensitive housing market demand is to affordability and inventory conditions. Although it is not uncommon for existing home sales to fall towards the end of a year, it is clear that this fall is more substantial and reflects a pause in market activity rather than an exodus, as inventories remain tight despite a reduction in borrowing costs.
Drilling down, it appears there is a divergence between activity levels and demand. Completed sales picked up in December, suggesting that the flow-through of transactions from earlier in the quarter is ongoing. Year-over-year, the pace of declines in pending sales was not dramatic, supporting our belief that demand is not falling apart but rather being slowed by supply chain friction. For us, this suggests a housing market that is temporarily cooling, not structurally, with latent demand set to rebound with inventory growth and price adjustments.
In this scenario, we believe that Lennar is undervalued. With the company’s scale and market reach in the entry-level and move-up segments, it will benefit from supply tailwinds and a normalization of transaction volumes more than most other players in the market. With a strong balance sheet and a light land position, it will be well positioned to capitalize on the market conditions, no matter how uncertain they may be in the short term. Among the things we will be paying attention to in the near term include the rate of inventory growth, traffic, and cancellation ratios through early 2026, as well as the sustainability of margins with the return of incentives in the market. Stocks with a focus on the recovery of volumes over price appear to be positioned well for the next phase of the market.
Giving Patterns Signal Consumer Priority Shift
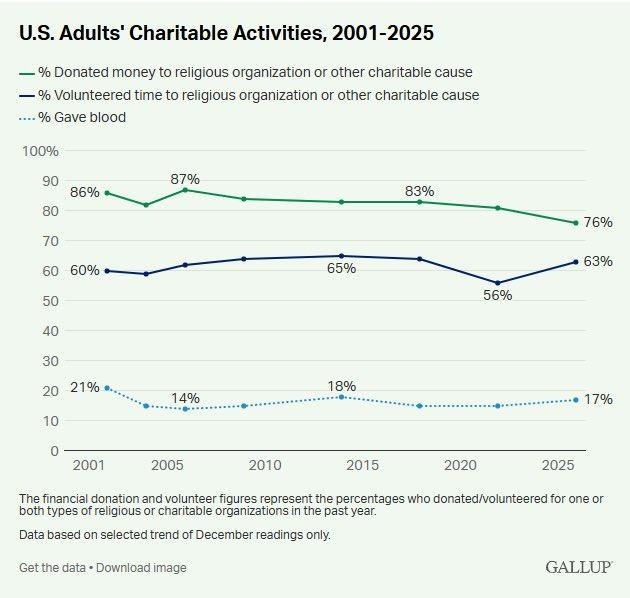
The most recent data from a national survey illustrates that charitable contributions are a structurally sound activity because a strong majority of people continue to make donations regardless of changing economic circumstances. Although fewer people are donating financially compared to the highs reached earlier in the decade, levels are higher than historical averages. This is a good indication that balance sheets are strained but not damaged because consumers are simply adjusting spending priorities.
Concurrently, engagement through volunteering has also gained considerable momentum, marking a shift from money to time-based engagement. This represents a more values-based allocation of resources, with people wanting to make a direct and observable difference instead of making anonymous donations. Notably, money flows are also diversifying from conventional channels to secular and related causes, signifying that donors are also being more particular and tech-savvy instead of being institutionally focused.
In this context, we consider PayPal to be undervalued. As a major payments infrastructure company in the sector of online donations, peer-to-peer payments, and non-profit platforms, it is poised to capitalize on the trend of digitalized donations and flexible contribution systems. The company’s valuation fails to account for the constant transaction volumes associated with regular micro-donations and contribution campaigns. Among the things that we will be monitoring in the near term, there is the seasonality of donations, engagement statistics on the platform, sensitivity to fees on the non-profit side, and the rate at which digital wallets overtake traditional donation systems.
Sector Gaps in Wages Reveal Uneven Cooling
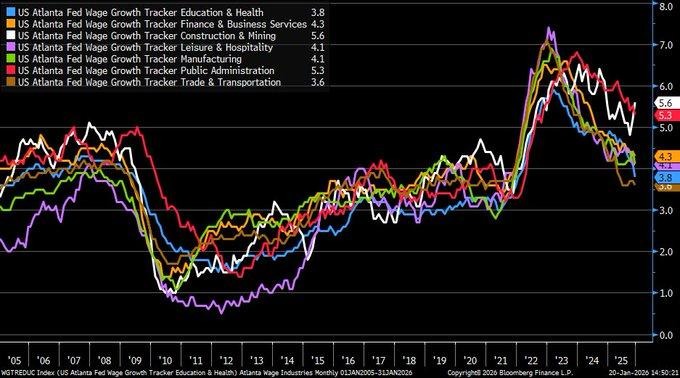
Current wage information reveals that the pace of cooling within the labor market is not being felt equally across industries, but instead is being realized differently across the economy. The pace of wage growth in the construction and mining industries remains strong on a year-over-year basis and remains well above the pace realized in trade and transportation sectors. Noting this information is important to us because it gives us a more accurate insight into where the economy may face pressures related to cost versus where relief may already be in process.
On an aggregate basis, labor market wage growth momentum continues to moderate, supporting the theme that labor-related inflationary pressure is gradually decaying. Lower employment and a slightly higher unemployment rate indicate that employers are being more discerning, particularly in white-collar and distribution-reliant occupations. Nevertheless, persistent wage momentum in construction-related occupations indicates that capital projects related to infrastructure and energy projects are still in play. This presents a mixed inflationary environment in which labor-related inflationary pressure abates but pockets of intensity exist and can contribute to input prices.
Within this framework, we believe that Caterpillar is undervalued. This is because the company’s involvement in the construction, mining, and infrastructure equipment markets is directly linked to the sectors that continue to see strong wage and demand-driven momentum. What we are watching in the near term includes follow-through in infrastructure, commodity input cost trends, the conversion of order backlogs, and the extent to which wage strength spills over into cost inflation. Those capital goods companies that are linked more closely to physical investment cycles are better positioned than companies that are more reliant on trade volume.
Services Growth Remains Strong while Prices Ease
Recent regional survey data from the service economy indicates that there has been a definite reacceleration in business activity in the early months of the year, and that overall conditions have improved considerably from stagnation in late year periods. Businesses indicated increased demand and utilization in major service segments, which reinforced that momentum in economic activity is being regained despite overall economic growth deceleration. Notably, both indexes reflecting prices paid and prices received decreased from the prior month, which indicated that the rate of cost pass-through is decelerating but not disappearing.
However, despite this degree of moderation, the level of input costs in the service sector is still significantly above trend, thereby emphasizing the sticky nature of price pressures in this sector. With the service sector contributing the most to the economy, the impact of the current level of costs in this sector is not trivial in terms of its influence on the inflation trajectory. From our perspective, therefore, the disinflation trend is underway, but the level of service sector pricing is still high.
In this context, our view is that Waste Management is a undervalued stock. As a pricing-disciplined services company with a stable demand and strong contracts, it is poised to maintain margins despite slowing growth in input costs. The current market does not adequately recognize the resilience of services sector demand and the company’s ability to gradually recover costs without losing volume share. What we are keeping an eye on is how services sector pricing trends and margins are holding up, how local labor markets for services are treating wages, and how a reduction in input costs is leading to sustained improvements in profitability.
Upcoming Economic Events
Final GDP q/q, Unemployment Claims, Final GDP Price Index q/q, Core PCE Price Index m/m
As we embark on a critical data window, we are witnessing a growing shift in markets from speculation to verification. The price actions in recent weeks in equity, bond, as well as currency markets, indicate that investors are no longer driven by headlines but are increasingly seeking verification of whether growth stabilization, labor market loosening, or price pressures are actually easing. The group of data releases takes on importance because it challenges each of those three pillars in one fell swoop: growth, labor markets, as well as inflation.
Final GDP q/q
The last GDP growth figure is also a validation point regarding the strength of the economy before the start of the new year.
- If the final GDP figure is stronger than what is expected, it would mean that the demand is stronger than anticipated, but this would also make the need for monetary easing less urgent, leading to higher yields.
- On the other hand, if the GDP figure is revised down, the markets would see it as confirmation that the restrictive policies are working, leading to stronger bonds, defensive stocks, and greater confidence in the easing of financial conditions in the latter part of the year.
Unemployment Claims
The number of unemployment claims filed on a weekly basis is the market’s most timely indicator of a labor market turning point.
- A lower-than-expected figure would imply that the jobs market is still tight, underpinning the sustainability of household income and consumption trends. This could be a mixed development, posing a risk of sustained wage pressures, which could limit policy maneuverability.
- A higher-than-expected reading would suggest a quickening pace of jobs market weakness, which could dampen consumer sentiment but boost prospects of disinflation. This would see the market shift into defensives and bonds, pricing a weaker growth outlook but an easier policy environment.
Final GDP Price Index q/q
The revision in the GDP price index will help to determine whether inflation embedded in growth was factored too high or too low in previous estimates.
- A revision higher would indicate that inflationary pressures were more ingrained than had been thought, which would act to destabilize market confidence in the disinflationary trend and keep yields higher. This would be detrimental to valuation multiples, especially in longer-duration equity markets.
- A revision lower would further solidify the view that inflation is decelerating in tandem with growth.
Core PCE Price Index m/m
Core PCE is the most important inflation factor for markets because it has a direct impact on policy guidance and assumptions.
- Any number above market expectations would be disappointing and would spark a sell-off in rate-sensitive assets and a risk-off reaction in equities.
- However, a number that comes in lower than market expectations would confirm that inflation is trending in the right direction and would spark a risk-on reaction. Because of its importance, this number has the ability to override other market signals.
Taken together, these factors will go a long way in shaping whether the investing community re-engages with risk or continues to prioritize capital preservation, and this represents a critical period in this regard.
Stock Market Performance
Indexes Stabilise Near Highs, But Drawdowns Reveal Uneven Market Health
Equity markets are showing resilience off their recent lows, yet year-to-date performance and drawdown metrics highlight a market that remains structurally fragile beneath the surface. While headline indexes suggest stability, the experience of the average constituent tells a more cautious story. At Zaye Capital Markets, we see a clear divergence between index-level performance and underlying breadth, reinforcing the need for selectivity rather than broad risk-taking.
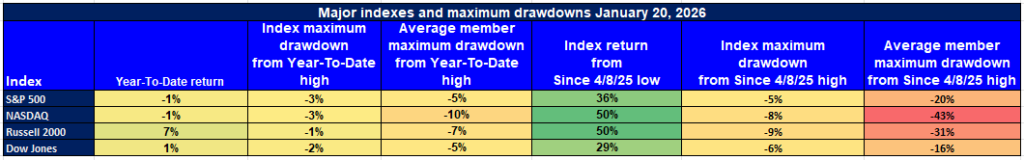
Here is our breakdown of performance across major indexes, using the latest available figures:
S&P 500: Flat YTD, Recovery Masking Shallow Participation
YTD: -1% | -3% from YTD high | Avg. member: -5%
+36% since April low | -5% from post-April high | Avg. member: -20%
The S&P 500 remains slightly negative year-to-date, despite a strong 36% rebound from its April low. The modest 3% drawdown from the YTD high suggests headline stability, but the average member drawdown of 5% YTD and 20% since the April low indicates that gains are still concentrated. This tells us leadership remains narrow, with broad participation yet to fully confirm the recovery.
NASDAQ: Strong Rebound, But Internal Damage Persists
YTD: -1% | -3% from YTD high | Avg. member: -10%
+50% since April low | -8% from post-April high | Avg. member: -43%
The NASDAQ has delivered the strongest rebound from April lows at 50%, reflecting renewed appetite for growth and innovation themes. However, year-to-date performance remains negative, and the average member drawdown of 43% since the April low highlights how uneven this recovery has been. At the index level, strength is masking continued stress across a large portion of the growth universe.
Russell 2000: Small-Cap Strength Fades at the Surface
YTD: +7% | -1% from YTD high | Avg. member: -7%
+50% since April low | -9% from post-April high | Avg. member: -31%
The Russell 2000 stands out with a 7% gain year-to-date and a 50% rebound from April lows. However, average member losses remain deep, particularly since the April recovery phase. This signals that while small-cap benchmarks have bounced, confidence in the broader small-cap universe remains fragile, with investors still selective and risk-sensitive.
Dow Jones: Relative Stability, Limited Upside
YTD: +1% | -2% from YTD high | Avg. member: -5%
+29% since April low | -6% from post-April high | Avg. member: -16%
The Dow Jones continues to show relative resilience, with modest gains year-to-date and smaller drawdowns compared to other indexes. Its average member drawdowns are less severe, reflecting a more defensive composition. However, the limited upside also suggests muted growth expectations, positioning the index as a stability anchor rather than a source of strong momentum.
At Zaye Capital Markets, our takeaway is clear: the recovery is real, but it is not broad. Index-level strength continues to obscure underlying dispersion, making stock selection and balance-sheet quality more important than index exposure. Until average member drawdowns improve meaningfully, we remain cautious on declaring a fully sustainable market expansion.
The Strongest Sector in All These Indices
Energy Leads Year-to-Date, While Consumer Staples Holds Up Best On The Day
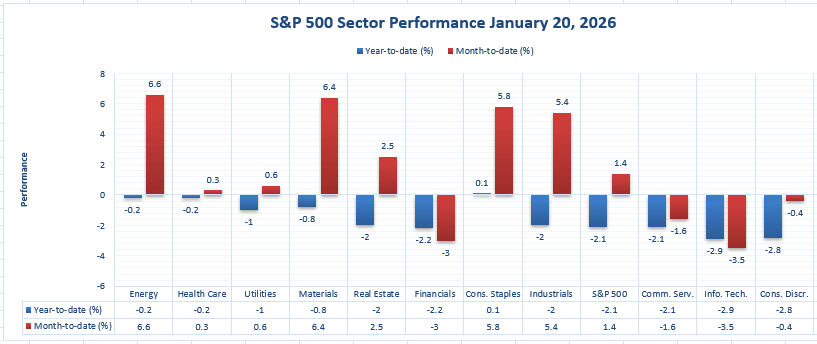
In the case of Zaye Capital Markets, the most prominent leadership indicator within the chart would be the year-to-date performance of the Energy sector, which leads with a gain of 6.6%. The second strongest sector would be Materials, with a gain of 6.4%, thereby indicating that the sectors with the strongest performance are those related to the pricing of hard assets and the related themes. The second level of leadership would comprise the sectors of Consumer Staples and Industrials, with gains of 5.8% and 5.4%, respectively.
In this recorded session (1/20/2026), overall market sectors moved mostly in the red, with only one sector ending in the green: Consumer Staples, which closed with a 0.1% increase, making it the best-performing sector of the day. However, sectors with the steepest losses were led by Information Technology with a -2.9% fall, followed by Consumer Discretionary with a -2.8% drop, as well as Financials with a -2.2% decline, in a typical risk-off market environment when the overall market closed down -2.1%.
What we see happening is that there are two camps in terms of leadership, and Energy is the biggest sector YTD leader at +6.6%, but Consumer Staples are the most defensive when the market goes down, as seen in their +0.1% performance on the day and +5.8% YTD performance. It would be important to note if the Energy sector can be the leading sector and yet the defensive assets perform well on down days.
Earnings
Yesterday’s (January 21, 2026) Earnings Results and Key Takeaways
- Disco Corp. reported earnings of 2.16 USD versus expectations of 1.83 USD, delivering an 18.02% positive surprise. This outcome reflects strong operational execution and margin control, allowing profitability to exceed forecasts despite a cautious capital spending environment. With a market capitalisation of 43.61 billion USD, the result reinforces Disco Corp.’s leverage to high-value manufacturing demand and positions it as a beneficiary if investment conditions continue to stabilise.
- Johnson & Johnson posted earnings of 2.46 USD, matching expectations of 2.46 USD and resulting in a marginal −0.12% surprise. While there was no upside acceleration, the print confirms earnings durability supported by diversified revenue streams. At a market capitalisation of 525.25 billion USD, the key signal is stability rather than growth momentum, keeping the company positioned as a defensive earnings anchor in an uncertain macro backdrop.
- Charles Schwab Corporation (The) delivered earnings of 1.39 USD compared with expectations of 1.40 USD, a −0.40% miss. The modest shortfall highlights continued sensitivity to margin dynamics and client cash behaviour. With a market capitalisation of 180.87 billion USD, investor focus remains on forward earnings visibility, balance-sheet strength, and net asset flow trends rather than the minor headline miss.
- Prologis, Inc. produced the most significant upside of the session, reporting earnings of 1.49 USD against expectations of 0.74 USD, representing a 102.06% positive surprise. With a market capitalisation of 124.39 billion USD, this result underscores strong operating leverage and resilient cash flows tied to logistics and industrial real estate, reinforcing confidence in earnings durability despite broader economic uncertainty.
Today’s (January 22, 2026) Earnings to Watch and Key Focus Areas
- Intel Corporation is set to report earnings today, with investor attention centred on margin trends, capital expenditure discipline, and progress in stabilising core operations. Guidance around demand visibility and cost control will be critical in shaping expectations for earnings recovery.
- Abbott Laboratories reports today, with markets focused on revenue mix across medical devices and diagnostics, margin resilience, and cost management. Any commentary on demand trends and profitability will be key for assessing earnings stability within the healthcare space.
- Suntec Real Estate Investment Trust is due to release results, with emphasis on rental income stability, occupancy trends, and distributable income sustainability. Investors will closely assess whether cash flow resilience is holding amid shifting property market conditions.
- Amalgamated Financial Corp. reports earnings today, where the primary focus will be net interest margins, loan growth quality, and credit conditions. The results will offer insight into how regional financial institutions are navigating evolving rate dynamics and balance-sheet pressures.
At Zaye Capital Markets, we view this combined earnings window as a clear reminder that earnings dispersion remains high, reinforcing the importance of company-specific analysis rather than broad index assumptions.
Stock Market Analysis – Tuesday, 20th Jan 2026
The U.S. equity markets are trading with a cautious yet stabilizing tone, as investors weigh off the easing of immediate trade-related risks against stretched valuations and sector leadership. The recent bouts of volatility have served as a reminder that the markets remain very sensitive to policy guidance, earnings sentiment, and themes related to the use of AI in allocating capital. At Zaye Capital Markets, we have noted that selective risk positions have been the dominant force in flows.
Stock Prices
Economic Indicators/Geopolitical Developments
Market sentiment has shown a slight improvement as the perception that the risk of a potential trade war has now been averted, and investors are able to shift their attention back to fundamental factors such as profits and structural growth stories. Still, some level of ambiguity in the inflation and interest rates environment has dampened the fervor.
Latest Stock Market News
$AMZN is launching Health AI for One Medical members, which comes with the launch of the AI assistant based on Amazon Bedrock, which uses medical records, lab results, and medication information. The service will be able to answer medical inquiries, manage medications, and schedule appointments, further integrating Amazon into the AI-driven healthcare delivery system.
$RKLB revealed that there had been a rupture of the Neutron Stage 1 tank during a hydrostatic pressure qualification test as it had been forced beyond design specifications. However, the company has since ascertained that there is no major damage to the facilities, the subsequent tank is already in production, and the program is on schedule while data is being reviewed.
$LMND followed up with a 50% discount on insurance rates for $TSLA owners when Full Self-Driving is engaged, attributing it to their data showing a significant decrease in accidents. This marks one of the most obvious third-party verifications to date regarding the mitigation of accident risks through autonomous driving capabilities.
AAPL will reportedly resurrect Siri as its initial AI chatbot, named Campos, during the second half of 2026. The official unveiling of the service is expected to take place in June, and the service will be available from September. It seems that AAPL is also thinking of running the service from $GOOGL Cloud and utilizing TPUs and Gemini models.
$NVDA’s management pointed out that GPUs are sold out in the cloud sector and even last-generation GPUs are hard to find when rented. The increase in spot pricing for GPU rentals indicates that supply is a bottleneck in the industry and is a positive for infrastructure and compute specialists like $NBIS, $IREN, and $CIFR.
$INTC is up more than 7% before the earnings announcement, as investors are increasingly interested in local chip production. The size of the current build-out in the industrial and technology sectors supports the strategic value of Intel Foundry as a means of lessening dependence on foreign fabrication capacity, which was hitherto dominated by $TSM.
A cap of 10% on credit card rates of interest could significantly limit credit, cutting off a large number of consumers, according to the leadership of JP Morgan. This is an indication that regulation aimed at helping consumers may end up tightening financial conditions.
However, leadership at the Citadel pointed out that excessive spending by governments beyond what is financially sustainable is a significant source of risk in the global economy, although hope exists that increased productivity through AI may mitigate this problem in the future.
A partnership announcement between OpenAI and a healthcare system integration emphasized the need for a common infrastructure in the digital space, including record linkage, identity, payment systems, and data, as a foundation for effective scaling of artificial intelligence.
The leadership at $META confirmed that its latest AI models are performing well, with Superintelligence Labs having provided key internal models in January. The ability to control distribution, inference, and data continues to put Meta at a structural advantage in deploying AI.
The Magnificent Seven and the S&P 500

The S&P 500 is still dominated by the Magnificent Seven, where high valuations and a bout of profit-taking has resulted in disproportionate bear pressure compared to the rest of the market. Since these stocks drive a disproportionate amount of the recent market advances, their drag is what is holding back market-level advances. Until a reversal in these stocks or a diversification of leadership, advances at the index level will likely be limited.
Major Index Performance as of Tuesday, 20 Jan 2026
- Nasdaq: Trading at 23,225, supported by large-cap technology but highly sensitive to valuation compression.
- S&P 500: Trading at 6,905, stabilising after recent volatility with narrow leadership.
- Russell 2000: Trading at 2,698, showing relative resilience as investors rotate selectively into smaller-cap exposure.
- Dow Jones: Trading above 49,000, benefiting from its defensive and industrial composition.
As a group, we continue to prefer selective exposure to the market, emphasizing earnings resiliency, a strong balance sheet, and more structural themes such as AI and infrastructure, and remain tentative on broad index exposure until breadth improves.
Gold Price: How Geopolitics & Economic Statistics Impose Gold Price Patterns Today?
Current spot gold prices are being maintained in a relatively high historical range between $4,750-$4,880 per ounce. Current political sentiment on the Greenland agreement, dismissal of military force options, and a lessening of tariff risks to Europe has tempered near-term escalation risks and led to a short-term period of consolidation rather than a reversal in gold prices. Although these political sentiment factors temper near-term safe-haven requirements, they do not abate overall uncertainty. At the same time, near-term economic releases such as Final GDP, Unemployment Claims, GDP Price Index, and Core PCE prices remain critical. Weaker-than-expected readings on growth or inflation will further reinforce expectations for easier monetary conditions, which will support gold prices through further reductions in real yields and continued hedging requirements. Unexpectedly strong readings may produce near-term pressures on gold prices; however, due to gold’s current high levels, any downturn may be better characterized by a repositioning trade rather than a trend reversal.
The economic news of yesterday has already set the stage for a cautious yet supportive environment for gold. The slowdown in wage growth, the ease in service sector pressures, and the emergence of uneven economic slowdowns all contribute to the perception of a softening of inflation risks without a concomitant acceleration in economic growth. All of these factors hold real yields in check and support the use of gold for both diversification purposes as well as a risk-off measure for policy mistakes. Even as the tenor of the rhetoric in the geopolitical arena turns from conflict to diplomacy and stability, the underlying environment of policy uncertainty, looming high-impact economic data, and the risks of global alignment will continue to support the demand for gold at elevated levels. The gold price will thus remain supported not by a shock-driven catalyst but rather by a confluence of macro-geopolitical factors that support its use as a strategic asset rather than a trade.
Oil Prices: Why Are Oil Prices Volatile Amid Geopolitics and Key Economic Data?
Crude oil prices are currently ranging in a relatively tight and volatile manner, with Brent crude ranging around $65-$66 and West Texas Intermediate ranging around $60-$61, as the markets are grappling with the tug-of-war between the lessening of headline geopolitical tensions and the overall level of demand uncertainty. The more recent indicators of a lessening of diplomatic tensions surrounding the Greenland situation and the clear shift toward a non-tariff escalation policy have lessened the near-term risk of a downturn for global trade, which is helping oil demand sentiment. On the supply side, the views from the global energy agencies that the medium-term demand is strong are still helping provide a floor for oil prices, while the higher inventories and heightened sensitivity to growth views are also keeping oil volatile rather than directional.
Current political rhetoric and macroeconomic indicators have become more prominent as the key shorter-term influences. Comments regarding record levels of oil and gas production, energy dominance, and security needs continue to support the view of a strong supply profile, offsetting any price gains despite heightened geopolitical rhetoric. Economic releases yesterday also helped to keep the tone dampened, with signs of moderation in price pressures and uneven growth supporting concerns of slower, rather than faster, demand growth. As a result, oil prices continue to trade defensibly despite improved risk conditions. Going forward, economic releases, including Final GDP, unemployment claims, GDP Price Index, and Core PCE, will be essential. A softer economic outcome is likely to soften the dollar and support oil prices, reducing financial conditions and stabilizing demand growth. A strong economic result may, on the other hand, support a strong dollar and renewed concerns regarding policy and demand growth, capping gains for oil.
Bitcoin Prices: Why Is Bitcoin Falling Despite Pro-Crypto Policy Signals and ETF Inflows?
Bitcoin is currently ranging around the high $80,000 levels, between $87,000 and $90,000, after a strong downward move that erased all the gains made since the start of 2026. The cause for the strong downward move is a derivatives-led liquidation wave, which resulted in the enforced closure of over $1.5 billion of levered long positions as key technical levels of support were breached. This selling came despite a series of highly constructive politicians’ statements on trade de-escalation, geopolitical diplomacy, and direct statements that positioned the local market as the future global hub for crypto innovation. Although such policy statements are highly constructive for Bitcoin’s long-term adoption and regulatory framework, they have clearly done little to protect Bitcoin against the underlying mechanics of the enforced closure of levered positions during risk-off periods. Bitcoin remains a strong liquidity vehicle and less of a geopolitical hedge during risk-off periods.
On an ecosystem level, the situation is still complicated rather than purely bearish. ETF spot inflows in Bitcoin saw a huge increase to $843 million in a single day and $1.7 billion over three days, making clear that institutional engagement is still very much in play despite market turmoil. Still, historical analysis makes clear that strong ETF inflow spikes often precede short-term retracements in markets due to momentum-driven reversals in leverage dynamics. Observations on-chain regarding Bitcoin supply being mobilized to exchanges during this sell-off further validate that this is a repositioning exercise and not a conviction-driven collapse. Yesterday’s economic releases continued to promote prudence on risk assets in aggregate, indicating uneven growth dynamics, a moderating yet uncertain inflation path, and a marked vulnerability to upcoming releases on GDP, jobs, and inflation today. Weaker economic releases today may stabilize Bitcoin sentiment through easier liquidity dynamics to slow this drawdown process; otherwise, further market turmoil may ensue due to a further-tightened financial environment and continued repositioning dynamics in markets.
ETH Prices: How ETF Flows and Whale Trades Influence Ethereum Prices in the Present Scenario
Ethereum is currently range-bound in the vicinity of the $3,000 mark, as the balancing act between demand and supply continues. The price of Ethereum is stable, thanks to the renewed interest of institutions in the Ethereum spot ETF, which recorded fresh net inflows over the last week, a significant change from the trend of net outflows that was witnessed towards the end of last year. The net inflows in the Ethereum spot ETF are a clear indication of long-term strategic planning rather than short-term trading, which is a welcome change in the Ethereum price dynamics. On the other hand, the on-chain activity also indicates that a significant portion of the Ethereum is being staked away in long-term storage mechanisms, thus reducing the supply of liquid Ethereum in the market.
Yet, the system does not operate in a vacuum and is instead balanced by opposing forces. The whale actions in this space have been somewhat contradictory, with some large investors accumulating and staking ETH, and others transferring large amounts to exchanges, likely in a profit-taking or defensive play. The latest news of individual wallets transferring tens of thousands of ETH to exchanges has added a degree of selling pressure, leading to a range-bound rather than a break-out market trend. The overall macroeconomic environment yesterday added to this degree of caution, with uneven growth and inflation dynamics leaving a degree of ambiguity in a selective risk environment. For tomorrow, it will be important to see what happens in today’s economic data, with weaker growth and inflation metrics likely to improve liquidity and support ETH in a positive risk environment, and vice versa.
