Where Are Markets Today?
Equity futures in Europe and the US are set to open lower as the risk-off sentiment seen towards the end of the prior session continues to dominate the markets. US equity index futures have retreated overnight as the sell-off in large-cap technology companies continues to worsen. European equity futures have followed the lead of the US markets as the risk-off sentiment continues to dominate the markets globally. The markets are opening lower as investors are hedging their risks as a result of the widespread sell-off in equities and other riskier assets globally, as well as a result of the earnings-related surprises that have shaken investor sentiment and the sustainability of earnings growth.
Equity index futures in the US have been pressured by the sell-off in the technology sector as a result of the sharp decline in a large-cap company’s stock price post-earnings as investors worry about the sustainability of high capital expenditure plans in the face of margin sensitivity in the near term. Software stocks have continued to sell off as investors worry about the rate at which artificial intelligence is adopted and its potential to disrupt the traditional earnings model. This has pressured the Nasdaq futures the most as the S&P 500 futures have also been pressured by the concentrated leadership risk as the market breadth worsens.
Futures in Europe are under pressure for two reasons, which are related to each other. First, there is a spillover from the US tech sell-off, which is impacting growth-oriented and export-oriented assets that are more sensitive to capital markets globally. The second factor is the overall asset class risk-off sentiment, which is manifest in the sharp price movements in digital assets and precious metals, leading to a defensive stance in European markets, where investors tend to de-risk more aggressively compared to trading based on local fundamentals in a scenario of global volatility.
Overall, the European and US futures are pointing to a market that is bracing rather than buying, driven by high volatility in tech assets, a renewed move against speculative assets, and a lack of macro drivers to boost sentiment going into the end of the week. Until there is a better sense of earnings strength, capital spending, and macro fundamentals, the overall bias in these markets will remain to the downside, driven more by capital preservation rather than opportunistic investment.
Major Index Performance as of Today
- Nasdaq Composite: Currently trading at 23,501.24, impacted by weakness in growth and software sectors.
- S&P 500: Currently trading at 6,917.81, declining from recent highs due to weakness in mega-cap technology.
- Dow Jones Industrial Average: Currently trading at 49,098.71, showing relative strength but still declining alongside the broader markets.
- Russell 2000: Currently trading at 2,624.55, highlighting volatility and risk aversion in small-cap stocks.
The Magnificent Seven and the S&P 500
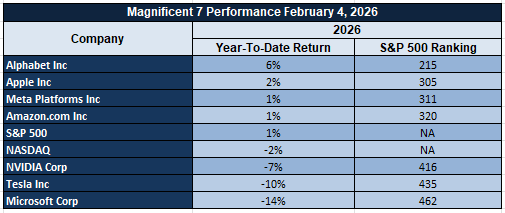
The Magnificent Seven continues to weigh on the market as a whole. Apple, Microsoft, Nvidia, Amazon, Meta, Alphabet, and Tesla have all come under pressure as earnings sensitivity, margin pressure, and AI monetization risks weigh on the sector. As a result of the significant market weight of these seven companies, the impact of the sell-off is having a material impact on the S&P 500 and the Nasdaq Composite. The continued theme of narrow leadership remains a headwind to the market as a whole.
Drivers Behind the Market Move – Friday, February 6, 2026
As the United States and European markets enter the final session of the week, market sentiment appears to be dictated by an unusual number of policy developments, high macro sensitivity, and the release of key economic indicators. Recent events from the United States, coupled with the lingering effects of yesterday’s sell-off and the anticipated economic releases for the day, have dictated a subdued risk appetite in both markets.
- Policy Shock and Governance Risks Following the Latest Trump Announcements
Market participants continue to process the recent spate of policy announcements from the United States, including the launch of a government-backed prescription drug discount program, a significant civil service reform initiative, renewed election administration oversight, and a tough stance on immigration policies. While these policies are intended to be domestic-centric reforms, the market is currently focused on the second-order effects of these policies, which include regulatory risks and the potential for abrupt implementation risks. European markets are responding defensively to these recent developments from the United States, which have raised institutional risks and the potential for spillovers to the European economy.
2. Heightened Sensitivity Ahead of Consumer-Focused Economic Data
However, attention is now fixed on the scheduled announcement of today’s preliminary inflation expectations and consumer sentiment data at a point when yesterday’s labor-related data pointed to a weakening of underlying momentum. As a result, investors are taking a cautious approach as either set of data could have a negative impact on equities. The asymmetry in risk is prompting a wait-and-see approach, and as a result, U.S. and European stock market futures are trading lower.
3. Ongoing Risk-Off Spillover From Technology and Cross-Asset Volatility
The technology-driven risk-off scenario witnessed in the markets yesterday continues to influence market behavior today. The weakness in large-cap technology and software shares is affecting the U.S. stock markets and is also reflecting in European markets as a result of global sectoral connectivity. At the same time, the high volatility in crypto and commodities is also affecting market behavior and prompting a risk-off scenario. Until volatility dies down and investors’ sentiment improves regarding earnings and policy-related issues, markets are likely to be dominated by downside risk protection.
To conclude, a combination of factors is affecting market behavior today. The rise in policy-related uncertainty and the high sensitivity to today’s economic data releases, along with the lingering effects of a technology-driven risk-off scenario witnessed in the markets yesterday, are affecting market behavior. Investors in the U.S. and European markets are approaching today’s trading session cautiously.
Digesting Economic Data
The Trump Tweets and Their Implications
The statements and policy initiatives that have come out recently reflect an administration that is moving full steam ahead on multiple fronts, domestically and institutionally. The rollout of the government-supported prescription discount program, which has been framed as a direct response to higher prescription drug costs for Americans in comparison to other countries, adds an additional layer of risk for pricing intervention in healthcare and pharmaceuticals. Although this has been framed in a manner that benefits consumers, markets have historically viewed these sorts of actions as being negative for the healthcare supply chain, particularly in terms of pricing. The way this has been framed by the media in other countries, in terms of populism, adds an additional layer of risk that this type of policy instrument will be rolled out to other areas of cost of living, should political pressures necessitate it. With respect to the stance that has been taken on immigration and election policies, the tone has been set firmly but also ambiguously, which has been strategic in nature. There has been an openness to negotiation, but also clear red lines that have been drawn, while statements around election oversight, potential federal involvement, and continued pressure on voter rolls increase the level of political and legal friction that is being perceived. Although this does not have an immediate impact on markets, it does increase the level of risk premium that is being taken for overall governance. When legal groups begin to discuss the potential for challenges, and agencies begin to roll out frameworks that increase the overall level of executive powers, investors typically factor in longer policy timelines, higher levels of uncertainty, and the potential for abrupt policy changes.
The announced civil service overhaul is one of the most significant changes in the structure. The extension of firing authority, the restoration of earlier administrative systems, and the adjustment of whistleblower laws enforcement all seem to be leading to a more centralized and directive form of governance. From a market’s viewpoint, this can be a double-edged sword in terms of the potential for volatility in the implementation of the policies announced or enacted. This seems to be leading to a greater sense of uncertainty when it comes to the stability of the regulatory environment, especially as it relates to areas sensitive to federal staffing and oversight/enforcement.
In the context of the world stage, the messaging seems to have been mixed but significant nonetheless. The claims of a stronger state of global security conditions, coupled with a warning to hostile groups and the apparent progress towards compliance with arms control agreements, seem to be an effort to project strength while stabilizing key geopolitical relationships. The welcome given to the administration’s choice for the leadership of the nation’s central bank by the leaders of their foreign nations’ central banks seems to be highly relevant to the markets as a potential harbinger of stability in the context of monetary policy coordination despite the domestic political volatility.
Jobless Claims Rise, Labor Friction Emerge
Initial claims on unemployment benefits increased to 231,000 during the week ending January 30, beating expectations as severe winter weather led to temporary layoffs in several states. The four-week rolling average climbed to 212,000, its highest level since mid-2023, indicating that labor friction is becoming more visible in the data. Although severe winter weather impacts initial claims data, the breadth of the increase, particularly across large regional economies, indicates that labor market resilience is no longer universally improving. Based on our perspective, this represents a change from rapid labor normalization to a more uneven employment landscape.
Continuing claims also increased to 1.844 million and rose on a year-over-year basis, indicating slightly stickier unemployment rates as the headline number remained below expectations. From our perspective, this represents re-employment activity slowing down as workers are taking longer to re-enter the labor market. We recommend that analysts interpret this as labor demand growth slowing down as frictional unemployment is increasing, particularly as workers are taking longer to re-enter the labor market.
From this perspective, we recommend that analysts view the home improvement retail space as an area of value as concerns over slower home turnover and lower consumer spending are already reflected in the company’s valuation multiples. The labor market is slowing down, and wages are stabilizing, which can be a positive factor in home improvement spending without reigniting labor costs. Analysts should monitor the weekly claims data beyond weather impacts, income growth, and home spending data as an indicator of whether labor friction is leading to more stable discretionary spending patterns.
Jobless Claims Rise, Labor Friction Develops
The initial jobless claims increased to 231,000 for the week ended January 30, exceeding analysts’ expectations due to severe winter weather, which led to temporary layoffs in multiple states. The four-week moving average increased to 212,000, its highest level since mid-2023, confirming that temporary labor market disruptions are becoming more visible in the jobless claims series. Although the impact of severe weather on jobless claims is only temporary, the breadth of the increase in jobless claims, especially in large regional economies, indicates that labor market normalization is no longer a one-way street. In our view, this marks a shift from rapid normalization to a more irregular labor market.
Continuing jobless claims increased to 1.844 million, rising on a year-over-year basis, which indicates a slightly sticky unemployment rate despite the actual jobless rate falling below analysts’ expectations. This indicates that re-employment is slowing down, with workers taking longer to get back to work after being laid off or terminated. Analysts should interpret this as a warning sign of a cooling labor market, which may result in a decrease in wage pressures in the coming months, while frictional unemployment is rising in the background.
In this context, we see value in Home Depot shares, where the valuation has already discounted the potential impact of a slower labor market on home renovation activity due to a decrease in housing turnover and a decrease in consumer spending. Analysts should monitor the jobless claims momentum excluding the influence of severe weather, household income, and home-related spending to determine whether the labor market is indeed cooling down, which should result in steadier renovation activity without reigniting wage pressures, which would negatively impact margins.
Tech Rotation Deepens as Capital Reprices AI
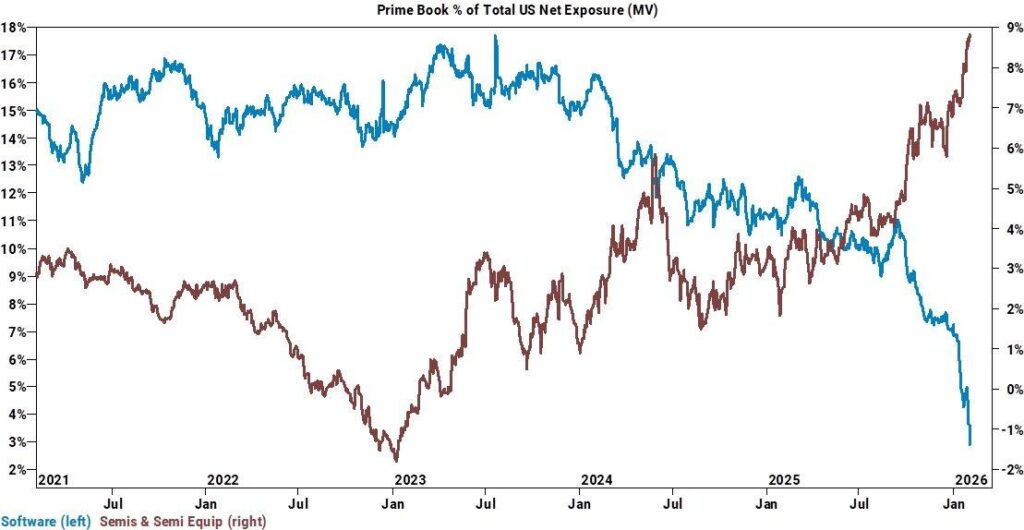
Data on institutional positions reveals a significant divergence in technology stocks, with software stocks hitting multi-year lows in technology allocations and semiconductor stocks hitting record highs. The rapidity with which these positions are changing is more than a simple risk management move; it is a repricing of where technology capital expects AI earnings to be generated. The significant selling in software has also been accompanied by extreme supply readings and record highs in trading volumes in broad software funds.
At its core, the technology rotation is driven by capital discipline, where investment cycles in AI are now shifting spending towards physical infrastructure and compute power rather than application-layer growth stories with longer cash flow cycles. Software stocks are being stress-tested against increasing expectations of near-term cash flow generation as AI investment cycles continue to accelerate. Analysts should recognize this as a rotation in technology stocks rather than a risk-off move, with economic data acting as the primary catalyst for this rotation.
Within this backdrop, we see relative value emerging in Broadcom, which has exposure to high-performance chip technology that benefits from sustained capital expenditure in AI technology. Broadcom has pricing power and long-term visibility compared to software stocks that are facing margin and growth pressures. Analysts should monitor enterprise technology spending budgets, data center spending trends, and upcoming economic data releases to confirm that this rotation is sustainable. Semiconductor leaders with exposure to infrastructure spending are more likely to outperform software stocks with high valuations if the current economic narrative is correct.
Housing Stress Increases in Climate-Exposed States
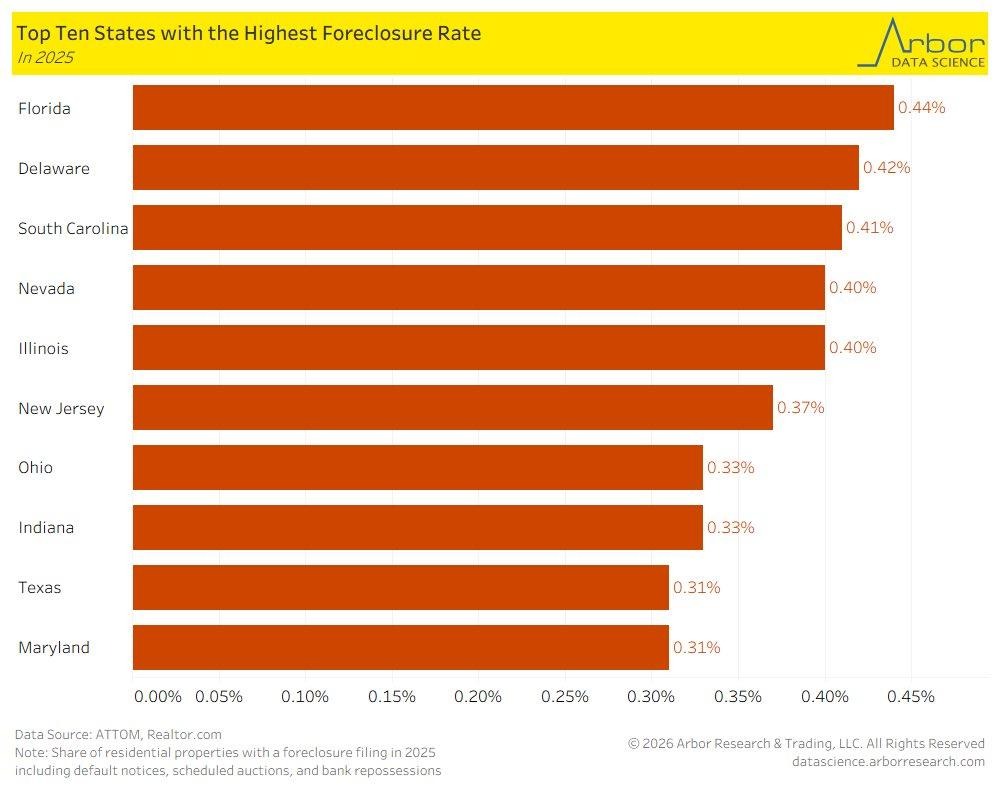
The housing stress metrics indicate that one of the larger southern states is currently dominating the national landscape for residential foreclosures in 2025, with levels now surpassing those of other traditionally housing-vulnerable states. However, the rise is not due to decreased demand but instead an increasing affordability challenge, driven by sharply increasing ownership costs. This is because homeowners are currently experiencing increasing insurance premiums, already-high property taxes, and persistently high maintenance costs. From our point of view, this indicates an increasing housing stress cycle driven by costs, not housing demand.
The Insurance costs have become the primary factor driving the equation because they have risen by more than 40% since 2020, driven by the increasing severity of extreme weather events. When combined with increasing taxes and maintenance costs, the equation for housing ownership costs has shifted significantly for housing markets that have been climate-exposed. It is essential for housing analysts to note that the newer housing buyers have higher levels of leverage and less savings, which makes them more vulnerable compared to longer-standing housing owners. This could create housing stress issues that might not necessarily translate into a national housing reset but instead become localized problems.
In this environment, we believe that D.R. Horton has significant relative value potential because of its size, geographic diversification, and exposure to the entry-level housing market, which will likely experience increasing demand because of the rise of foreclosures. Analysts should note that the increasing levels of foreclosures will likely cause housing demand to shift towards new, less expensive housing developments instead of causing an absolute decrease in housing demand.
Orders: Crossover flags goods-led rebalance
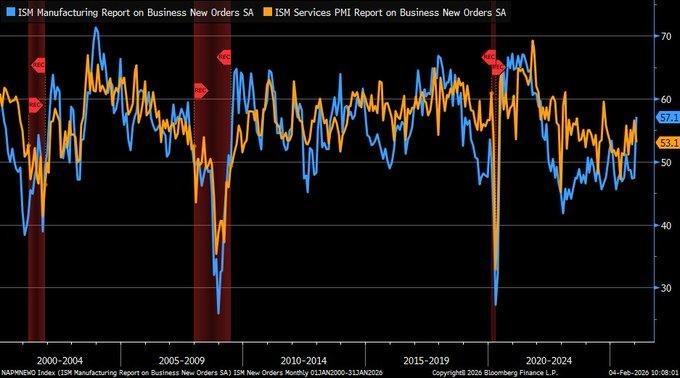
We have spotted a rare divergence in new orders data in January, with a notable crossover in the series after several years. Manufacturing new orders have surged to a robust expansion with a series reading at its strongest since early 2023, highlighting a decisive rebound from recent contraction. This is likely due to an improvement in supply chain pressures and a normalization of inventory levels, which should allow goods producers to quickly adapt to rising orders. In our view, the strength of the rebound indicates more than a cyclical blip in the series, which points to a rotation in the economy’s growth drivers back to tangible output.
Meanwhile, new orders in the services sector have softened but still point to expansion, likely marking a maturity in the series rather than a slowdown. Historically, crossovers in goods and services new orders have coincided with important turning points in the broader economy, which often presage changes in capital spending or inventory activity. Analysts should not mistake this crossover as a warning of an economic downturn, which it is not, but rather a rebalancing of growth drivers, where the economy shifts rather than slows down.
Under this backdrop, we see relative value opportunities in Caterpillar, which should gain from a pickup in equipment spending as producers seek to capitalize on rising order books and improving supply chain visibility. Analysts should monitor forward-looking manufacturing orders, inventory-to-sales ratios, and capital expenditure plans to determine whether this goods-led rebalancing is sustained. Industrials with a focus on tangible output and replacement should be preferred over services-oriented names in a potential rebalancing of growth drivers.
Small Firms Stall as Hiring Gap Widens 
The latest employment data for January shows that private sector hiring activity is slowing sharply. The payroll growth figure is much weaker than expected and shows that almost all of the hiring activity is coming from larger firms. Firms with 20-49 workers experienced their fifth straight month of payroll decreases. This trend has been ongoing since late 2025. From our point of view, this underlines the widening gap in economic resilience where the size of firms is playing an increasingly important role in hiring activity. The difficult financial environment and lower end-demand are impacting the ability of smaller firms to hire new workers.
On the other hand, larger firms are continuing to hire at an incremental pace. We believe that this is an important trend that needs to be considered. Analysts should be less concerned with the overall payroll growth and more concerned with the breakdown by firm size. This will give an idea of what is happening beneath the surface. The overall payroll growth is masking the hiring activity of smaller firms. The hiring activity of smaller firms is likely to have an impact on consumption and service demand in the coming period.
Therefore, we believe that relative value is building in the case of Paychex. The reason for this is that its business model is less affected by overall hiring activity. The reason is that firms are required to comply with regulations and hire payroll services regardless of the overall hiring activity. Therefore, we believe that this is an opportunity that needs to be considered. Analysts should be looking at small business credit conditions and wage growth.
Upcoming Economic Events
President Trump Speech, Preliminary UoM Inflation Expectations, Preliminary UoM Consumer Sentiment
As we approach a critical period in macroeconomic events, the markets are entering the week with high sensitivity to the outcomes of the macroeconomic events scheduled to be announced this week. The recent macroeconomic data have shown resilience in some areas and emerging concerns in others. Therefore, the forward-looking indicators are likely to play a crucial role in determining the market’s next move. As we see it, the outcomes of the macroeconomic events scheduled to be announced this week will be critical in determining whether the market will continue with the expansion or will start to adjust to a defensive stance. Below is a brief overview of the market’s potential response to the outcomes of the macroeconomic events scheduled to be announced this week.
President Trump Speech
President Trump’s speeches are usually market movers, particularly when the speech is made at a time when the market is experiencing mixed economic momentum.
- If the speech is market-moving and the President emphasizes the positives in the market, such as the growth prospects, trade balances, and inflation, the market is likely to interpret the speech as a move to raise interest rates. As a result, the market is likely to be negatively affected, particularly the stock market, while the US Dollar and the yield curve are likely to move higher.
- Alternatively, if the speech is market-moving and the President emphasizes the negatives in the market, such as the need to lower interest rates and stimulate the economy, the market is likely to be positively affected, particularly the stock market.
Preliminary UoM Inflation Expectations
This data point continues to rank among the most significant measures of how consumers perceive future inflation.
- If the data tops expectations, it could signal that underlying inflation pressure remains embedded within the consumer psyche, which could have significant implications for the financial markets going forward.
- If the data falls short of expectations, it could signal that underlying inflation pressure is abating, which could have positive implications for the broader equity markets. Analysts should also pay close attention to how this data point compares to the underlying price trend, as underlying shifts tend to have significant market-moving implications.
Preliminary UoM Consumer Sentiment
This data point provides insight into how consumers perceive the broader economy and their willingness to spend.
- If the data tops expectations, it could signal that underlying consumer sentiment remains robust, which should have positive implications for the broader equity markets. However, underlying strength could also signal that underlying demand remains too strong to abate underlying inflation pressure.
- If the data falls short of expectations, it could signal underlying weakness in the broader economy, which could have significant implications for the broader equity markets. Analysts should also pay close attention to the underlying expectations data, which often precedes underlying spending patterns.
Stock Market Performance
Indexes Experience Powerful Rebound from April 8th Lows
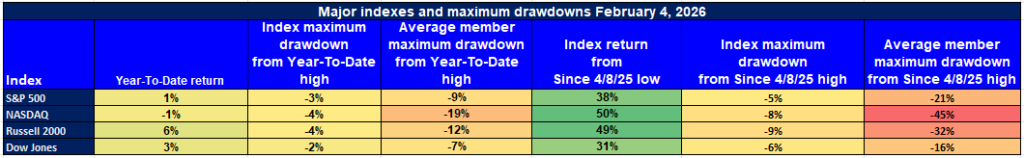
The equity markets are experiencing a strong recovery from the April 8th low. The major stock market indexes are experiencing strong percentage gains. However, the year-to-date performance of the markets is mixed. The data on the maximum drawdown continues to show that there is a significant gap between the performance of the stock market indexes and the average experience of the individual constituents. From our perspective at Zaye Capital Markets, the data continues to show that the markets are experiencing a recovery but are not yet healing. Below are our thoughts and analysis of the performance of the individual stock market indexes. The analysis is strictly based on the latest data available.
S&P 500: Strong Recovery, Narrow Leadership
YTD: +1% | +38% since April low | -3% from YTD high | Avg. member: -9%
The S&P 500 stock market index has experienced a strong 38% recovery since the April low. However, the performance over the year-to-date period is only 1%. The stock market index has only experienced a 3% maximum drawdown since the year-to-date high. However, the average stock in the index has experienced a 9% drawdown.
NASDAQ: Powerful Rebound, Severe Internal Stress
YTD: -1% | +50% since April low | -4% from YTD high | Avg. member: -19%
The NASDAQ has the largest recovery from its April lows, with a 50% gain. It is also the weakest index with a 1% year-to-date performance. Although the index has declined by a modest 4% from its YTD high, the 19% average member drawdown indicates a strong recovery bias towards growth stocks.
Russell 2000: Small-Cap Stocks’ Recovery Not Deep Enough
YTD: +6% | +49% since April low | -4% from YTD high | Avg. member: -12%
The Russell 2000 index has risen 49% from its April low. It is also the best-performing index year to date with a 6% gain. Despite its impressive performance, the 12% average member drawdown indicates that the small-cap index’s recovery is shallow.
Dow Jones: Relative Stability with Ongoing Pressure
YTD: +3% | +31% since April low | -2% from YTD high | Avg. member: -7%
The Dow Jones index has risen 31% from its April low. It is also the index with the shallowest drawdown of 2%. Despite its impressive performance, the 7% average member drawdown indicates a shallow recovery.
We continue to view the market as being in a recovery phase with shallow breadth. The performance of the indices is impressive. The consistent difference between the indices’ performance and the average member’s performance is a reminder of the need to be selective. The market’s volatility and rotation risks remain key characteristics of the market.
The Strongest Sector in All These Indices
Energy Leads the Pack, Extending Its Dominance Year-to-Date
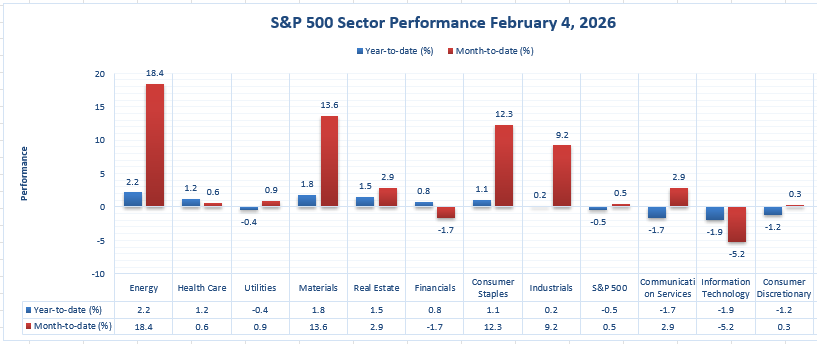
According to the data on the performance of the different sectors in the market, as reflected in the figures provided above, Energy is the clear leader among all the sectors in the market’s sector lineup. In fact, year-to-date, Energy has posted a 18.4% increase, which is the highest year-to-date gain among all the sectors in the market’s lineup. On 2/4/2026, Energy also posted a 2.2% increase, which shows that leadership is not only evident year-to-date but is also active in the most recent session.
The strength of Energy’s leadership Is also evident in the fact that there is a wide margin between Energy’s year-to-date gain of 18.4% and the gains posted by the other sectors in the market’s lineup, which are Materials at 13.6%, Consumer Staples at 12.3%, and Industrials at 9.2%. Furthermore, the overall market has only posted a year-to-date gain of 0.5%, which shows that the strongest year-to-date gains are being posted by a specific sector.
Our view at Zaye Capital Markets is that the above data show that the market’s year-to-date gains are not necessarily being driven by a rising tide but are instead being driven by specific sectors in the market’s lineup. We also believe that if Energy is able to continue its leadership, analysts should also be on the lookout to see if its daily gains are able to stay positive as they did on 2/4/2026, with a 2.2% increase, or if leadership is able to pass on to other strong-performing sectors like Materials (1.8% on 2/4/2026) and Consumer Staples (1.1% on 2/4/2026).
Stock Market Overview – Friday, 6 Feb 2026
The U.S. stock market is trading cautiously today as investors digest the recent weakening in the labor market, high valuation pressures, and the continued weakness in the large-cap technology sector. The overall sentiment in the stock market is weakening as investors shift away from growth-oriented stocks, especially in the software and mega-cap technology space. The defensive stocks, however, provide some respite to the overall market. In our view at Zaye Capital Markets, the current environment is characterized by increasing selectiveness, and the recent performance in the overall stock market is actually obscuring the underlying stress in the individual stocks.
Stock Prices
Economic Indicators and Market Drivers
The overall direction in the stock market today is being determined by the interplay between macro-level uncertainties and sector-level stock movements. The recent data on the labor front showed that the number of layoffs is increasing and hiring is weakening, which is making investors nervous about the overall resilience in the economy. The recent announcements from the large-cap technology stocks about their capital spending plans, especially in the infrastructure space to develop artificial intelligence, have raised some questions about the overall cash efficiency and the overall return on investment in the short term. The recent weakness in the software stocks is also due to the overall weakening in the growth story as the overall competition is increasing in the sector.
Latest Stock News
$ARM | AI narrative pushback: The company’s chief executive said the sell-off in the AI software sector is the result of “micro-hysteria” and that the sector is still in the very early stages of adoption. The key stock market story is that investors are lumping very different business models in the AI space, which is leading to increased levels of mispricing risk in the overall sector, especially in the software and hardware stocks that have exposure to the AI theme.
$HIMS | Aggressive GLP-1 Pricing Meets Regulatory Pressure: The company is launching a compounded semaglutide pill at a $49 intro price and a $99 monthly cost on a subscription model, compared to a $199 monthly cost for a similar pill from a competitor. The company is launching a multi-cancer early detection service that uses a blood test that screens for 50+ cancers, launching at a $250 discount. However, there was commentary on the regulatory response to mass-marketed illegal copycat drugs and misleading similarity claims, creating a risk for the compounded drug space.
$NVDA / $MU | Memory Constraints Shift Winners: The company is not launching a new gaming GPU as a result of the ongoing memory chip shortages. The implication is that high-end memory is in short supply and is being allocated to data center AI workloads, reinforcing the setup for the memory suppliers that are connected to high-end data center workloads.
$NVO / $HIMS | Competitive Messaging Escalates: The company saw a competitor’s chief executive criticize the company’s compounded GLP-1 pill, saying that users would “be wasting $49” as a result of absorption. The implication is that there is a rising risk of reputational and regulatory pressure, not just competition.
Anthropic | Model Capability Leap Fuels Software Pressure: The company is launching a new major model upgrade, including improvements in planning, longer workflows, large codebases, and improved self-correction. This fuels the fear that a segment of the software stack could see faster disruption than priced, creating a rotation dynamic.
$IREN | Data Center Expansion: The company is launching a 1.6 gigawatt data center in Oklahoma, reinforcing the idea that data center infrastructure is expanding at an accelerating rate. The implication is that access to power is the key constraint in the AI compute landscape.
$AMZN | AWS spend, backlog, and power become the headline: The company emphasized that the vast majority of capital spending is going towards AWS, where AI infrastructure spending continues to drive growth as demand continues to outrun installed capacity. The company emphasized that AI capacity is being monetized as fast as it is being installed, while the company’s internal AI chip development program is now at a multibillion-dollar run rate and is fully subscribed. The AWS backlog was emphasized at $244 billion, a 40% increase year over year and 22% sequentially. The company has added 3.9 gigawatts of capacity within the last year, including 1.2 gigawatts within the fourth quarter, while the company is targeting to double capacity once again by the end of 2027—reiterating the point that power is the limiting factor within the current spending cycle.
The Magnificent Seven and the S&P 500

The Magnificent Seven continues to weigh on the market as a whole. Apple, Microsoft, Nvidia, Amazon, Meta, Alphabet, and Tesla have all come under pressure as earnings sensitivity, margin pressure, and AI monetization risks weigh on the sector. As a result of the significant market weight of these seven companies, the impact of the sell-off is having a material impact on the S&P 500 and the Nasdaq Composite. The continued theme of narrow leadership remains a headwind to the market as a whole.
Major Index Performance as of Today
- Nasdaq Composite: Currently trading at 23,501.24, impacted by weakness in growth and software sectors.
- S&P 500: Currently trading at 6,917.81, declining from recent highs due to weakness in mega-cap technology.
- Dow Jones Industrial Average: Currently trading at 49,098.71, showing relative strength but still declining alongside the broader markets.
- Russell 2000: Currently trading at 2,624.55, highlighting volatility and risk aversion in small-cap stocks.
At Zaye Capital Markets, we are of the opinion that this is a fragile market, and it’s a market characterized by a lot of rotation rather than expansion. We are also of the opinion that until this market shows leadership outside a small group of large-cap names and macro clarity, volatility is likely to remain a key feature.
Gold Price: What Is Driving Gold Prices Today Amid Policy Shifts and Key Data Risks?
Currently, spot gold is trading at around $4,820 per ounce, consolidating after a sharp corrective move from recent price highs above the $5,500 per ounce level. The price action can be characterized by a shift in market sentiment, where the recent sharp move has been replaced by a phase of reassessment, where macroeconomic factors are now the dominant drivers of gold price movements. The recent spate of political events, including the rollout of a government-backed prescription drug discount program, renewed immigration talks, civil service reform, and increasing scrutiny of election administration, have raised the sensitivity of policy risks for institutions. While these are not inflationary measures per se, they are a part of the overall uncertainty surrounding fiscal priorities, regulatory enforcement, and overall political stability, which has historically bolstered gold’s role in portfolios. As far as today’s data is concerned, inflation expectations and consumer sentiment data have asymmetrical importance for gold price movements, where a stronger-than-expected reading for inflation expectations will bolster gold’s role as a hedge against purchasing power erosion, while a weaker-than-expected reading for consumer sentiment will bolster safe-haven flows due to a worsening growth outlook. A weaker reading for inflation expectations will likely cap gold price gains, although this will not necessarily lead to a breakdown in gold price support due to the overall policy noise in markets.
The economic data reported just yesterday has already provided a supportive background for the yellow metal as it continues to create a narrative of caution. The rise in jobless claims and signs of weakening labor demand have raised further concern about the growth rate as it may become unbalanced despite the still-untackled inflation risks. From a broader ecosystem point of view, the price of gold is now being influenced by three factors: high political and regulatory risk, inflation expectation data, and weakening labor market confidence. The consolidation around the support at $4,800 should be viewed more as a digestion phase after a strong run-up in the price of the yellow metal. As long as policy risk remains high and economic data continues to display mixed signs instead of acceleration, the price of gold is likely to remain structurally supportive in this new higher price range.
Oil Prices: What are the Factors Behind the Current Oil Prices in Light of Geopolitical Risk, OPEC-IEA Forecasts, and Economic Data?
Oil prices are trading at lower levels, with Brent oil trading at around $67.05 per barrel and WTI oil trading at around $62.77 per barrel, continuing their downward trajectory from earlier in the week. This comes after oil prices declined by almost 3% in yesterday’s trading session, largely in response to the confirmed talks between the US and Iran. However, oil prices are still relatively higher than the sell-off in other commodities, partly because of risk factors that tensions in the Middle East, particularly in the Strait of Hormuz, are likely to propel oil prices higher in the near term if talks fail. Yesterday, oil prices were also affected by weaker data in commodities, which were impacted significantly, with oil being one of the worst-hit assets as investors reduced their exposure to hard assets due to weaker risk sentiment and a stronger US dollar.
Recent statements made by President Trump on various policies have also impacted oil price movements. Although statements made by Trump on unrelated issues do not have a direct effect on oil price movements, his administration’s policies on issues like US and Iran relations and naval buildup have impacted oil price movements through expectations on oil supply risks. The recent escalation of tensions between the US and Iran and its effects on oil price movements were reflected in price increases towards the end of January, which have now eased due to official engagement on talks between the two nations. From a supply perspective, OPEC+ recently confirmed its plans to keep current oil output through March, which should support oil price movements and prevent a fall due to a lack of additions amid uncertain demand forecasts. Additionally, the International Energy Agency (IEA) recently revised its global oil demand growth forecast for 2026, indicating an improvement in demand, which should support oil price movements, even if current demand is impacted by surplus supplies. Upcoming inflation expectations and consumer sentiment reports are also crucial for oil price movements, as higher inflation and sentiment could weigh on demand and, in turn, oil price movements, while lower inflation and sentiment could weigh on risk assets, including oil, as investors seek safe haven assets.
Bitcoin Prices: Why Is Bitcoin Collapsing as Policy Uncertainty and Risk-Off Flows Intensify?
Bitcoin is currently trading at $64,800, a fact supported by today’s market pricing, which shows a steep and accelerated sell-off to levels not seen in over 15 months. This represents a breakdown below a series of long-term support levels, which is indicative of a capitulation event rather than a normal fluctuation. This has removed a substantial portion of the gains made since the end of 2024, leading to liquidation throughout the digital asset space. Context is key. A rise in policy flows, including the launch of a government-backed prescription drug pricing platform, the expansion of civil service overhaul, the intensification of scrutiny of the election administration, and the resumption of geopolitical warnings, has created a great deal of uncertainty within the macro environment. While serving as a hedge within the alternative space, during periods of institutional stress, bitcoin continues to act as a risk asset. As such, as the level of policy unpredictability increases, leverage is reduced, and bitcoin is experiencing the brunt of this as ETFs, forced selling, and momentum capital unwind.
Yesterda’s economic reports have continued this risk-off cascade. Jobless claims are rising, small business hiring is slowing, and labor demand is weakening, which are causing concerns about an economy losing momentum. This is a combination that tends to tighten financial conditions, increase real yield sensitivity, and decrease tolerance for speculation. This is why Bitcoin is facing a two-fold challenge: macro-driven capital outflows and structural selling pressures, which have already led global media outlets to label February 5 a day of capitulation for digital assets. Today’s inflation expectations and consumer sentiment reports are critical, and if inflation expectations rise, it could cause real yields to remain high, which could delay any respite for Bitcoin. Consumer sentiment could support Bitcoin if it causes investors to become risk-off, but this is uncertain and could cause a stabilization in price if investors are becoming risk-off across all assets, not just growth assets. Until macro uncertainty and institutional flows are stabilized, Bitcoin remains in a state of reset, where price discovery is being driven by liquidity conditions rather than long-term adoption narratives.
ETH Price: What’s Behind Ethereum’s Decline as ETF Flows and Whale Transactions Impact Demand?
Currently, Ethereum is trading at $1,910-$1,920, as supported by today’s market data, having undergone an aggressive decline from above $3,000 earlier this year. This has been highlighted through its technical analysis, showing that Ethereum has breached multiple support levels and has been declining aggressively since early February, settling at current levels. This decline has not been specific to Ethereum but has been part of an overall risk-off sentiment within the cryptocurrency market. Recent data from exchange-traded fund flows has highlighted that Ethereum has continued to witness sell-offs from its exchange-traded funds, as investors seek to de-risk and reduce their overall exposure to the asset and other cryptocurrencies amid macroeconomic uncertainty and increasing volatility within global financial markets.
Whale activity, however, is injecting a crucial counterweight to the Ethereum ecosystem. Recent trends in the Ethereum blockchain have shown large addresses buying or holding their Ethereum as the price drops to these levels, while smaller accounts and leveraged traders are liquidating their positions. This is a bullish sign for Ethereum as large investors are seeing the current levels as a buying opportunity. The high liquidation levels have been a significant contributor to the downward pressure, but the whale activity has been a crucial factor in slowing the decline and maintaining the price levels around the $1,900 mark. Yesterday’s economic indicators, especially the weakening labor market conditions, have been a crucial factor in the bearish sentiment for the markets, especially high beta assets like Ethereum. Today’s inflation expectations and consumer sentiment levels are crucial for the Ethereum price levels as a stronger inflation reading could continue to pressure the financial markets and the price levels of Ethereum, while a weaker reading could be beneficial for the price levels as it could shift the market sentiment to a bullish zone.
