Where Are Markets Today?
European and U.S. futures markets are opening flat or slightly mixed, suggesting that investors are taking a breather rather than pushing the markets further. U.S. futures that track the general markets are trading just above or below flat, with technology futures slightly higher and industrial futures slightly lower following sharp declines in individual stocks within the healthcare space. European futures are also trading quietly, with most major markets indicating a flat open as investors weigh stable growth conditions with still restrictive monetary policy. This lack of strong directional bias is a reflection of a global market that is looking for confirmation rather than momentum.
The first key reason for this positioning is that there is no fear of monetary policy changes, but rather uncertainty surrounding such changes. Financial markets around the world expect interest rates to remain unchanged today with central banks announcing their decisions. This eliminates any risk of interest rates increasing, but it also means that investors must focus on forward policy guidance. With inflation still well above target and growth conditions remaining strong, there is little incentive for central banks to signal easing, limiting upside potential but also limiting downside risk.
The second key factor is earnings concentration risk, particularly for large technology and platform companies. U.S. futures are benefiting from optimism related to major technology earnings, which continue to have an outsized impact on the performance of the broader markets. However, the large move down in a heavyweight healthcare stock in the previous session underscored the fact that the markets are still quite fragile. This is having a further impact on the overall caution in the futures markets, as investors are still reluctant to fully price in a positive move without confirmation from other earnings outside of the traditional leadership group. In Europe, similar trends are also evident, where export-oriented and rate-sensitive sectors are still constrained by yield and exchange rate factors, while defensive sectors are providing relatively little insulation.
The flat futures setup is also a function of a synchronized global caution, where European markets are still highly correlated with U.S. policy signals and global liquidity expectations. With central banks still maintaining a relatively tight policy stance, as well as an increasing dependence on data points, the overall futures positioning is a function of a willingness to react versus predict. As a result, until further clarification is available from policy communications and earnings results, both European and U.S. futures are likely to remain subdued, which is consistent with a broader market where conviction is driven by evidence versus anticipation.
Major Index Performance as of Wednesday, 28 Jan 2026
- The Nasdaq Composite rose 0.91% to 23,817.10, buoyed by gains in mega-cap tech and AI-related infrastructure stocks.
- The S&P 500 rose 0.41% to 6,978.60, maintaining its record high as it continues to be supported by a small group of leaders.
- The Russell 2000 rose 0.26% to 2,666.70, a reflection of a small improvement in participation.
- The Dow Jones Industrial Average fell 0.83% to 49,003.41, weighed down by weakness in healthcare and economically sensitive components.
The Magnificent Seven and the S&P 500
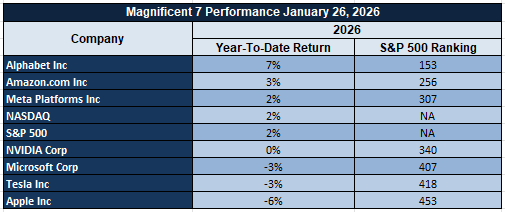
The S&P 500 remains heavily influenced by the “Magnificent Seven,” whose outsized index weight continues to mask weakness elsewhere. Despite strong long-term narratives around AI and cloud infrastructure, these stocks are being punished as valuation sensitivity, capital intensity, and supply constraints come under closer scrutiny. With leadership still concentrated and breadth lagging, index upside remains vulnerable to earnings disappointments or shifts in rate expectations.
Drivers Behind the Market Move – Wednesday, January 28, 2026
As markets in the U.S. and Europe absorb a plethora of monetary policy communications, political events, and earnings-related uncertainty, current market sentiment appears to be driven by a cautious tone rather than conviction. As markets in these regions continue to trade near historical highs but with decreasing participation, markets appear to be highly sensitive to monetary policy communications, fiscal policy signals, and near-term economic events.
1. Central Bank Event Risk and Policy Signaling
The most significant driver of markets in the U.S. and European regions today appears to be the Federal Funds Rate decision, FOMC statement, and press conference. Although markets expect the Fed to hold rates steady, the focus appears to be on forward guidance and Fed tone, particularly on inflation, growth momentum, and the prospect of easing rates in the near term. Recent economic data has revealed stabilizing economic growth, and this has prompted policymakers to adopt a wait-and-see approach to current economic events. As a result, markets appear to be cautious and hesitant to sustain current gains due to uncertainty surrounding monetary policy and the current economic environment. European markets appear to be highly sensitive to this particular driver due to their high exposure to global funding markets and currency stability.
2. Political and Fiscal Developments from the White House
Recent actions and statements by the president are also providing an additional degree of influence. The executive order intended to speed up rebuilding efforts in Los Angeles following wildfires, which includes overriding permitting delays, increasing waivers, and linking federal aid with speed of approval, reflects a more interventionist fiscal policy. This is being interpreted as positive for construction, materials, and infrastructure-related assets, while also heightening awareness of fiscal oversight and execution risks. The federal intervention in Minnesota following a security incident, which was accompanied by indications of de-escalation and a call for unity, has reduced escalation risks while keeping politics sensitive. The call for a strong dollar policy while allowing it to “find its own level” has added to FX volatility, which indirectly influences commodities and assets.
3. Earnings Concentration and Fragile Market Breadth
Equity markets’ performance today is also being dictated by earnings concentration. The recent sharp declines in individual stocks, particularly in the healthcare sector, underscore the high degree of dependence of overall market performance on a handful of large-cap stocks. Conversely, expectations of earnings announcements by prominent technology firms are providing support to select stocks, particularly in the US market. European markets are also experiencing similar challenges, with sectors struggling to find direction amidst mixed growth trends. This divergence between underlying market breadth and headline index performance is further reinforcing an overall cautious, range-bound market environment.
In conclusion, it is evident that a combination of central bank uncertainty, fiscal policy, and earnings concentration is dictating a subdued market environment today. Investors in both US and European markets are positioning cautiously, awaiting further confirmation from policy communications and economic data before committing to a more sustained directional move.
Digesting Economic Data
The Trump Tweets and Their Implications
The latest series of White House communications appear to be part of a coordinated effort to reinforce institutional authority, moral high ground, and national stability in a period of heightened social and economic sensitivity. The messages related to International Holocaust Remembrance Day were transmitted via official channels, reasserting the administration’s commitment to opposing tyranny and hatred. Although the content is symbolic, the coordinated release suggests an effort to anchor the administration’s narrative in historical responsibility, democratic values, and global moral authority. As a macroeconomic event, the tweets have no material impact on the markets but contribute to the overall perception of political gravitas and consistency, which may have a subtle impact on risk appetite in a period of heightened uncertainty.
From a more substantive standpoint, the executive order on rebuilding Los Angeles wildfires has more direct economic implications. The effort to streamline permitting, allow self-certification, increase waivers, and tie federal aid to approval speed suggests a willingness to override state and local hurdles to rebuilding. This has the potential to create positive catalysts in construction spending, materials, insurance, and infrastructure, while also raising questions about the efficiency and oversight of the rebuilding effort, as evidenced by the audit of California’s use of federal funds for mitigation. The 90-day review of national disaster recovery regulations also suggests the potential for changes in disaster response, which the markets may perceive as a positive catalyst for more efficient fiscal spending in the event of future disasters.
The situation in Minnesota also adds another layer of complexity. The deployment of a border coordinator who reports directly to the White House, as well as the federal-level framing of this event as a national concern, reinforces a sense of a centralized approach to security and crisis management. The fact that this situation may be de-escalating, while also calling for a sense of unity and peaceful protest, may be an effort to balance security with social dynamics. For investors, this means a continued sense of political volatility, particularly with regards to risk assets sensitive to unrest.
Lastly, economic comments made during this appearance in Iowa were also closely watched, particularly with regards to reaffirmations that a strong dollar policy remains unchanged, while also allowing this policy to “find its own level.” The fact that there is a degree of ambiguity with regards to this policy, however, also leaves markets without a clear sense of direction, particularly with regards to a currency that may be sensitive to this situation. The fact that there are also warnings issued with regards to Iraq, with regards to a sense of direction in their leadership, also adds another layer of geopolitical risk, reminding markets that this type of risk remains on the table. Overall, January 27th represents a high-impact policy day not necessarily with regards to a specific event, but rather with regards to the collective impact of fiscal intervention, security dynamics, economic ambiguity, and geopolitical risk.
Home Price Growth Reaccelerates, Reinforcing Housing Resilience Despite Rate Pressure
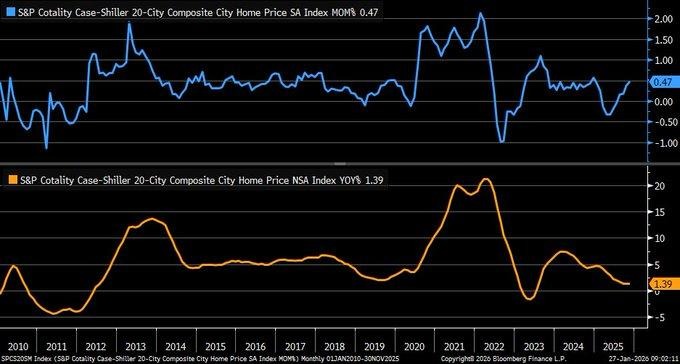
The latest home price data provided evidence of a stronger-than-anticipated monthly increase, reinforcing the notion that housing demand is more resilient than the market had anticipated. The month-over-month increase more than doubled the consensus expectation, while the year-over-year growth rate also increased from the previous reading. This data further reinforces the notion that supply chain pressures and household balance sheet strength are outweighing housing affordability pressures, despite the elevated rate environment. From a macro perspective, this data reduces the near-term downside risks to residential investment while reinforcing the notion of stabilization in the housing market, rather than a rollover.
The data also provided evidence of price growth being driven by supply chain pressures, with limited inventory levels and supply response lagginess across major metropolitan areas. Although transaction volumes are low, sellers are not cutting prices, which is reinforcing the floor in home prices. This environment is more favorable to companies that are levered to housing turnover and home improvement activity, rather than those that are levered to transaction volumes. Importantly, the persistence of price growth also limits the ability of inflation to rapidly disinflation, which is reinforcing the notion that the policy environment will be more restrictive for longer than the market had anticipated.
In this environment, Home Depot appears to be undervalued based on its long-term earnings power and normalized demand profile. This is because the housing market is providing structural support to home improvement expenditures, with existing homeowners locked into their current homes and choosing to renovate rather than relocate. Analysts should be paying close attention to same-store sales trends, contractor demand indicators, and margin behavior as input costs stabilize. Importantly, any evidence of acceleration in professional customer activity would reinforce the notion that housing-related consumption is more durable than the macro environment.
Private Payroll Growth Spikes, Signaling Momentum but Raising Data-Quality Flags
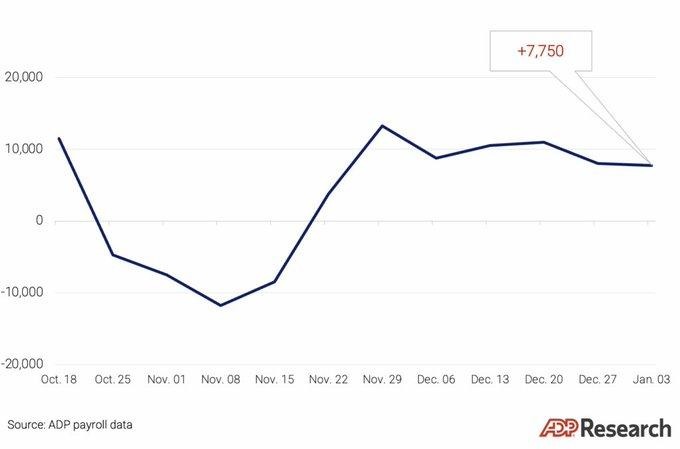
Current private payrolls data indicates an unusually strong acceleration in hiring when examined on a four-week moving average through early January. The rate at which private payrolls are adding new employees appears much stronger than normal, indicating business health and short-term labor market strength. From a broader economic perspective, the data indicates that short-term economic growth remains stable and that the risk of a recession in the near term has diminished somewhat. However, the magnitude of the acceleration should raise some eyebrows and suggest that the data should be viewed as directional rather than necessarily indicative of underlying business health, as the data almost certainly reflects seasonal and holiday-related distortions.
It should also be noted that the composition of the hiring acceleration will be far more important than the magnitude, and that the hiring acceleration will almost certainly represent temporary hiring rather than sustained business health. Labor pressures, which have persisted due to the current labor market environment, will continue to pressure the bottom line of labor-intensive businesses while benefiting businesses that have the ability to automate and pass on higher labor costs to customers. Finally, the hiring acceleration will make it much more difficult for the Federal Reserve to provide any significant easing in financial markets, as the private payrolls data indicates that labor markets remain strong and that there is little pressure on the Fed to provide any significant support.
In light of the above, ServiceNow appears to be undervalued relative to long-term earnings visibility and the company’s role in workflow automation within the enterprise. Analysts should pay close attention to spending intentions and margin acceleration as operating leverage benefits the company’s bottom line, and should view confirmation that businesses are investing to offset labor intensity as further evidence that productivity enablers like ServiceNow remain an attractive investment even if private payrolls data remains volatile.
Richmond Fed Manufacturing Remains in Contraction as Cost Pressures Re-Emerge
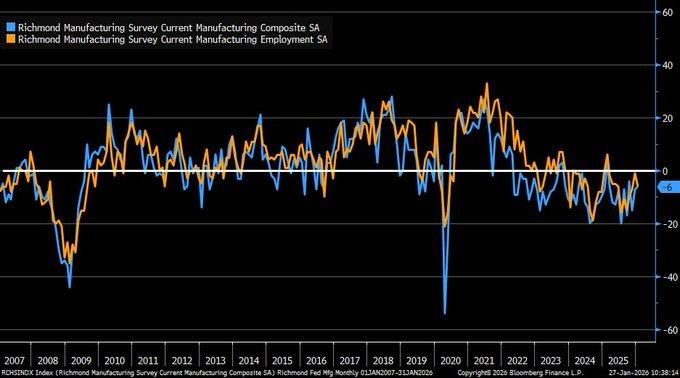
The Richmond Fed Manufacturing Index rose marginally in January, up from -7 in December, but still below the expected -5, indicating that the Fifth District factory activity is still in contraction mode. Although the increase is a positive sign, the Richmond Fed report, which polls more than 100 manufacturers, also points to the uneven nature of the recovery process. New orders and shipments have slowed the rate of decline compared to the previous month, indicating a tentative return towards normalization, but the increase is still not significant enough to indicate a change in the trend. As a regional report, the Richmond Fed is still ahead of the national data, and its January report is consistent with the 2026 theme of muted industrial activity.
Of greater concern for forward margins, prices paid increased to their highest level since September, suggesting a resumption of input cost pressures, even as demand remains weak. The employment component also weakened, suggesting that manufacturers are remaining cautious on hiring. From a policy perspective, this mix of weak demand and sticky input cost pressures seems consistent with a Federal Reserve that remains data-dependent in its rate decisions, as inflation pressures are not entirely neutralized, despite a moderation in activity.
In this backdrop, industrial automation and process control companies appear undervalued, particularly those with a higher efficiency-driven capital expenditure exposure versus volume-driven exposure. Companies such as Emerson Electric, with exposure to automation, digital manufacturing solutions, and mission critical industrial systems, appear more aligned with a world in which manufacturers are seeking to offset labor weakness and cost inflation through efficiency-driven capital expenditures. Analysts should be paying close attention to trends in capital expenditure intentions, pricing trends within the automation space, as well as order trends related to maintenance and efficiency-driven spending. As manufacturing activity continues to be constrained, those companies that help facilitate cost control and efficiency are likely to be rewarded relative to their peers.
Consumer Confidence Plunges to Cycle Lows, Sparks Alarms on Spending
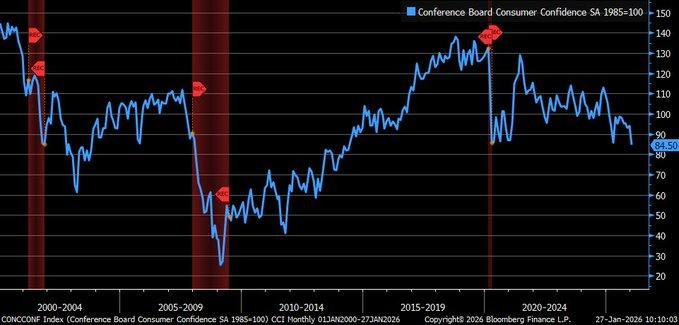
The Consumer Confidence Index for January 2026 posted a dramatic decline of 9.7 points to 84.5, the lowest level since May 2014, and well below the 91.0 estimate. The core indices also posted significant declines, with the Present Situation Index plummeting to 113.7 and the Expectations Index plummeting to 65.1, far below the 80 level that has preceded every recession since 1967. The index posted this dramatic decline after the upwardly revised 94.2 reading in December. The size of the decline ranks among the largest on record, rivaling the largest declines before high levels of volatility and economic slowdown.
The underlying drivers of the confidence shock include inflation fatigue, cost of living pressures, and the beginning of a softer labor market, which are all impacting consumer confidence. Although the current state is more favorable than forward-looking consumer sentiment, the underlying issue is the sharp decline in consumer confidence, which is a more important leading indicator of actual consumer spending. Consumer spending is responsible for about 70% of the total economic output, so a pessimistic outlook at current levels is a negative sign for future consumer spending. From a policy perspective, the current data supports the position of a cautious central bank, as the weakening consumer sentiment counters the underlying inflation pressures, which could delay any future rate decisions.
In the current environment, consumer-facing companies that are more defensive in nature appear to be relatively more undervalued compared to discretionary companies that are more susceptible to the fluctuations in consumer sentiment. For example, companies such as Procter & Gamble, which have a presence in essential goods, are more likely to be able to manage the current weakness in consumer demand while maintaining margins. Analysts should be focused on the release of future retail sales, personal consumption, and earnings guidance for discretionary companies to determine whether the weakness in consumer sentiment is impacting actual spending. If the current levels of confidence remain weak, capital is likely to flow towards more defensive companies such as those in the staples sector.
Broad Dollar Weakness Near Key Support Signals Changing Macro Tailwinds
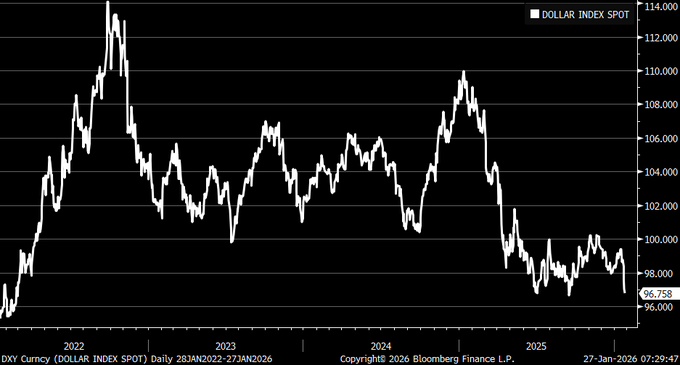
An overview of recent currency market trends reveals that the dollar is continuing to weaken. The dollar is currently nearing a technically important support level that was last seen several months ago. The dollar’s prolonged pressure at this particular time indicates a gradual rotation of global capital flows towards risk-sensitive and non-dollar assets. From a macro perspective, a weakening dollar improves overall financial conditions, facilitates global liquidity transmission, and indirectly provides a tailwind to corporate earnings for companies with significant international exposure.
This is not an isolated phenomenon; rather, it is a reflection of a broader macro environment. A weakening dollar generally provides support to commodity prices, improves the relative competitiveness of exporters, and helps to convert foreign revenues back into domestic corporate earnings. However, it can also have a negative effect on overall costs due to imported materials. From a macro perspective, the question is not about the dollar weakening, but rather whether it will break down past support levels. This will have a significant effect on the overall market. Analysts should consider this trend as a leading indicator of sector leadership.
From a macro perspective, Coca-Cola is currently undervalued based on its global revenue footprint and price power. The company currently earns a significant amount of revenue outside its domestic market. Analysts should focus on foreign exchange sensitivity within its overall earnings, price power to protect margins, and commodity costs due to their sensitivity to currency shifts. The weakening dollar trend will be beneficial to Coca-Cola.
Rising Shutdown Probabilities Reintroduce Policy Uncertainty Into Markets
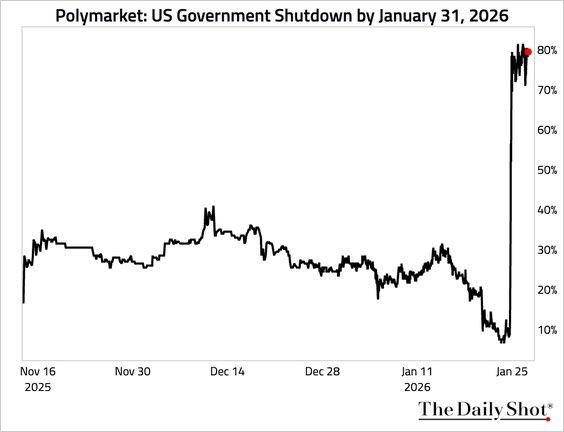
Market-based probabilities of a near-term government shutdown have increased significantly, reflecting rising budgetary and funding-related policy uncertainties. Although shutdown-related uncertainties tend to be short-lived, the repricing of probabilities is important, reflecting rising institutional caution and policy risks at a critical time in the economic cycle. Over time, even the risk of a shutdown has been known to affect market sentiment by delaying business decisions, slowing down government-related spending, and impacting volatility in rates and stocks, regardless of whether a shutdown occurs or not.
From an economic perspective, shutdown-related risks tend to affect confidence indicators before impacting actual economic data. Businesses that rely heavily on government spending, infrastructure, and regulatory approvals may delay spending, while households tend to be cautious amid rising uncertainties. Although shutdown-related risks have been known to be limited in their impact on economic growth, markets tend to respond to shutdown-related risks by favoring defensive stocks and businesses that tend to be less dependent on government funding cycles. Therefore, analysts should recognize that this repricing of shutdown probabilities represents a short-term uncertainty shock rather than a long-term structural growth risk, which could impact capital flows and sectoral leadership.
In a market environment where shutdown probabilities are rising, Lockheed Martin appears to be relatively undervalued against the backdrop of long-term contract visibility and strength in its backlog. While market sentiment may be subject to short-term fluctuations related to funding cycles, Lockheed Martin’s long-term defense contracts and diversified international customer base provide a level of earnings durability that tends to be mispriced during periods of political uncertainties. Therefore, analysts should focus on budget resolution, contract authorization, and cash flow rather than shutdown-related probabilities, which tend to be subject to short-term fluctuations. Businesses with long-duration revenues and relatively insulated business models tend to perform relatively better during periods of rising uncertainties.
Forward-Looking Indicators Weaken as Current Economic Conditions Remain Firm
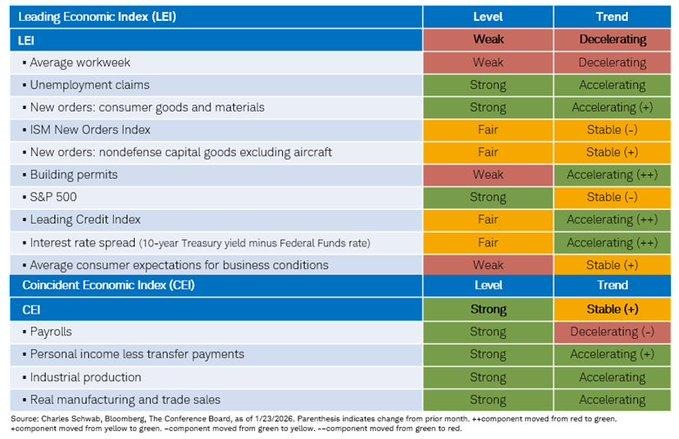
The latest round of leading economic indicators continues to support a weakening growth pattern, while current conditions in the economy remain firm. Forward-looking indicators such as housing permits, average workweek, and household expectations are all pointing towards a slowing growth pattern in the coming days. For instance, a weakening in building permits and average workweek suggests that current demand visibility may not be as robust as it has been in the past few months. These factors may not augur well with the market as a whole, as current conditions in the economy remain firm. For instance, a strengthening in manufacturing orders related to new orders suggests that some pockets of manufacturing demand may still be growing at a faster rate than others. However, a look at leading economic indicators suggests that growth may be slowing down rather than speeding up in the coming days.
On the other hand, coincident indicators related to economic conditions such as payroll activity, industrial production, and real sales remain firm and may not augur any bad news in the coming days. This may mean that analysts should not expect any adverse impact on earnings and economic activity in the coming days; however, analysts should understand that this phase may not last long and should start to look at balance sheet strength and demand visibility more than ever before. Johnson & Johnson appears to be undervalued and may perform better in the coming days as it has a stronger balance sheet and a more stable cash flow statement than ever before. Johnson & Johnson may perform better in the coming days as it has a stronger balance sheet and a more stable cash flow statement than ever before.
Workplace AI Usage Rises Gradually as Adoption Remains Uneven
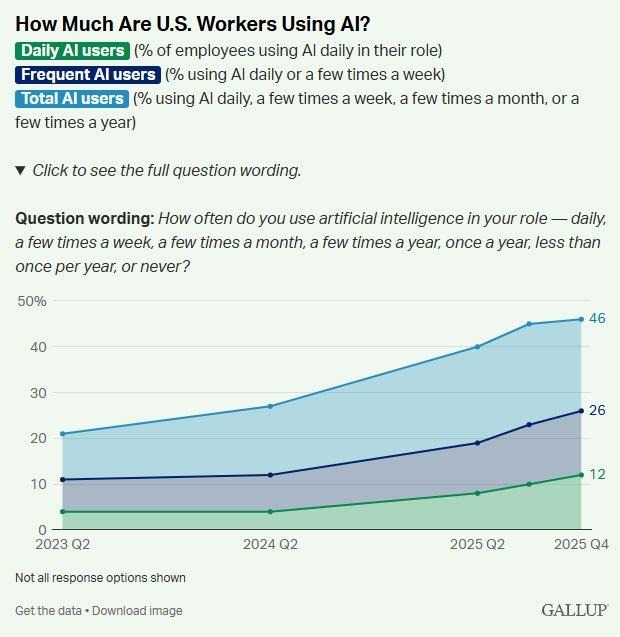
Recent workforce survey data indicates that daily usage of AI technologies has risen marginally, with overall exposure rising steadily within the labor force as a whole. Total participation is rising, indicating rising overall awareness and experimentation with AI-based technologies. However, nearly half of the workforce still does not use AI at all, indicating a notable gap between early adopters and the overall workforce as a whole. This indicates that AI usage is rising but not to a level of universal operational integration.
More importantly, daily usage trends appear to have peaked, with regular usage growth stalling after a period of steady growth since mid-2023. This indicates that, at present, the overall pace of AI adoption is not being limited by availability but by implementation difficulties. Businesses appear to be testing AI technologies rather than integrating them into overall business processes. From a macro-labor perspective, this dampens expectations of rising productivity acceleration in the near term, indicating that AI-based productivity gains are rising gradually rather than explosively.
Within this context, Microsoft appears undervalued compared to overall productivity monetization potential over the long term. This is because, as businesses move from testing to implementation, platforms that integrate AI directly into daily productivity tools have the highest potential to drive rising usage trends. Analysts should look at enterprise adoption metrics, user-level monetization trends, and signs of integration at the workflow level rather than overall AI enthusiasm. Recent data indicates that the next leg of value creation will not be driven by the speed of AI adoption but by the depth of implementation.
Indicators of Broad Activity: Signs of Stabilization but Not Full Recovery
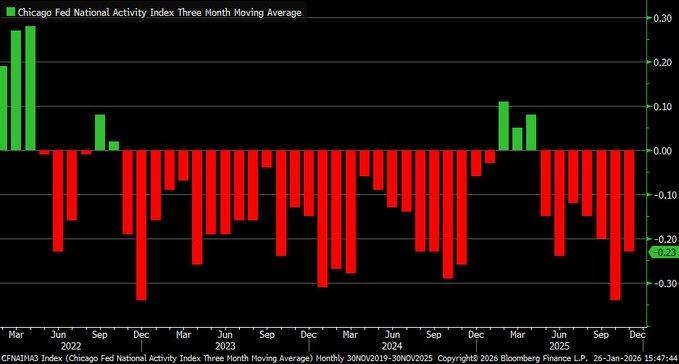
The latest economic activity indicator, which is broad-based in nature, reflects a modest improvement in economic activity when measured over a three-month average. This indicates that the rate of slowdown is slowing down. Although the latest figure is less negative compared to the previous one, it is still below the trend level, reflecting an extended period of sub-par economic growth. This indicates that the economy is not slowing down sharply, but nor is it gaining sufficient momentum to signal the start of a new expansion phase. From the analytical perspective, this is consistent with the view of a slow-growth rather than a falling or rising economy.
The key point here is that the persistent negativity in the economic activity indicator over the last few consecutive months indicates that the pressure remains in the key components of the economic activity indicator, which include production, employment intensity, and consumption-related activity. Although the latest figure is more positive, the overall message remains one of below-trend economic growth. Analysts should view this as a sign that the process of normalization is taking longer than the markets had anticipated.
In this context, the current valuation of Procter & Gamble appears undervalued in comparison with the stability in earnings that the company is likely to generate. As a company with a consistent track record of generating cash and being less sensitive to the broader economic cycles, the company is likely to perform steadily in a period of below-trend economic growth.
Business Investment Expectations Improve Despite Volatile Backdrop
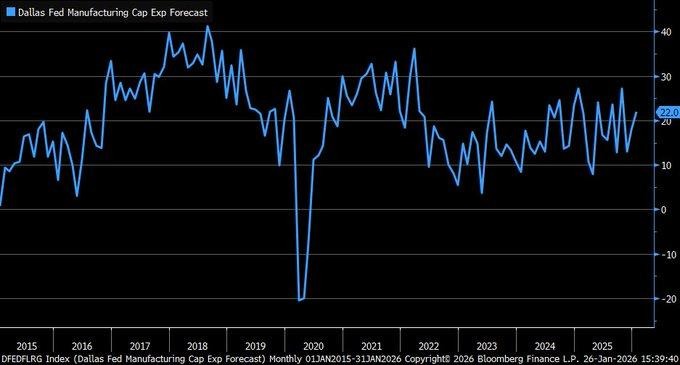
According to recent survey-based capital expenditure expectations, there has been a notable improvement over the last few months, even though the business investment pattern remains volatile. After a long period of stop-and-go capital spending, businesses are now showing greater willingness to invest capital in equipment, technology, and other productivity-enhancing areas. This is important because capital spending is a forward-looking indicator of business confidence and output growth. Although financing conditions remain constrained, business investment expectations show that businesses are adapting to the situation rather than retreating, with a greater focus on efficiency and long-run competitiveness rather than short-run risks.
The volatility in business investment over the last two years may be attributed to uncertainty over growth durability, cost structures, and policy conditions. However, the recent upward trend in business investment shows that businesses are gradually becoming more comfortable investing capital, especially in areas that improve business efficiency. This does not imply a broad-based business investment boom, but rather a targeted business investment recovery, especially in automation, digital infrastructure, and energy efficiency. Analysts should note that this trend is a stabilizing factor rather than a cyclical pick-up in business investment.
Against this backdrop, Honeywell appears to be an attractive pick, especially considering its exposure to capital spending in automation, aerospace, and energy efficiency. As businesses gradually pick up capital spending, demand for efficiency-driven industrial technologies will likely remain resilient. Analysts should note that a sustained improvement in capital spending expectations will be a positive factor for industrial businesses that are more focused on productivity-led capital spending rather than volume-driven business cycles.
Capital Goods Momentum Eases but Investment Cycle Remains Intact
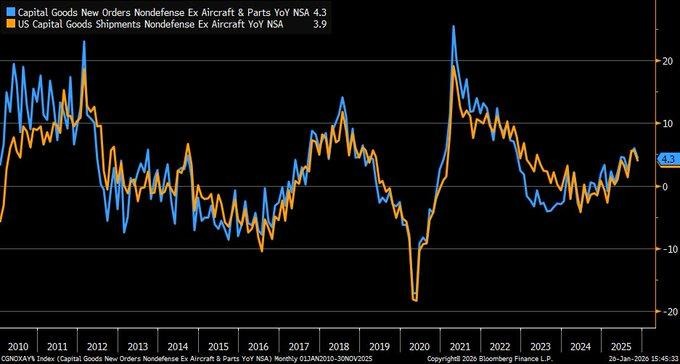
The latest capital goods data shows a deceleration in year-over-year growth rates for both core equipment orders and shipments, which indicates a loss of short-run capital goods momentum in business investment activity. The growth rates in capital goods activity eased in the latest release, but the underlying trend remains positive, which indicates that businesses continue to invest, albeit at a slower rate. From our point of view, this simply represents a maturing investment cycle rather than a collapse. Businesses appear to be responding to tighter financial conditions and demand uncertainty by reassessing their spending plans, not abandoning capital spending altogether.
The distinction between orders and shipments becomes important at this point in the capital goods cycle. The former represents forward spending intentions, while the latter represents current spending activity. The fact that both orders and shipments remain in positive trend territory suggests that existing spending pipelines continue to be worked through, even if new spending intentions are slowing. This supports our view that businesses continue to invest productively, which helps to stabilize growth without creating supply imbalances.
We would note that a sharper roll-over in capital goods orders would be an important warning sign that corporate confidence is weakening more significantly, and analysts should be watching that metric over several months. Deere & Company appears to be undervalued in relation to capital spending tied to productivity and efficiency enhancements. The demand drivers for capital goods, particularly those with advanced technology, remain positive in relation to long replacement cycles and output optimization rather than volume growth. The former does not decline with economic cycles, while the latter does.
Investor Flows Indicate Rotation into Global and Defensively Allocated Assets
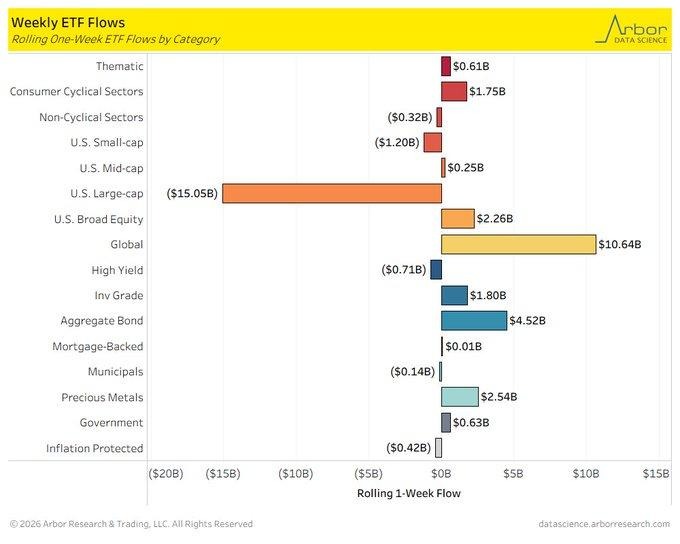
Investor flows indicate a significant rotation out of domestic large-cap equities, with investors rotating into international equities, bonds, and precious metals. This rotation appears to be a reflection of increasing sensitivity to valuation concentration risk and a re-evaluation of relative investment opportunity. After an extended period of dominance of large-cap growth equities, particularly those with high concentration risk, investors now appear to be rebalancing their portfolios in line with changing macro conditions.
From our point of view, this does not represent a risk-off attitude, but rather a rebalancing of portfolios in line with changing conditions. The investor flow data provides useful insight into investor attitudes and priorities. Investor flows into bonds indicate increasing demand for income security and duration risk management. Similarly, investor flows into precious metals indicate an ongoing demand for portfolio diversification and purchasing power protection. Investor flows into international equities indicate an increasing allocation to international equities, suggesting that valuation gaps and earnings catch-up potential in international equities are becoming more compelling.
From an analyst’s point of view, this should be seen as a tactical rotation, rather than an outright move away from equities, and could have implications for relative performance within the equity market. From an investment point of view, Vanguard FTSE Developed Markets ETF (VEA) appears undervalued compared to its earnings diversification and valuation discount compared to domestic large-cap equities. With investors continuing to seek under-owned regions with improving fundamentals, broad international exposure could represent a balanced way of playing this rotation.
Regional Manufacturing Signal Turns Positive, Suggesting Early Cycle Stabilization
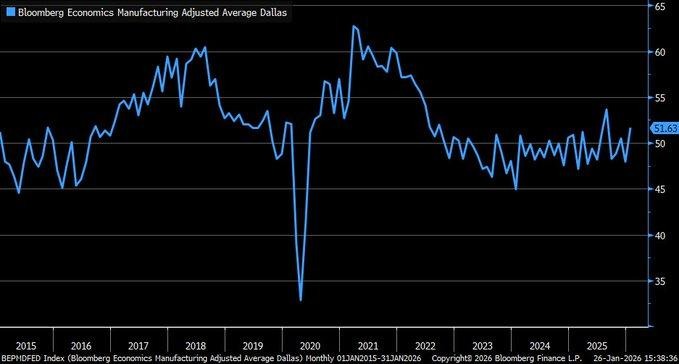
The latest adjusted regional manufacturing data indicates that manufacturing activity is rising back into expansion territory, which is an important inflection point in the data series that has been tracking sub-trend performance for an elongated period. When this data is compared against the national manufacturing methodology, the index is now above the threshold level, which indicates that manufacturing output, orders, and operating conditions have collectively improved at the beginning of the year. This indicates that manufacturing headwinds are abating and that inventory normalization and demand recovery are helping the sector, rather than stimulus-driven demand.
It is important to note that this improvement in the manufacturing sector should be contextualized in the broader context of the regional manufacturing data series that has been volatile over the past few years. Analysts should note that while there may have been an improvement in the manufacturing sector in the latest data release, there is still a need to see sustained improvements in the sector in the coming months before analysts should start to feel more optimistic about the sector.
From an investment perspective, Illinois Tool Works appears to be undervalued compared to its exposure to the incremental manufacturing recovery and its strong margin discipline. The company’s diversified industrial exposure and its focus on high-value engineered solutions make it well-positioned to benefit from improvements in the manufacturing sector without the need for volume growth.
Upcoming Economic Events
Federal Funds Rate Decision, FOMC Statement, FOMC Press Conference
As the financial markets are approaching a critical juncture in monetary policy decisions, the focus of investors remains fully concentrated on the central bank’s decision. Financial conditions are already tight, and the asset valuation is highly sensitive to interest rate changes. This decision by the central bank is highly critical and poses a great risk of financial market volatility. The financial markets are not only focused on the interest rate decision but are also considering the guidance and perspectives of the policymakers. This decision may have a great impact on the financial markets, even if the interest rates are not changed.
Federal Funds Rate Decision
The policy rate decision will set the immediate tone for global markets.
- If the outcome is more restrictive than forecast—either through an unexpected hike or guidance implying rates will remain elevated for longer—financial conditions would tighten further. In this scenario, equity markets would likely face renewed valuation pressure, particularly in growth-oriented and rate-sensitive segments such as technology, real estate, and consumer discretionary. Bond markets would likely see higher short-term yields as expectations for future easing are pushed further out, while risk appetite broadly deteriorates.
- Conversely, if the decision is more accommodative than forecast, markets could respond positively. Lower or softer guidance would ease discount rate pressure, support equity multiples, and drive demand for longer-duration bonds. This outcome would favor growth equities and credit-sensitive assets as investors reassess downside risk.
FOMC Statement
The policy statement will be monitored for any change in tone with regard to inflation dynamics, labor market conditions, and the sustainability of demand.
- If the statement places greater emphasis on inflation risks or pressures than the market is expecting, this will be supportive of the current cautious stance. This will likely have the effect of reducing the market’s expectations of future policy flexibility, weighing on equities, and increasing defensive positions. Analysts should also be aware of any mention of services inflation and wage pressures, as these are key areas of concern.
- On the other hand, if the statement highlights the moderation of inflation pressures or the appearance of signs of economic cooling, this will be interpreted as a shift towards balance. This should be supportive of the view that the current policy tightening cycle is close to its end, providing relief for risk assets.
FOMC Press Conference
The press conference is arguably the most market-sensitive part of the monetary policy cycle.
- If the Fed takes a firm tone, downplaying growth risks or questioning the market’s assumptions regarding the need for easing, this could lead to a sharp reaction in the markets, with equities selling off and volatility spiking. In this event, bond yields could continue to rise as the market adjusts its assumptions regarding the policy path.
- Alternatively, if the tone is more data-dependent and highlights the progress being made towards the policy goals, this could be interpreted as flexibility rather than rigidity. This should be supportive of the view that policy risks are becoming more stable, leading to a rally in equities and renewed demand for fixed income durations.
Stock Market Performance
Indexes Rebound From August Lows, But Drawdown Data Signals Uneven Recovery
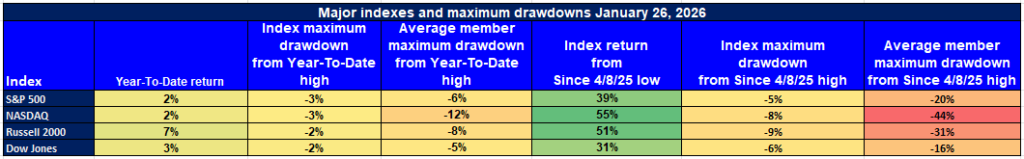
Equity markets have staged a meaningful rebound from the early-August 2025 lows, but performance beneath the surface remains uneven. While headline indexes show solid gains from the August 4/8/25 trough, year-to-date returns are modest and drawdown data highlights a continued gap between index-level strength and average member performance. From our perspective at Zaye Capital Markets, this divergence reinforces the need for selectivity, as broad participation has yet to fully confirm the rally.
Here is our breakdown using the exact figures shown in the chart:
S&P 500: Stable Headline Gains, Moderate Internal Stress
YTD return: +2% | Max drawdown from YTD high: -3% | Avg. member drawdown from YTD high: -6% | Return since 4/8/25 low: +39% | Max drawdown since 4/8/25 low: -5% | Avg. member drawdown since 4/8/25 low: -20%
The S&P 500 has delivered a steady 2% year-to-date gain while rebounding sharply, up 39% from the August low. Index-level drawdowns remain contained, but the average constituent continues to lag, indicating that gains are still more concentrated among larger, higher-quality names rather than evenly distributed across the index.
NASDAQ: Strong Rebound Masks Deeper Member Volatility
YTD return: +2% | Max drawdown from YTD high: -3% | Avg. member drawdown from YTD high: -12% | Return since 4/8/25 low: +55% | Max drawdown since 4/8/25 low: -8% | Avg. member drawdown since 4/8/25 low: -44%
The NASDAQ has led the recovery from the August low with a 55% surge, yet year-to-date performance remains limited at 2%. The wide gap between index drawdowns and average member drawdowns highlights persistent volatility within growth and technology segments, suggesting that leadership remains narrow and sensitive to sentiment shifts.
Russell 2000: Small-Cap Recovery Still Lacks Conviction
YTD return: +7% | Max drawdown from YTD high: -2% | Avg. member drawdown from YTD high: -8% | Return since 4/8/25 low: +51% | Max drawdown since 4/8/25 low: -9% | Avg. member drawdown since 4/8/25 low: -31%
Small caps have posted the strongest year-to-date gain at 7% and a solid 51% rebound from August lows. However, average member drawdowns remain elevated, underscoring fragile balance sheets and higher sensitivity to financing conditions. This suggests selective strength rather than a broad-based small-cap resurgence.
Dow Jones: Relative Resilience With Narrower Dispersion
YTD return: +3% | Max drawdown from YTD high: -2% | Avg. member drawdown from YTD high: -5% | Return since 4/8/25 low: +31% | Max drawdown since 4/8/25 low: -6% | Avg. member drawdown since 4/8/25 low: -16%
The Dow Jones continues to show comparatively defensive characteristics, with modest year-to-date gains and shallower drawdowns both at the index and member level. The smaller gap between headline performance and average constituent performance points to more balanced participation, though upside remains more measured than in growth-heavy benchmarks.
Our View at Zaye Capital Markets:
While the rebound from August lows has been impressive, drawdown dispersion confirms that market strength remains selective. Until average member performance improves meaningfully, we continue to favor quality, balance-sheet strength, and earnings visibility over broad beta exposure, while closely monitoring breadth for confirmation of a more durable market phase.
The Strongest Sector in All These Indices
Materials Leads the Way Year to Date, While Communication Services Wins the Session
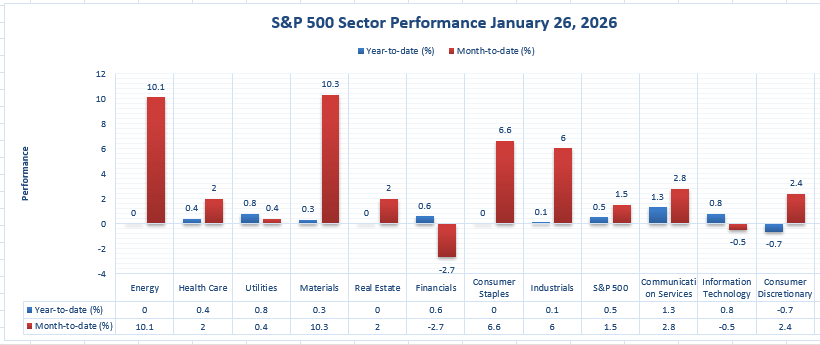
From the perspective of Zaye Capital Markets, this sector overview suggests a dichotomy of trend leadership and short-term risk-on rotation. Materials clearly leads the way year to date, the strongest sector in the entire chart, while the strongest sector on the day is clearly Communication Services.
Materials: The strongest sector year to date
Year to Date: +10.3% | 1/26/2026: +0.3%
Materials leads the pack year to date with a +10.3% gain, narrowly ahead of the Energy sector, which is up +10.1% year to date. Materials also led the pack on 1/26/2026 with a +0.3% gain, a relatively modest day in the sector that suggests leadership is being built on a year-to-date basis rather than on a day-to-day basis. To our mind, this reflects the sustained investor demand for sectors that are tied to physical inputs, pricing leverage, and supply chain normalization in a world where the S&P 500 is up a mere +1.5% year to date.
Communication Services: The strongest sector on the day
1/26/2026: +1.3% | Year to Date: +2.8%
Communication Services clearly won the day with a +1.3% gain, pushing its year-to-date gain to +2.8%. While this sector is clearly the leader on a day-to-day basis, the year-to-date performance is not yet in the same league as Materials and Energy, sectors that are clearly the leaders in this market so far this year, while the rest of the market struggles, with Financials down -2.7% year to date and Information Technology down -0.5% year to date.
Earnings
Earnings Recap— January 27, 2026 (Yesterday)
Earnings released yesterday reflected a market that continues to reward execution and guidance clarity while punishing uncertainty. Results were mixed across healthcare, industrials, aerospace, and utilities, highlighting growing dispersion beneath the headline numbers.
- UnitedHealth Group delivered adjusted EPS of $2.11 versus $2.09 expected on $113.2 billion in revenue, up 12.3% year over year, but issued 2026 revenue guidance above $439 billion, which came in below expectations. The combination of $1.6 billion in restructuring and cyber-related charges and softer forward visibility drove negative sentiment despite the earnings beat.
- RTX Corporation reported adjusted EPS of $1.55 versus $1.47 expected, with revenue of ~$24.2 billion, up roughly 12% year over year, reinforcing stability in defense and aerospace demand. Guidance for 2026 EPS of $6.60–$6.80 supported confidence in backlog-driven earnings visibility.
- Boeing posted a sharp turnaround, reporting adjusted EPS of $9.92 compared with a year-earlier loss, while revenue rose 57% year over year to ~$23.95 billion, supported by 139% growth in commercial airplane revenue and a ~$682 billion backlog.
- HCA Healthcare reported adjusted EPS of $8.01 versus $7.46 expected, raised 2026 EPS guidance to $29.10–$31.50, and authorized up to $10 billion in share buybacks, underscoring strong cash generation despite modest revenue growth.
- Union Pacific delivered full-year EPS of $11.98, up 8% year over year, while NextEra Energy posted adjusted EPS of $0.54 versus $0.53 expected and reaffirmed 2026 guidance of $3.92–$4.02, reinforcing defensive earnings stability. LVMH showed ~1% organic sales growth, but margin pressure highlighted uneven global luxury demand.
Earnings Preview — January 28, 2026 (Today)
Today’s earnings slate is heavily skewed toward global growth, technology, and capital-intensive leaders, making guidance and forward commentary the primary market catalysts.
- Meta Platforms enters the session with consensus EPS near $8.17, with investor focus on advertising demand durability, AI monetization progress, and margin sustainability. Any deviation in engagement or cost discipline is likely to drive volatility.
- Tesla’s results are expected to hinge on delivery trends, automotive margins, free cash flow discipline, and strategic commentary around AI-driven initiatives. Guidance clarity will matter more than headline earnings.
- Microsoft is expected to report EPS around $3.93 on revenue near $80.23 billion, with markets focused on cloud growth, AI-related spending intensity, and margin resilience amid elevated capital expenditure.
- ASML will be closely watched for signals on semiconductor capital spending, order backlog, and advanced manufacturing demand. ServiceNow’s results will provide insight into enterprise software budgets, renewal rates, and subscription growth.
- Starbucks will be assessed on comparable-store sales and consumer demand resilience, while Volvo AB and MSCI will offer important signals on global industrial demand and institutional asset-allocation activity.
Stock Market Overview – Wednesday, 28 Jan 2026
U.S. stock markets are currently trading on mixed signals. This is as investors seek to balance record-high stock index readings with sector-specific stress, earnings diversity, and positioning ahead of important policy signals. The S&P 500 continues to trade near record highs due to the strength of mega-cap tech and AI-infrastructure stocks. On the other hand, the Dow Jones is struggling due to weakness in the healthcare sector. Small-cap stocks are showing some positive participation, but the overall market is still quite mixed. At Zaye Capital Markets, we still view the market as a selective market rather than a risk-on market.
Stock Prices
Economic Indicators and Geopolitics
The market is currently influenced by earnings reports, economic indicators, and strategic capital allocation trends. Lower confidence and forward-looking statements are weighing on the market. On the other hand, the ongoing trade and tech policy trends continue to influence the semiconductor, energy infrastructure, and defense sectors. This has encouraged investors to seek out companies with pricing power, contracting demand, and long-duration revenue visibility.
Latest Stock News
China has approved the import of the first batch of several hundred thousand NVIDIA H200 AI chips. This is for the three major buyers. This shows that the demand for advanced AI compute is structurally solid. Going forward, the NVIDIA 2028 Feynman platform will likely offer limited multi-sourcing. This will be done through Intel for the I/O die and the EMIB packaging. On the other hand, TSMC will be used for the main GPU die. Intel’s share is likely to be limited to around 25%.
United Health Group currently represents 25% of the large-cap U.S. market value within the healthcare space, demonstrating the extraordinary degree of concentration within this critical industry segment.
Ongoing speculation surrounding the $1.4 trillion IPO valuation of SpaceX launch services continues to reinforce the thesis that launch services, connectivity within low Earth orbit, and orbital infrastructure represent foundational platforms with enduring demand profiles across both the government and commercial sectors.
In the AI infrastructure space, IREN is beginning to emerge as a key beneficiary of what we refer to as the “overflow era,” as hyperscalers are unable to add enough GPUs, power, and data centers to meet the ongoing demand profile. This contracted capacity is arguably the most predictable metric within the space currently, helping to explain the recent price action as investors position for potential large-scale cloud partnerships. The decision to pull earnings forward to early February has also served to heighten the focus.
Micron Technology’s announcement to invest an additional $24 billion within the Singapore market over the next ten years serves to reinforce the thesis that AI demand is driving memory into a long-cycle capacity bottleneck. As AI models become more sophisticated and context-aware, memory intensity is rapidly increasing across data centers, edge computing, autonomy, and agentic systems.
Looking forward, 2026 is being seen as the year agentic AI emerges, with value being transferred from software seat licensing to infrastructure consumption. Cloudflare and DigitalOcean are being positioned as toll road providers for low-latency execution, scalable computing, and API access required for agent workloads.
Rolls-Royce shares rose significantly after it announced a partnership with Microsoft to improve its ADAM robot using cloud-based agentic AI. The partnership demonstrates the ability of software intelligence to improve physical products without incremental investment in hardware.
Meta has pledged to spend up to $6 billion through 2030 on fiber-optic cable to support its AI data center expansion, reinforcing the commitment to AI-related infrastructure development through 2030.
Redwire shares rose after it was named a vendor on a $151 billion missile defense contract, expanding its presence in the defense segment despite the uncertain nature of such contracts.
For cloud services, demand for Azure, AWS, and Google Cloud services continues to outstrip supply, implying that near-term revenue does not reflect the installed base of demand. The key differentiator for each of these cloud services will be the ability to deploy capacity quickly, as capacity constraints become a key determinant of share.
The Magnificent Seven and the S&P 500

The S&P 500 remains heavily influenced by the “Magnificent Seven,” whose outsized index weight continues to mask weakness elsewhere. Despite strong long-term narratives around AI and cloud infrastructure, these stocks are being punished as valuation sensitivity, capital intensity, and supply constraints come under closer scrutiny. With leadership still concentrated and breadth lagging, index upside remains vulnerable to earnings disappointments or shifts in rate expectations.
Major Index Performance as of Wednesday, 28 Jan 2026
- The Nasdaq Composite rose 0.91% to 23,817.10, buoyed by gains in mega-cap tech and AI-related infrastructure stocks.
- The S&P 500 rose 0.41% to 6,978.60, maintaining its record high as it continues to be supported by a small group of leaders.
- The Russell 2000 rose 0.26% to 2,666.70, a reflection of a small improvement in participation.
- The Dow Jones Industrial Average fell 0.83% to 49,003.41, weighed down by weakness in healthcare and economically sensitive components.
At Zaye Capital Markets, we continue to emphasize the importance of discipline in this environment. The broad indexes are rising due to a small group of leaders related to AI infrastructure and cloud capacity and memory investment. The sector dispersion remains high, and we see this as a key area of focus until we see a significant improvement in participation.
Gold Price: Why Is Gold Holding Record Highs Ahead of Fed Decisions and Policy Risk?
The price of gold is currently trading at above $5,200 per ounce, holding near its record highs as of Wednesday, 28 January 2026, which confirms that the market is firmly in a defensive allocation regime. The recent White House communications have reinforced the backdrop of high institutional risk, including strong rhetoric on governance, public order, and federal authority, executive actions to override rebuilding bottlenecks in California, greater scrutiny on disaster funding, and risks to international leadership stability. On the flip side, the recent reaffirmations of a strong dollar stance, allowing the dollar to “find its own level” in the process, have failed to calm foreign exchange market expectations, which in turn supports the price of gold through currency volatility. Today, the Fed’s decision on the Federal Funds Rate, the FOMC announcement, and the press conference will be out, and the market will be looking for policy clarity, not conviction, and a more hawkish stance than anticipated will limit the upside in the near term, while any acknowledgment of slowing growth, policy flexibility, and downside risks will only serve to reinforce the role of gold as a hedge against monetary policy uncertainty and institutional risks.
The economic data from yesterday has already set the stage for this high gold price environment. The mixed economic indicators, which are showing less-than-trend economic growth, uneven labor market momentum, and weak forward-looking indicators, have limited the upside room for real yields, keeping the opportunity cost of holding gold relatively attractive. More importantly, the widening gap between current economic activity remaining strong and leading indicators weakening has created demand for assets that provide purchasing power protection without requiring economic growth acceleration.
In this sense, gold is providing a system-wide stabilization effect to portfolios, helping to offset risks from policy ambiguity, fiscal intervention, and geopolitical communications. Unless policy communications significantly strengthen the currency or real yields, the current positioning of gold above $5,200 is a structural change towards sustained safe-haven demand, as opposed to a risk trade. Investors are not reacting to individual economic data points; they are reacting to the cumulative impact of political, monetary, and economic uncertainty as it relates to long-duration asset protection strategies.
Oil Prices: What Are Global Supply Disruptions and Fed Policy Signals Telling Oil Prices Today?
As of Wednesday, 28th January 2026, oil prices continue to trade in a tightly balanced range with Brent crude trading around ~$67.5 per barrel and U.S. West Texas Intermediate (WTI) crude around ~$62.4 per barrel. Brent crude oil prices have been influenced by factors such as production disruptions in Kazakhstan and significant output losses in the U.S. caused by severe weather conditions. The severe weather conditions led to an output reduction of 2 million barrels per day, halting exports from the Gulf Coast. Brent crude oil prices have also been influenced by factors such as global supply disruptions. The disruptions provided support for oil prices in the near term. Global oil supply is high, and OPEC+ has maintained its pause on production increases. The International Energy Agency’s forecast of ample supply in 2026 and signs of softened global consumption elasticity have capped oil prices.
The comments from the administration, particularly on a strong dollar policy but acknowledging it to “find its own level,” seem to be affecting currency markets, which in turn impact oil prices. The relatively weaker dollar can be favorable to dollar-priced products such as oil, providing a minor lift to oil prices. However, a strong dollar can be a drag on oil prices. The mixed economic data from the US yesterday, reflecting weaker growth momentum, also created risk-off sentiment, which can be unfavorable to oil prices as it dampens oil demand. As investors look forward to today’s Federal Funds Rate decision, FOMC statement, and press conference, it can be argued that an increase in policy uncertainty can sustain the risk-off sentiment, which can be unfavorable to oil prices. If the Fed sounds hawkish, it can strengthen the dollar, which can be unfavorable to oil prices. If it sounds dovish or ambiguous, it can ease financial conditions, which can be favorable to weaker dollar valuations, providing a minor lift to oil prices. In such an environment, oil prices can be quite sensitive to changes in supply, geopolitical risks, policy decisions, and macroeconomic growth expectations.
Bitcoin Prices: Why Is Bitcoin Consolidating Near Key Levels Amid Policy Uncertainty and Fed Risk?
As of Wednesday, 28 January 2026, Bitcoin is trading at $88,900, consolidating after a volatile January that saw the cryptocurrency rally to the mid-$90,000s and subsequently pull back. The price movement indicates that the market is digesting policy risks rather than following the momentum. The recent White House rhetoric has continued to drive the message of centralized authority, institutional control, and federal intervention on multiple fronts, from disaster recovery to domestic and international stability, while also reaffirming that the dollar should be strong but find its own level. The policy risks for Bitcoin, as a result, continue to be relevant, as the ambiguity in the management of the currency and fiscal intervention continues to drive the demand for assets that are not issued by the government. However, the lack of monetary stress also continues to keep the market in check, and the increasing adoption of Bitcoin as a store of value, as evidenced by the proposals to allocate up to 10% of state budgets to the cryptocurrency, the increasing purchases by large corporations for their treasuries, the filing of additional Bitcoin-based ETFs with yield structures, and the increasing interest from global regulators, including Japan and its exploration of the eligibility of Bitcoin ETFs, continue to drive the case for the increasing adoption of the cryptocurrency as an asset class. The recent pullback in the cryptocurrency, as a result, has been absorbed at levels above the mid-$80,000s.
In addition, yesterday’s economic figures contributed to this consolidation process, as investors were left with mixed signals regarding economic growth, employment, and forward-looking indicators. This has left risk assets sensitive to monetary policy announcements, which are expected today. Bitcoin, therefore, is acting as a “macro-reactive asset,” with prices being less dependent on cryptocurrency-related narratives and more dependent on interest rates, liquidity, and policy credibility. This has been emphasized by monetary authorities, who have clearly indicated that policy uncertainty is a headwind for Bitcoin, as well as other risk assets. Nevertheless, the inability of monetary authorities to implement significant monetary policy tightening has helped Bitcoin’s price structure from deteriorating further. Today, investors are awaiting the Federal Funds Rate decision, FOMC announcement, and press conference, which are seen as key catalysts for Bitcoin prices in the near term. A hawkish announcement that strengthens the US Dollar may push Bitcoin prices towards lower support levels, while a balanced announcement may help stabilize risk assets, allowing Bitcoin prices to resume its accumulation process, as it currently stands at around $88,900.
ETH Prices: Why Ethereum is Holding Near $3,000 as ETF Flows and Whale Activity Diverge?
As of Wednesday, 28th January 2026, Ethereum (ETH) is trading around $3,000, holding its ground after a sharp pullback from its highs in the $3,400-$3,450 zone in mid-January, as depicted in the latest price action. The sharp fall in Ethereum prices is a result of profit-taking and resistance from its previous supply levels, rather than an issue with Ethereum’s structural story. Over the last week, spot Ethereum ETFs have seen net outflows on multiple trading sessions, depicting a period of caution from institutional investors amid high macro uncertainty and rate volatility. This has led to selling pressure on Ethereum as it failed to hold above the $3,200-$3,300 zone. However, ETF flows have continued to remain active, indicating that institutions are adjusting their exposure rather than exiting the Ethereum space altogether. The current price holding around $3,000 indicates that this level may be an equilibrium zone for buyers and sellers as they reassess their positions before better macro and policy indicators.
The latest whale activity over the past week has added another layer of complexity to this narrative. Whale accumulation of ETH on dips below $2,950 and distribution around previous highs support the range-bound structure of the Ethereum price. Large wallet movements of tens of thousands of ETH indicate a rotation of assets and not a capitulation of whales, as some whales continue to add to their positions on dips and others sell on strength. The absence of whale capitulation in the current environment indicates that whales’ confidence in Ethereum’s medium-term position as the dominant smart contract and decentralised layer on top of the network remains intact.
In the current environment, ETH is a high-beta macro asset that is sensitive to interest rate expectations and liquidity conditions but is supported by medium- and long-term trends of adoption and use cases. Its current price near $3,000 is a function of consolidation and position-taking as markets absorb ETF flows, whale movements, and overall sentiment.
